0553
Fast and repeatable multi-parametric mapping using 3D Echo-Planar Time-resolved Imaging (3D-EPTI)1Athinoula A. Martinos Center for Biomedical Imaging, Massachusetts General Hospital, Charlestown, MA, United States, 2Harvard-MIT Health Sciences and Technology, MIT, Cambridge, MA, United States, 3Department of Electrical Engineering and Computer Science, MIT, Cambridge, MA, United States, 4Department of Radiology, Stanford University, Stanford, CA, United States, 5Department of Electrical Engineering, Stanford University, Stanford, CA, United States
Synopsis
3D-EPTI is a recent multi-parametric mapping technique capable of rapid T1,T2,and T2* quantification. In this work, we characterize the repeatability of two optimized 3D-EPTI whole-brain protocols at 1-mm and 0.7-mm isotropic resolutions (3- and 9-minutes), suitable for a range of clinical and neuroscientific applications. Scan-rescan across 5 subjects shows low intra- and inter-subject variabilities in the derived quantitative-metrics across 165 brain-regions using automatic FreeSurfer segmentation. High-repeatability of quantitative measures across cortical depths was demonstrated using the 0.7-mm protocol, indicating its potential for robust-and-repeatable cortical myeloarchitecture investigation. Lastly, synthetic 3D-EPTI images were demonstrated to be in high-agreement with clinical contrast-weighted images.
Introduction
Multi-parametric imaging provides the ability to quantitatively measure various tissue properties with less bias from system conditions than conventional weighted imaging. However, the major limiting factor of multi-parametric imaging is its limited acquisition efficiency. Many emerging methods including MR fingerprinting1 and multi-tasking2 have been developed to improve the efficiency and reliability of quantitative imaging.Recently, we have developed a new method termed 3D Echo-Planar Time-resolved Imaging (3D-EPTI)3, which utilizes continuous readouts and optimized spatiotemporal encoding4,5 to achieve rapid multi-parametric imaging of T1, T2, and T2*. In this work, we develop two optimized 3D-EPTI whole-brain protocols at 1-mm and 0.7-mm isotropic resolutions with acquisition times of 3- and 9-minutes, suitable for a range of clinical and neuroscientific applications. We characterize the performance and repeatability of these protocols through test-retest experiments on five healthy volunteers, where low intra- and inter-subject variabilities were observed. With the high-resolution 0.7-mm protocol, cortical depth analysis was performed to demonstrate good repeatability of quantitative measurements across cortical depths, pointing to the potential in using 3D-EPTI for robust-and-repeatable investigation of myeloarchitecture of the human brain. Finally, quantitative maps acquired by 3D-EPTI were also used to generate synthetic weighted-images with high-agreement with clinical contrast-weighted scans.
Methods
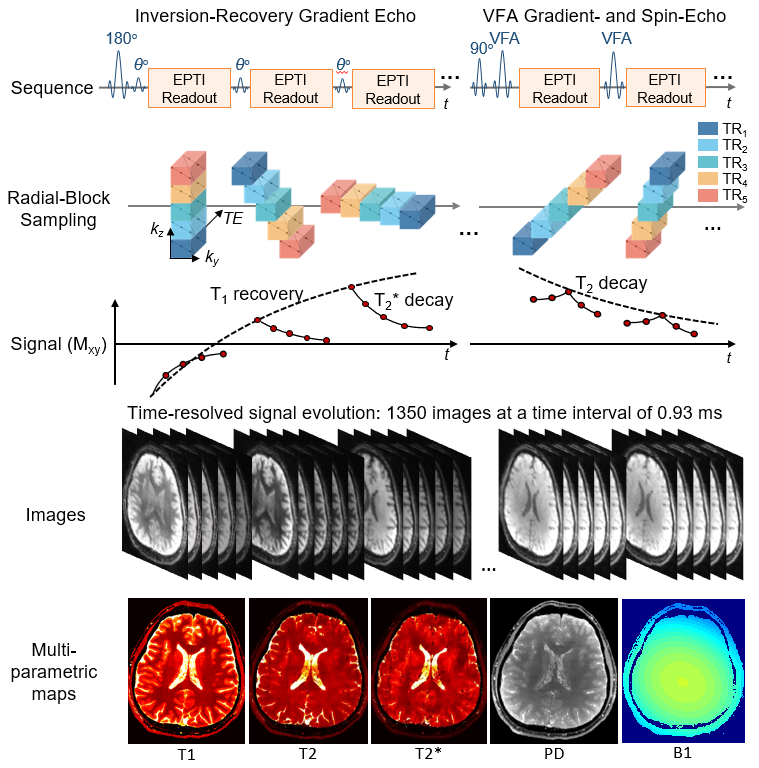
Acquisition: The 3D-EPTI pulse sequence is shown in Fig.1. To simultaneously obtain T1, T2, T2*, proton density and B1+ field, a combination of inversion recovery gradient echo (IR-GE) and gradient-and-spin-echo (GRASE)6,7 acquisitions is used, and a subspace reconstruction8-13 is employed to time-resolve the signal evolution. For image encoding, after each excitation, a block of 3D k-t space is encoded using a highly-undersampled spatiotemporal EPTI trajectory with complementary sampling5. Here, continuous bipolar readout is employed to sample data with minimal deadtime between RF pulses, offering high efficiency to track signal evolution and resolve multi-contrast images. Different k-t blocks are acquired from different TRs to form a radial-blade in ky-kz space to create incoherence with further acceleration. In this work, the acquisition parameters of IR-GE and GRASE were designed and optimized based on EPG simulation considering tissue differentiability and SNR, to enable efficient whole-brain protocols at 1-mm and 0.7-mm isotropic resolutions with acquisition times of 3- and 9-minutes.Repeatability experiments: 5 healthy volunteers were scanned using 1-mm 3D EPTI protocols, and 4 healthy volunteers were scanned using the 0.7-mm protocol. For each subject, a scan-rescan experiment was performed where the subject was taken out of the scanner and repositioned between the two scans. The key imaging parameters were: i) 1-mm protocol: FOV=220×176×210mm3, matrix size=230×184×210, TE-increment (echo-spacing)=0.93ms, TR of IR-GE=2600ms, TR of GRASE=800ms, total acquisition time=3minutes; ii) 0.7-mm protocol: FOV=224×176.4×224mm3, matrix size=328×246×322, TE-increment=1.2ms, same TRs were used, total acquisition time=9minutes.
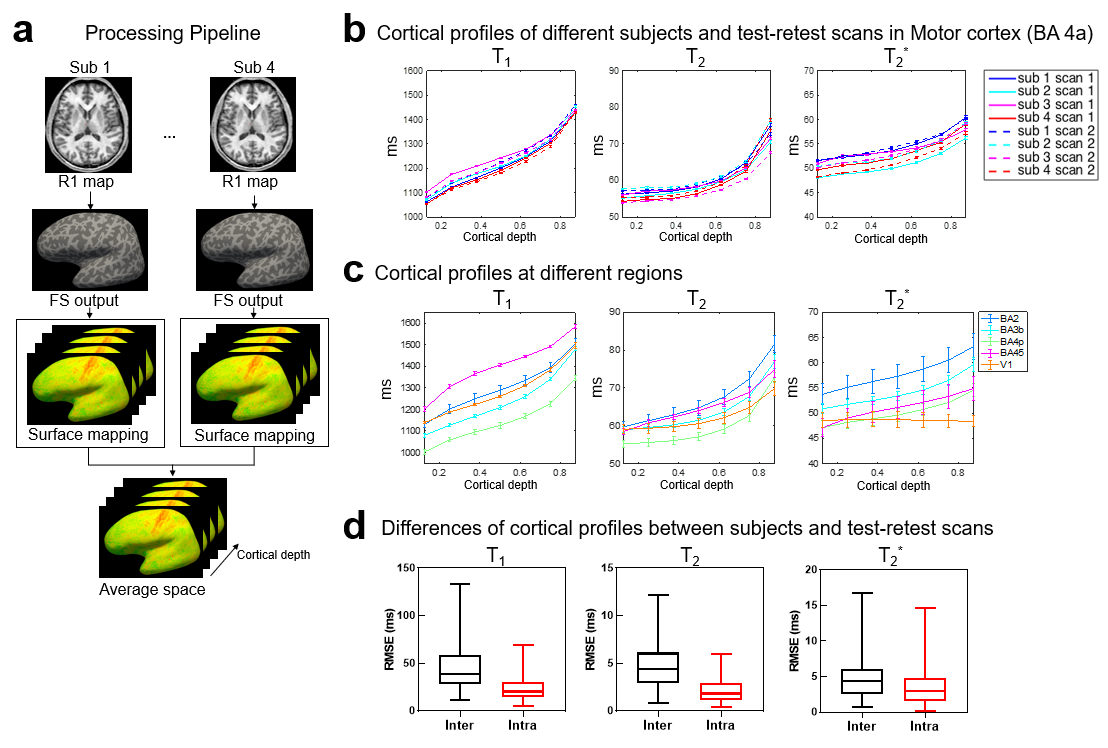
After subspace reconstruction, quantitative maps were obtained by dictionary matching. For the 1-mm datasets, ROI analysis was performed using automatic segmentation results from FreeSurfer14-16, which includes a total of 165 ROIs in cortical, subcortical, white matter, and cerebellum regions. For the 0.7-mm datasets, cortical depth analysis was performed using FreeSurfer14,17,18. For each subject, 9 equi-volume19-20 cortical layers were reconstructed directly using their R1 maps, and were then applied to T1, T2, and T2* maps. These maps were sampled onto the average subject space for the final analysis (Fig.4 left). Inter and intra subject repeatability were assessed by RMSEs between the profiles.
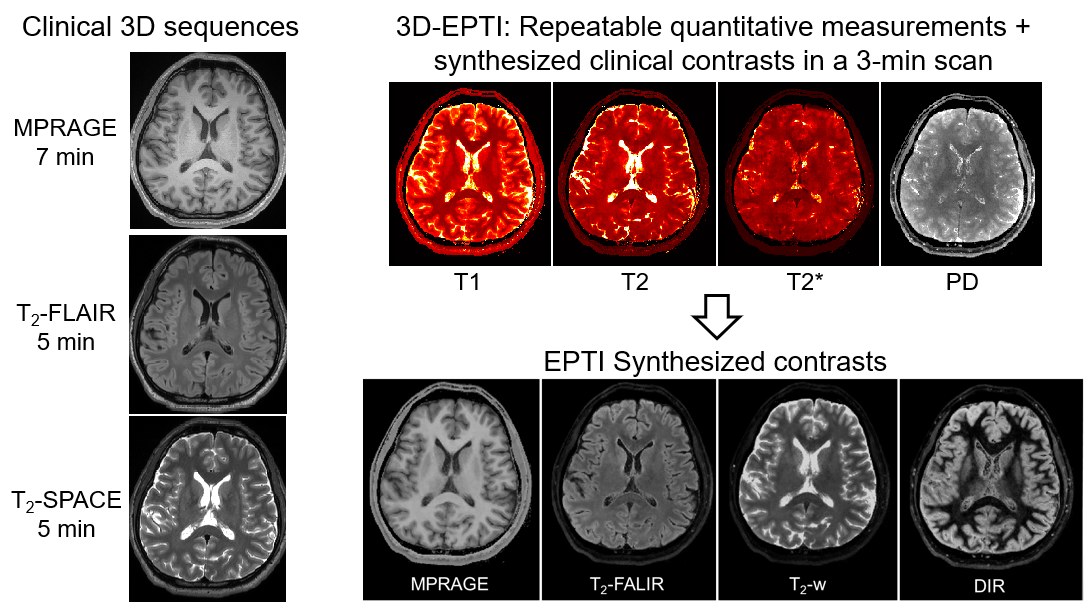
Image synthesis: Multiple contrast-weighed images were synthesized using the 3-min 1-mm data using signal equations. Clinical contrasts were also acquired for comparison using standard 3D sequences with a total scan time of 17-minutes (MPRAGE: 7-min 0.7-mm, T2-FLAIR: 5-min 1-mm, T2-SPACE: 5-min 1-mm).
Results
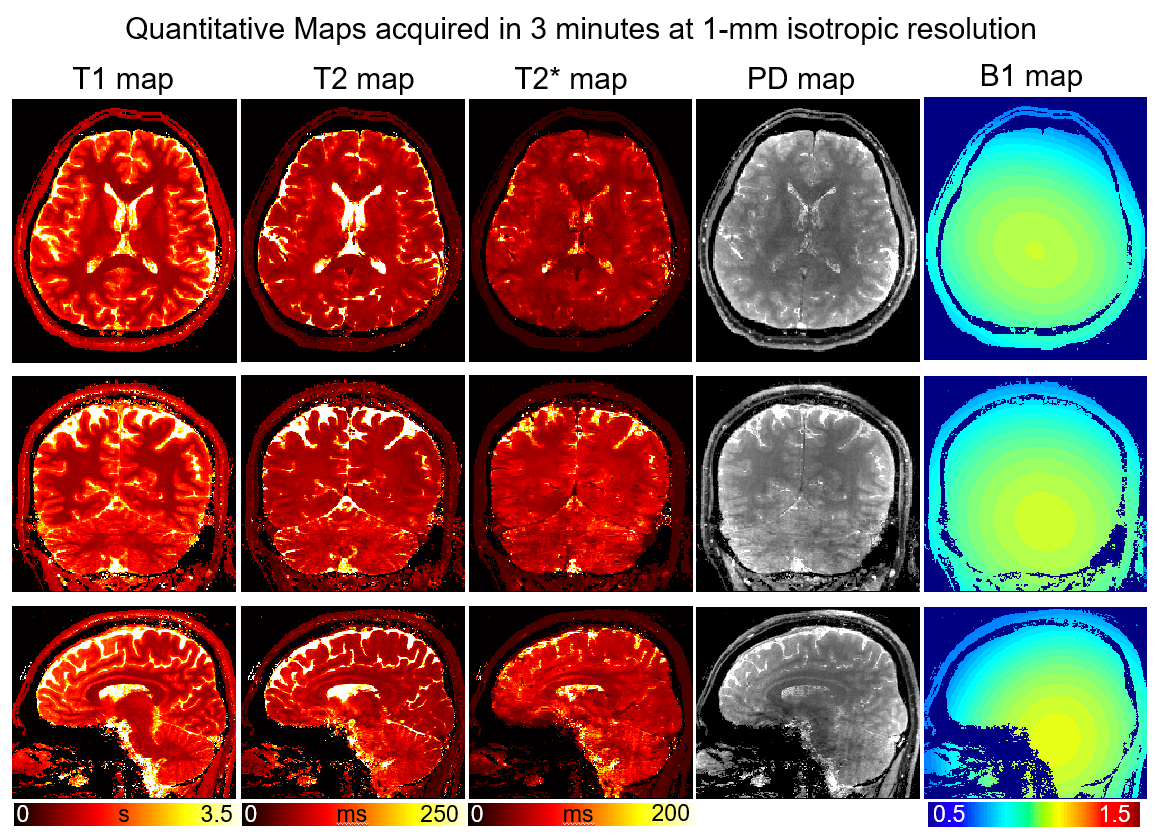
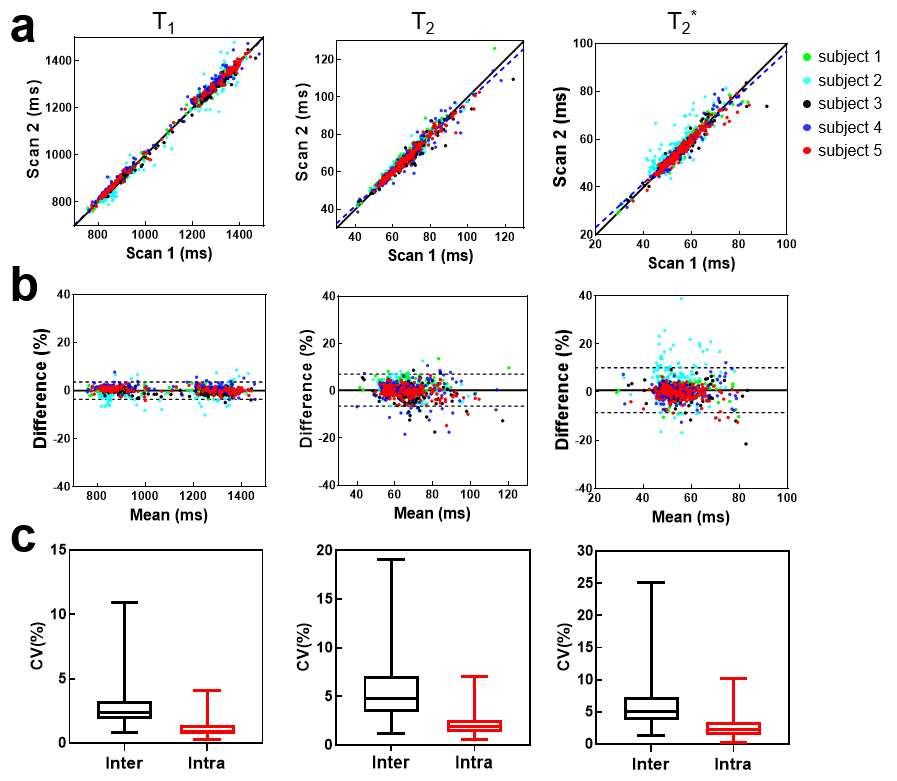
Figure2 presents an example of the high-quality quantitative maps acquired in 3-minutes at 1-mm isotropic resolution. The results of the repeatability test of the 1-mm protocol are shown in Fig.3. The T1-T2-T2* values in the 165 ROIs obtained from the first and the second scans are plotted (Fig.3a) as a function of each other, along with their differences illustrated in Bland-Altman plots (Fig.3b). High correlations and small bias were measured between the two scans for all three parameters as shown. The inter- and intra-subject coefficients of variation are shown in Fig.3c with relatively low values, indicating the small variability of the protocol. Largest variabilities are observed in T2*, likely in part from T2* changes across scans due to different head-positionings21.The cortical profiles of different subjects in two scans of an example ROI are shown in Fig.4b with high repeatability. Fig.4c shows the subject-averaged profiles of 5 selected ROIs, where their differences could be related to the different level of myelination and tissue composition. The RMSEs of inter- and intra-subject profiles are shown in Fig.4d, where lower RMSEs are observed in intra-subject scans as expected.
Figure5 shows the synthesized images using 1-mm EPTI protocol compared with the standard clinical sequences. High-quality synthetic images are provided by EPTI comparable with the standard images but with a much shorter scan time.
Conclusion
This work develops optimized 3D-EPTI whole-brain protocols at 1-mm and 0.7-mm isotropic resolutions, where the quantitative maps from these fast protocols were shown to be repeatable across brain regions as well as cortical depths. Moreover, synthetic weighted-images generated were demonstrated to be in high agreement with contrast-weighted images from clinical protocols.Acknowledgements
This work was supported by the NIH NIBIB (R01-EB020613, R01-EB019437, R01-MH116173, R01EB016695, P41EB030006, and U01-EB025162) and the instrumentation Grants (S10-RR023401, S10-RR023043, and S10-RR019307).References
1. Ma D, Gulani V, Seiberlich N, Liu K, Sunshine JL, Duerk JL, Griswold MA. Magnetic resonance fingerprinting. Nature 2013;495(7440):187-192.
2. Christodoulou AG, Shaw JL, Nguyen C, Yang Q, Xie Y, Wang N, Li D. Magnetic resonance multitasking for motion-resolved quantitative cardiovascular imaging. Nat Biomed Eng 2018;2(4):215-226.
3. Wang F, Dong Z, Reese TG, Wald LL, Setsompop K. 3D-EPTI for Ultra-fast Multi-contrast and Quantitative Imaging. ISMRM 2019; Montreal. p 944.
4. Wang F, Dong Z, Reese TG, Bilgic B, Katherine Manhard M, Chen J, Polimeni JR, Wald LL, Setsompop K. Echo planar time-resolved imaging (EPTI). Magn Reson Med. 2019;81:3599-3615.
5. Dong Z, Wang F, Reese TG, Bilgic B, Setsompop K. Echo planar time‐resolved imaging with subspace reconstruction and optimized spatiotemporal encoding. Magn Reson Med. 2020.
6. Oshio K, Feinberg DA. GRASE (gradient‐and spin‐echo) imaging: a novel fast MRI technique. Magn Reson Med.1991;20(2):344-349.
7. Feinberg DA, Oshio K. GRASE (gradient-and spin-echo) MR imaging: a new fast clinical imaging technique. Radiology 1991;181(2):597-602.
8. Liang Z-P. Spatiotemporal imaging with partially separable functions. 2007. IEEE. p 988-991.
9. Lam F, Liang ZP. A subspace approach to high‐resolution spectroscopic imaging. Magn Reson Med.2014;71(4):1349-1357.
10. Lam F, Ma C, Clifford B, Johnson CL, Liang ZP. High‐resolution 1H‐MRSI of the brain using SPICE: data acquisition and image reconstruction. Magn Reson Med. 2016;76(4):1059-1070.
11. Tamir JI, Uecker M, Chen W, Lai P, Alley MT, Vasanawala SS, Lustig M. T2 shuffling: Sharp, multicontrast, volumetric fast spin‐echo imaging. Magn Reson Med. 2017;77(1):180-195.
12. Meng Z, Guo R, Li Y, Guan Y, Wang T, Zhao Y, Sutton B, Li Y, Liang ZP. Accelerating T2 mapping of the brain by integrating deep learning priors with low‐rank and sparse modeling. Magn Reson Med. 2020.
13. Guo R, Zhao Y, Li Y, Wang T, Li Y, Sutton B, Liang ZP. Simultaneous QSM and metabolic imaging of the brain using SPICE: Further improvements in data acquisition and processing. Magn Reson Med. 2020;85(2):970-977.
14. Fischl B. FreeSurfer. Neuroimage 2012;62(2):774-781.
15. Desikan RS, Ségonne F, Fischl B, Quinn BT, Dickerson BC, Blacker D, Buckner RL, Dale AM, Maguire RP, Hyman BT. An automated labeling system for subdividing the human cerebral cortex on MRI scans into gyral based regions of interest. Neuroimage 2006;31(3):968-980.
16. Fischl B, Salat DH, Busa E, Albert M, Dieterich M, Haselgrove C, Van Der Kouwe A, Killiany R, Kennedy D, Klaveness S. Whole brain segmentation: automated labeling of neuroanatomical structures in the human brain. Neuron 2002;33(3):341-355.
17. Dale AM, Fischl B, Sereno MI. Cortical surface-based analysis: I. Segmentation and surface reconstruction. Neuroimage 1999;9(2):179-194.
18. Marques JP, Khabipova D, Gruetter R. Studying cyto and myeloarchitecture of the human cortex at ultra-high field with quantitative imaging: R1, R2* and magnetic susceptibility. Neuroimage 2017;147:152-163.
19. Waehnert M, Dinse J, Weiss M, Streicher MN, Waehnert P, Geyer S, Turner R, Bazin P-L. Anatomically motivated modeling of cortical laminae. Neuroimage 2014;93:210-220.
20. Waehnert MD, Dinse J, Schäfer A, Geyer S, Bazin P-L, Turner R, Tardif CL. A subject-specific framework for in vivo myeloarchitectonic analysis using high resolution quantitative MRI. Neuroimage 2016;125:94-107.
21. Cohen-Adad J, Polimeni JR, Helmer KG, Benner T, McNab JA, Wald LL, Rosen BR, Mainero C. T2* mapping and B0 orientation-dependence at 7 T reveal cyto- and myeloarchitecture organization of the human cortex. NeuroImage 2012;60(2):1006-1014.
Figures