0551
STARE (Steady-state T2 And Rf Estimation) - A fast 3D-GRE acquisition for phase-based mapping of T2 and B1
Rita Schmidt1,2, Amir Seginer3, and Yael Kierson1,2
1Neurobiology, Weizmann Institute of Science, Rehovot, Israel, 2The Azrieli National Institute for Human Brain Imaging and Research, Weizmann Institute of Science, Rehovot, Israel, 3Siemens Healthcare Ltd, Rosh Ha’ayin, Israel
1Neurobiology, Weizmann Institute of Science, Rehovot, Israel, 2The Azrieli National Institute for Human Brain Imaging and Research, Weizmann Institute of Science, Rehovot, Israel, 3Siemens Healthcare Ltd, Rosh Ha’ayin, Israel
Synopsis
There is a bulk of studies exploring spin-echo and multi-echo methods generating T2 weighted imaging and T2 mapping. However, the challenges at 7T MRI include high SAR, long scans and RF inhomogeneity. Steady-state GRE also provide T2 maps based on the magnitude images. A recent study at 3T demonstrated phase-based 3D-GRE with specific RF phase increments producing T2 maps. We propose acquiring four scans from which we can estimate both the T2 and the B1 maps. We denote this method as Steady-state T2 And Rf Estimation (STARE). STARE offers a new capability to acquire fast 3D dataset for T2 mapping.
Introduction
T2 relaxation time is one of the main tissue properties in use today in MRI diagnostics. It is of special interest in multiple sclerosis and other demyelinating diseases, and of further appeal by the improved sensitivity at ultra-high field MRI (≥7T). There is a bulk of studies exploring spin-echo and multi-echo based methods to generate T2 weighted imaging and T2 mapping1,2. However, the challenges at 7T MRI include an increase in SAR – resulting in long scans – as well as RF (B1) inhomogeneity that complicates the interpretation of T2 weighted images. Steady-state short TR methods based on GRE are also well studied and are used to provide T2 maps, however, they are more used for combined T1 and T2 quantifications3,4,5. A recent study at 3T demonstrated that phase images from two 3D-GRE scans with specific RF pulse phase increments can be used to produce T2 maps6. The phase of this signal, however, also depends on the flip angle. In this study, we propose to acquire four scans (with two flip angles), from which we can estimate both the T2 and the B1 maps. We denote this method as Steady-state T2 And Rf Estimation (STARE).Methods
The method is based on the well known RF spoiling used with spoiled GRE (SGRE), which can be acquired with short TR (in this work TR of 10 msec was used). However, instead of the standard phase increments (φinc) of 117 as used in RF spoiling, small phase increments (for example, φinc) provide notable T2 contrast in the phase images. Detailed Bloch simulations have shown that the phase of the acquired signal (θsig ) includes a global phase, dependent on B0 and B1 contributions, as well as a phase mainly dependent on T2 and flip angle (α): θsig = θ(T2, α) + θ0 . (A small T1 dependency also exists, however, it is negligible in the relevant range). If two scans are acquired with φinc=2 and φinc=-2, they provide the same θ0 , while θ(T2, α)φinc=2=- θ(T2, α)φinc =-2. If we acquire four scans, two pairs of φinc=2 and φinc=-2 with two flip angles (for example, α and 2α), we can eliminate θ0 from the pairs φinc=2 and φinc=-2 and using Bloch simulations estimate the T2 and B1 distribution – based on a dictionary (by closest distance). Figure 1 shows Bloch simulation of the θ(T2, α) at φinc=2. One can also acquire just three scans – 1) α , φinc=2; 2) α, φinc=-2; and 3) 2α, φinc=2 . Then, from 1)+2) calculate θ0 and use data from 3) to estimate T2 and B1 maps, thus further accelerating the acquisition. In this feasibility study, we used four scans. 7T imaging was performed on a 7T MAGNETOM Terra (Siemens Healthcare, Erlangen, Germany) and one phantom dataset was acquired on a 3T MAGNETOM Prisma (Siemens Healthcare, Erlangen, Germany). Three tubes with different agar concentrations (1.5%, 2 .5% and 3.5%) were used to compare the T2 estimation to the gold standard, spin echo for a set of TE values. A cylindrical phantom with 2% uniform agarose concentration and 0.5% NaCl was examined in both 7T and 3T to inspect the T2 and B1 distribution. Finally, human scanning with 1.5 in-plane resolution was acquired and T2 weighted images and T2 maps were generated. In-vivo 3D-GRE scan parameters were Sagittal plane, FOV 216x220x128 mm3, resolution 1.5x1.5x2 mm3, TR/TE 10/4.3 ms, α=15° and 26°, scan duration 1:30 min, four scans 6 minutes.Results
Fig. 2 shows results of T2 quantification on the three examined tubes with STARE. The scans included α=15° and α=29°, φinc=2 and φinc=-2. The figure shows the raw data magnitude images, θ distribution (after θ0 removal), estimated T2 map, and a comparison to the spin-echo scan, showing a very good fit. Fig. 3 shows quantitative results for the central slice of the cylindrical phantom, comparing 3T and 7T acquisition. A uniform T2 was reconstructed in both cases, with a pronounced B1 distribution at 7T, as expected. Fig. 4 shows human volunteer results – where one can see low contrast magnitude images, but clear T2 weighting in both the estimated θ and in the imaginary signal . The low B1 values in the cerebellum, as expected, lead to lower θ values compared to other regions with the same T2. Nevertheless, solving for B1, in addition to T2, allows for an overall reliable T2 estimate.. Fig. 5 shows a set of T2 weighted images based on the T2 maps found in Fig.4 for TE=30 ms.Conclusions
STARE offers a new capability to acquire fast 3D dataset for T2 mapping, based on a simple 3D-GRE acquisition. This method is based on the phase images and has the advantage of fast acquisitions of a whole brain and the ability to separate T2 and RF contributions. In this feasibility study, acceleration of the acquisition was not utilized, however, both multi-channel acceleration methods (SENSE/GRAPPA) and Compressed Sensing methods can be easily incorporated in this sequence. Further study is required to analyze its sensitivities and accuracy and optimize φinc and α. Note, the method is currently more limited at high T2 values and very low flip angles.Acknowledgements
No acknowledgement found.References
References [1] Juras V et.al. Eur Radio. 2016;26, [2] Brittain JH et.al. MRM 1995; [3] Deoni SCL, MRM 2003; 49; [4] Welsch GH et.al. MRM 2009;62; [5] Leroi L. et.al. MRM 2020; [6] Wang X. et.al. MRM 2019; [7] Pruessmann KP. Et.al. MRM 1999 42, [8] Griswold MA et.al MRM 2002 47, [9] Lustig M et.al MRM 2007 58;Figures
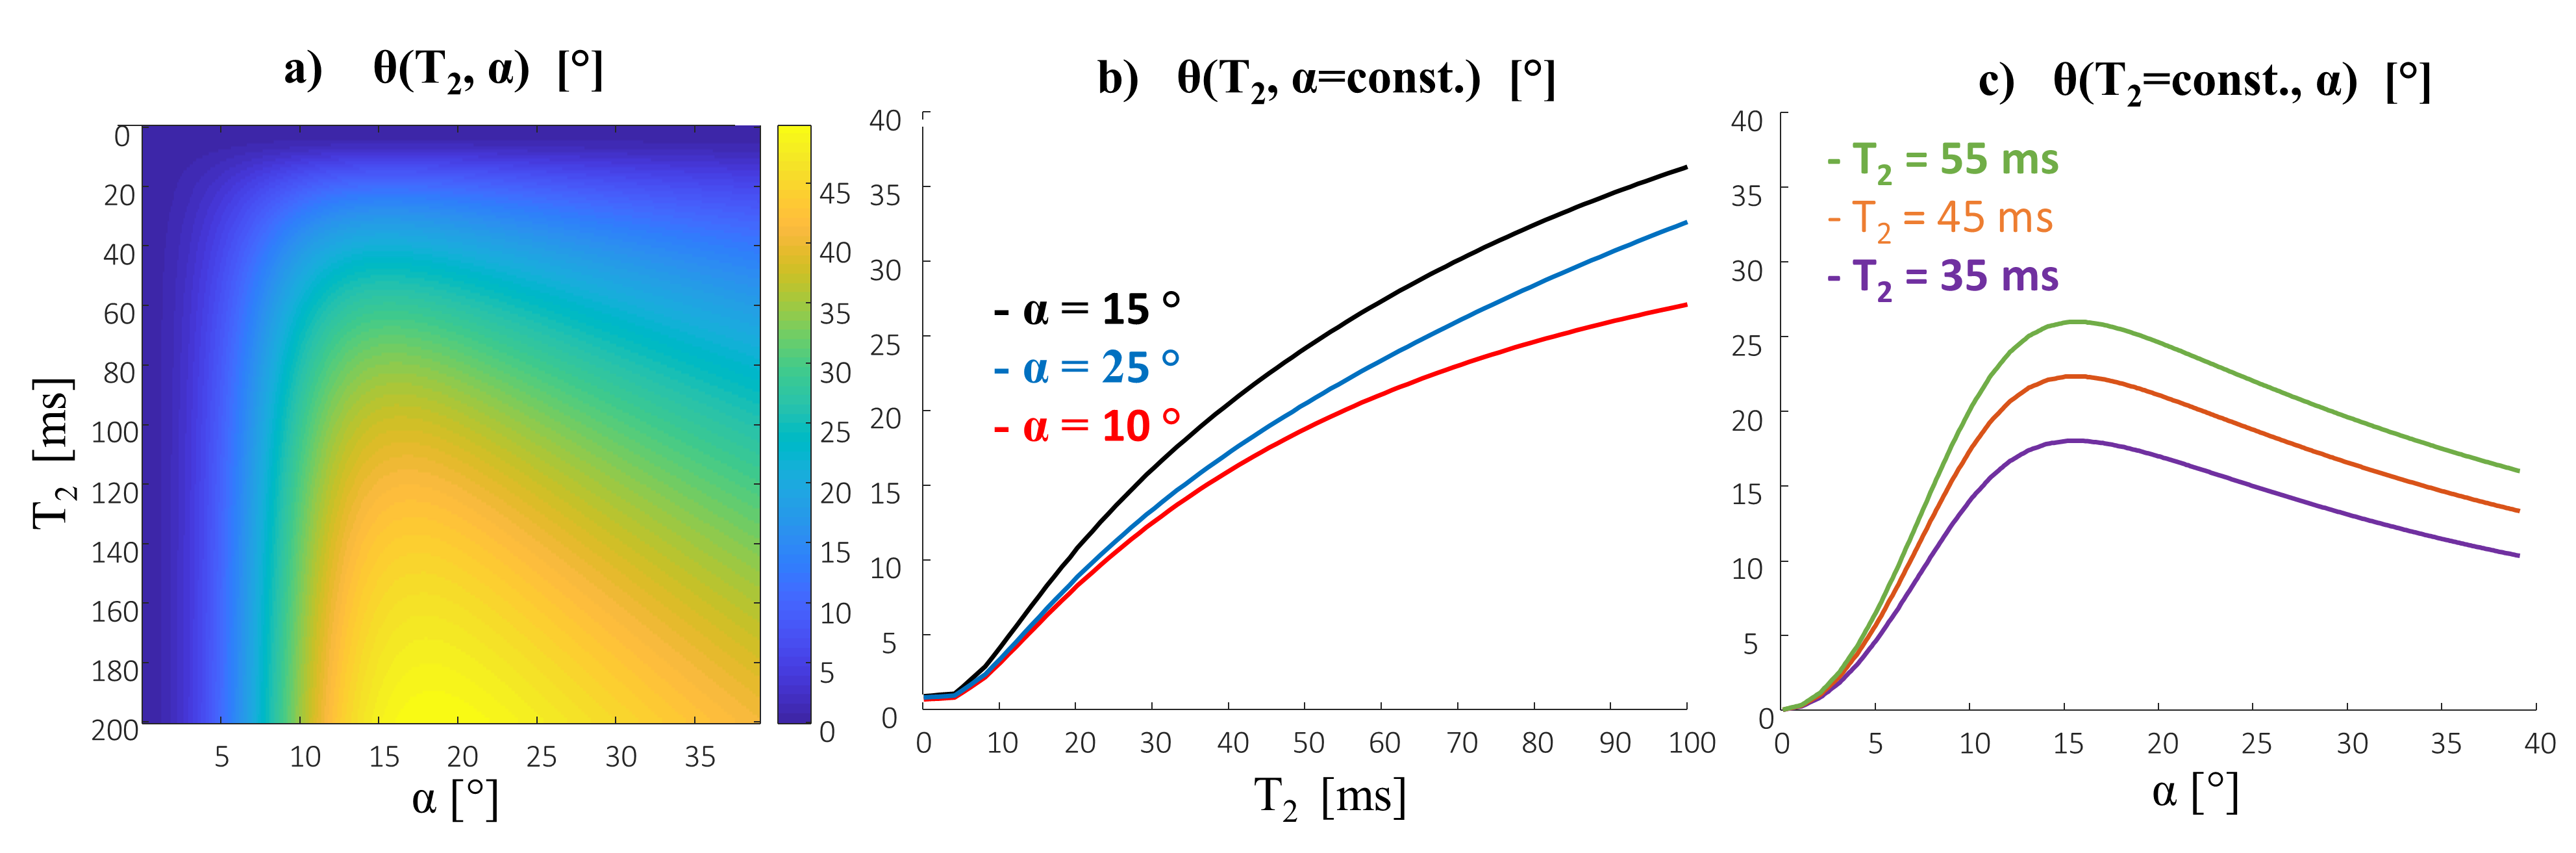
Figure 1: Bloch simulation of θ(T2, α) for φinc=2. a) 2D θ(T2, α)
map b) plots at constant flip angle α - θ(T2, α=const.) , for α =10°,15° and 25° and c) plots at
constant T2 - θ(T2=const., α), for T2=35,45 and 55 ms.
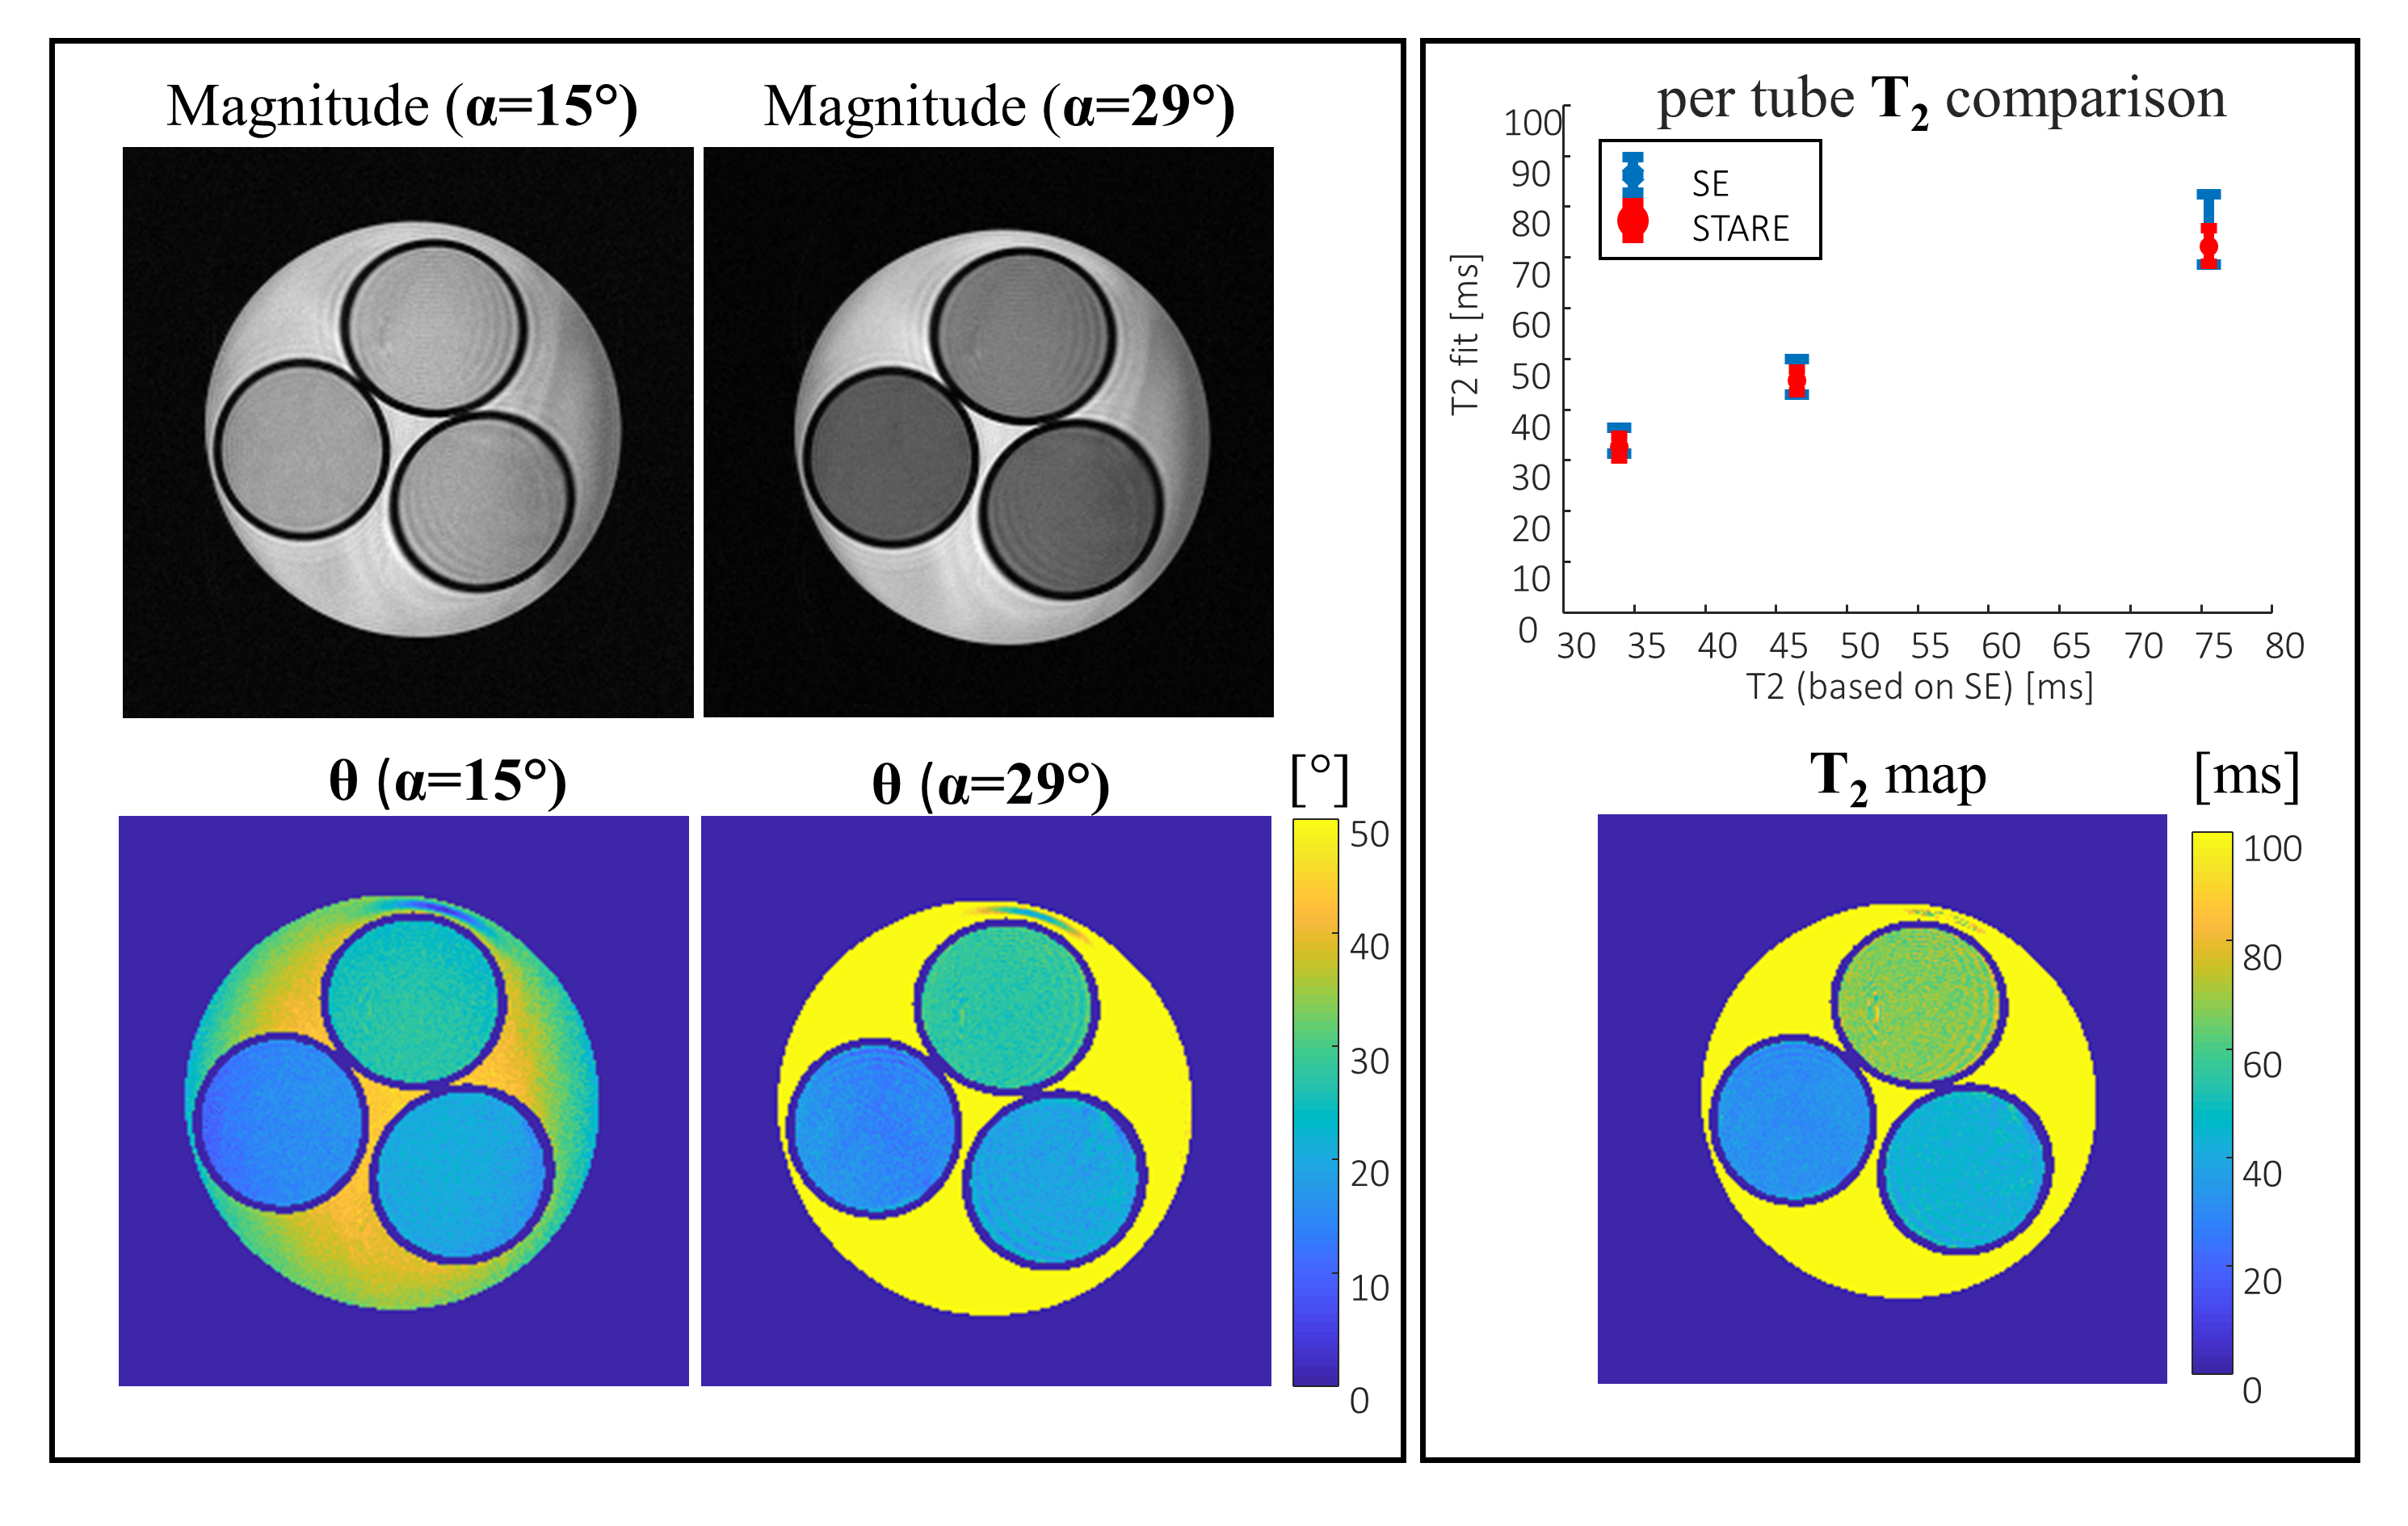
Figure 2: T2
mapping of three tubes (1.5%,2.5% and
3.5% agar concentration) in water. T2 mapping was estimated here by STARE and
compared to Spin-Echo with three TE values (TE=10, 30, and 50 ms). The STARE
scan parameters were FOV 200x100x64 mm3, resolution 0.4x0.4x3 mm3,
TR/TE 10/2 ms, scan duration 1:22 min, totaling 5:30 minutes for four scans .
Spin echo scan parameters: one slice, FOV 220x68 mm2, resolution
0.4x0.4 mm2, slice thickness 3 mm, TR 7000 ms.
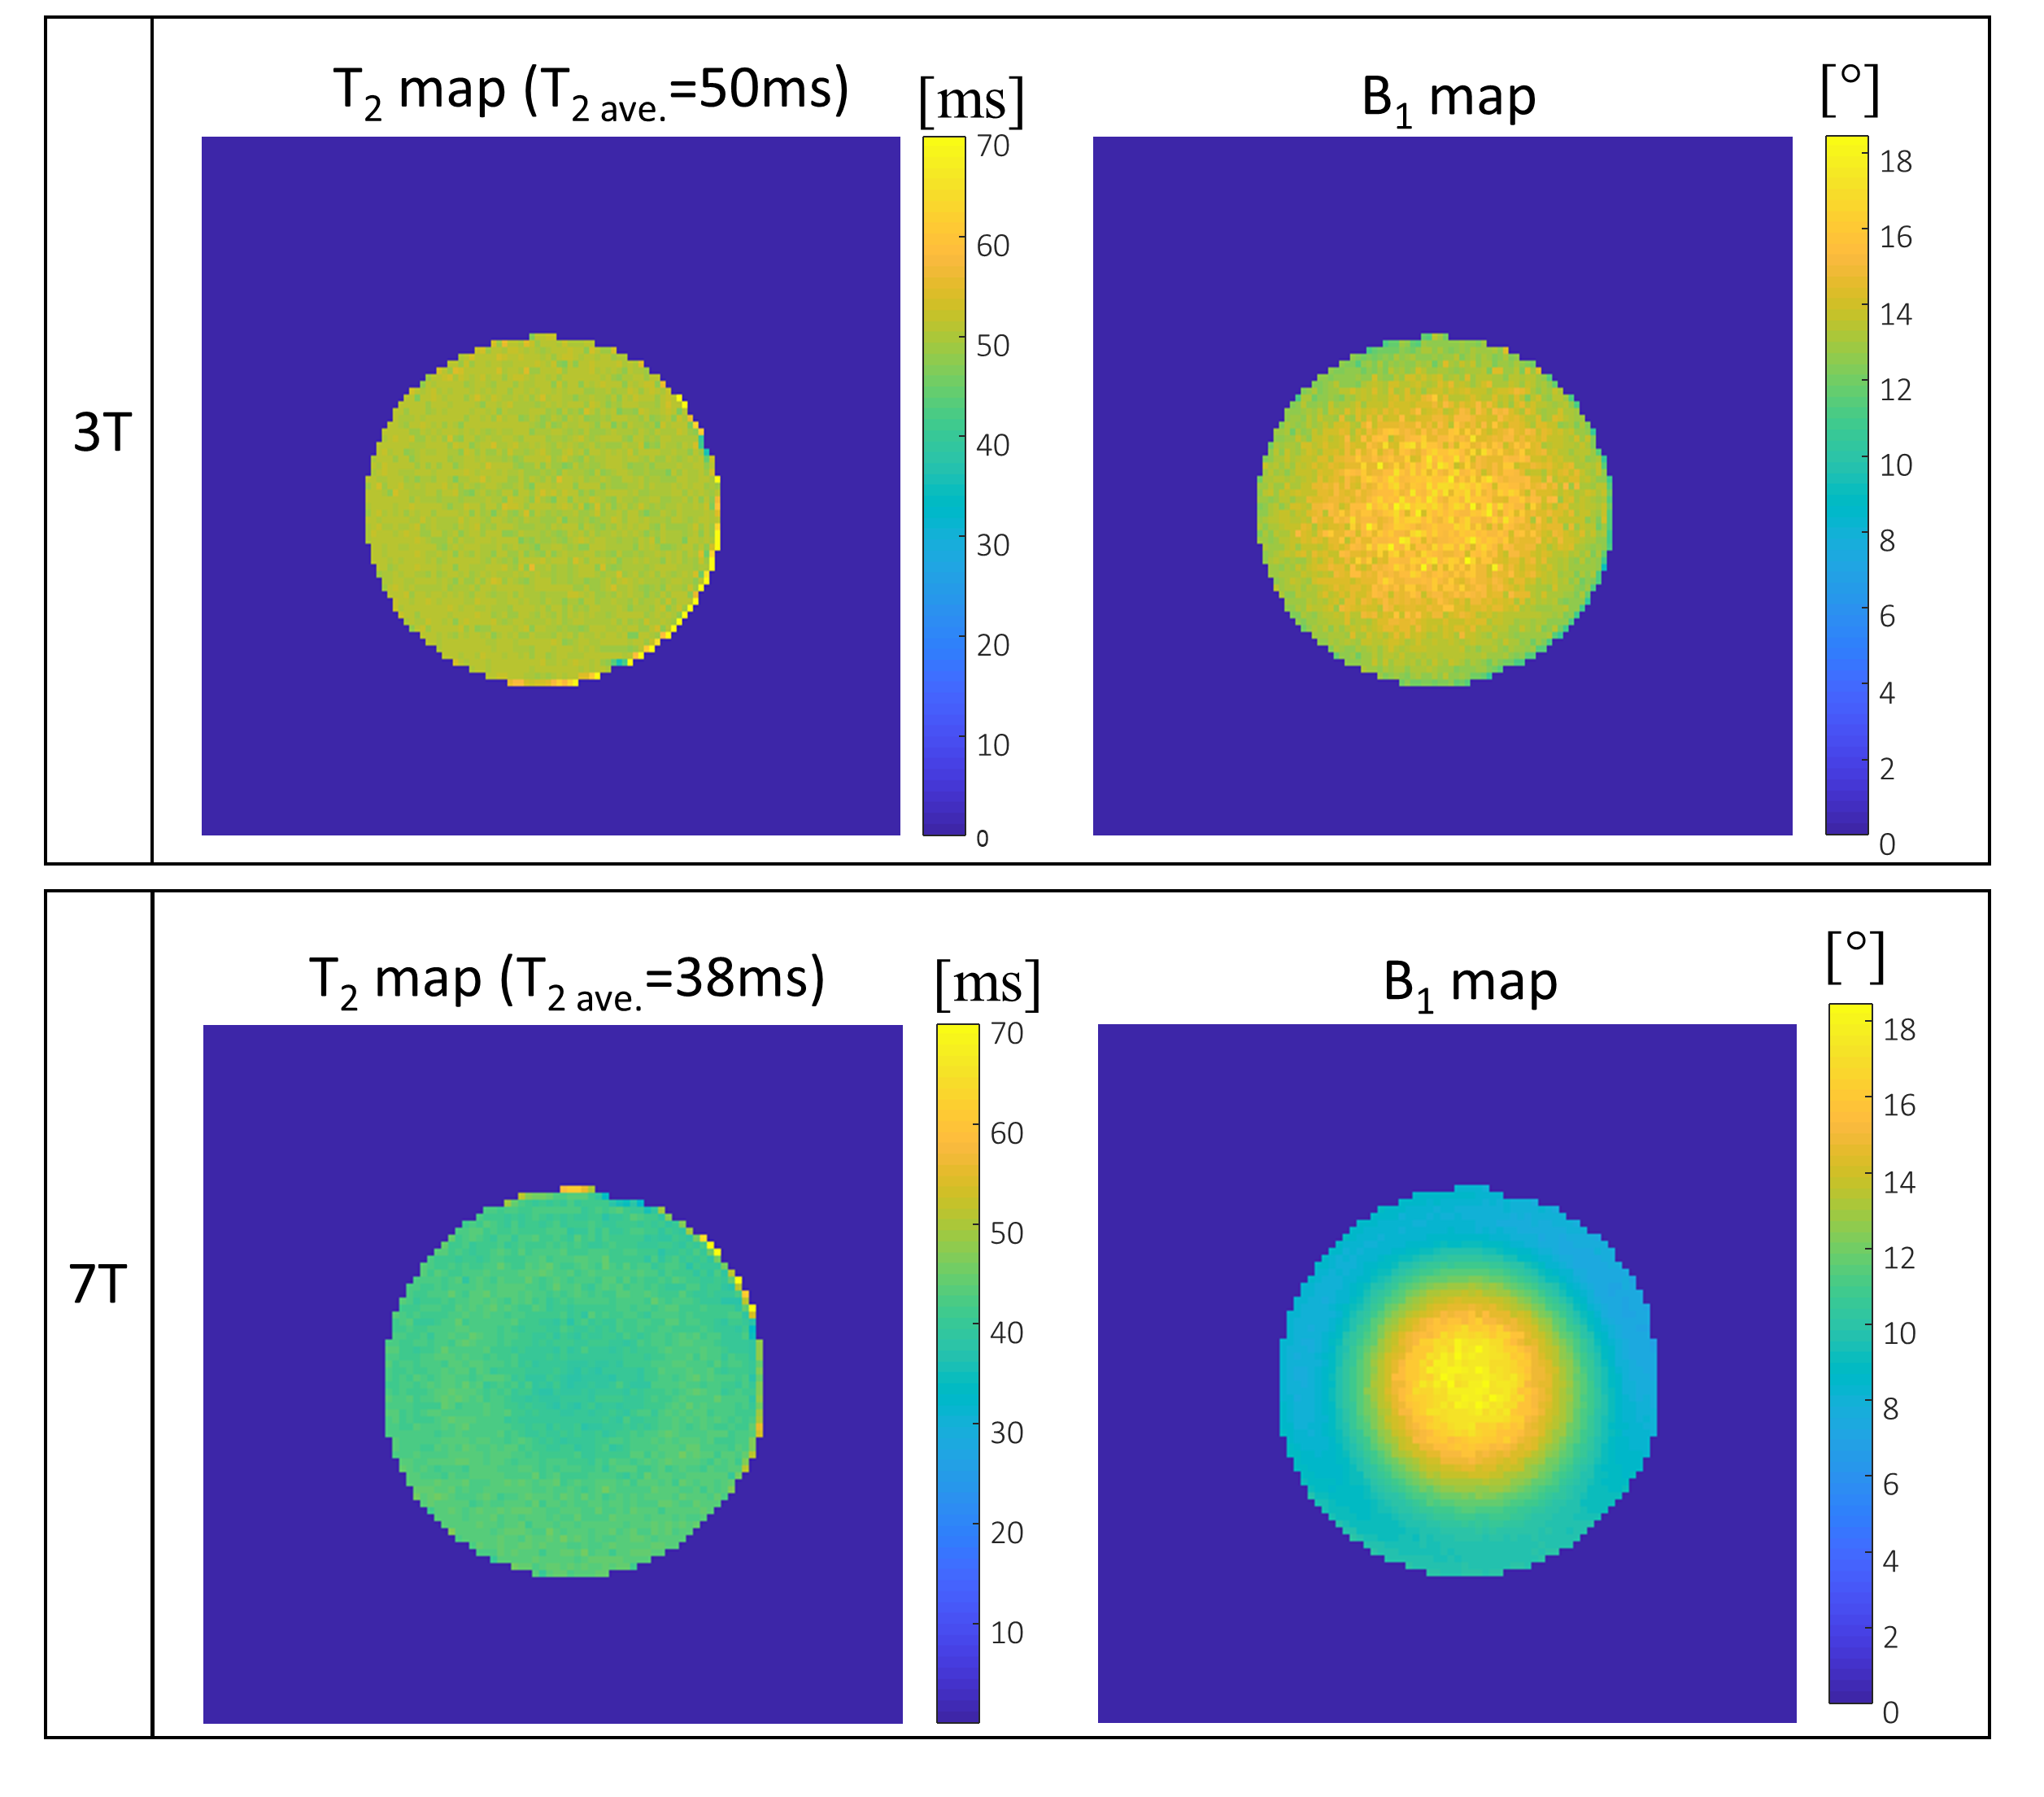
Figure 3: Uniform 2% agar concentration phantom – T2
and B1 maps at 3T and 7T. Scan
parameters were FOV 200x200x64 mm3, resolution 1x1x3 mm3,
TR/TE 10/2 ms.
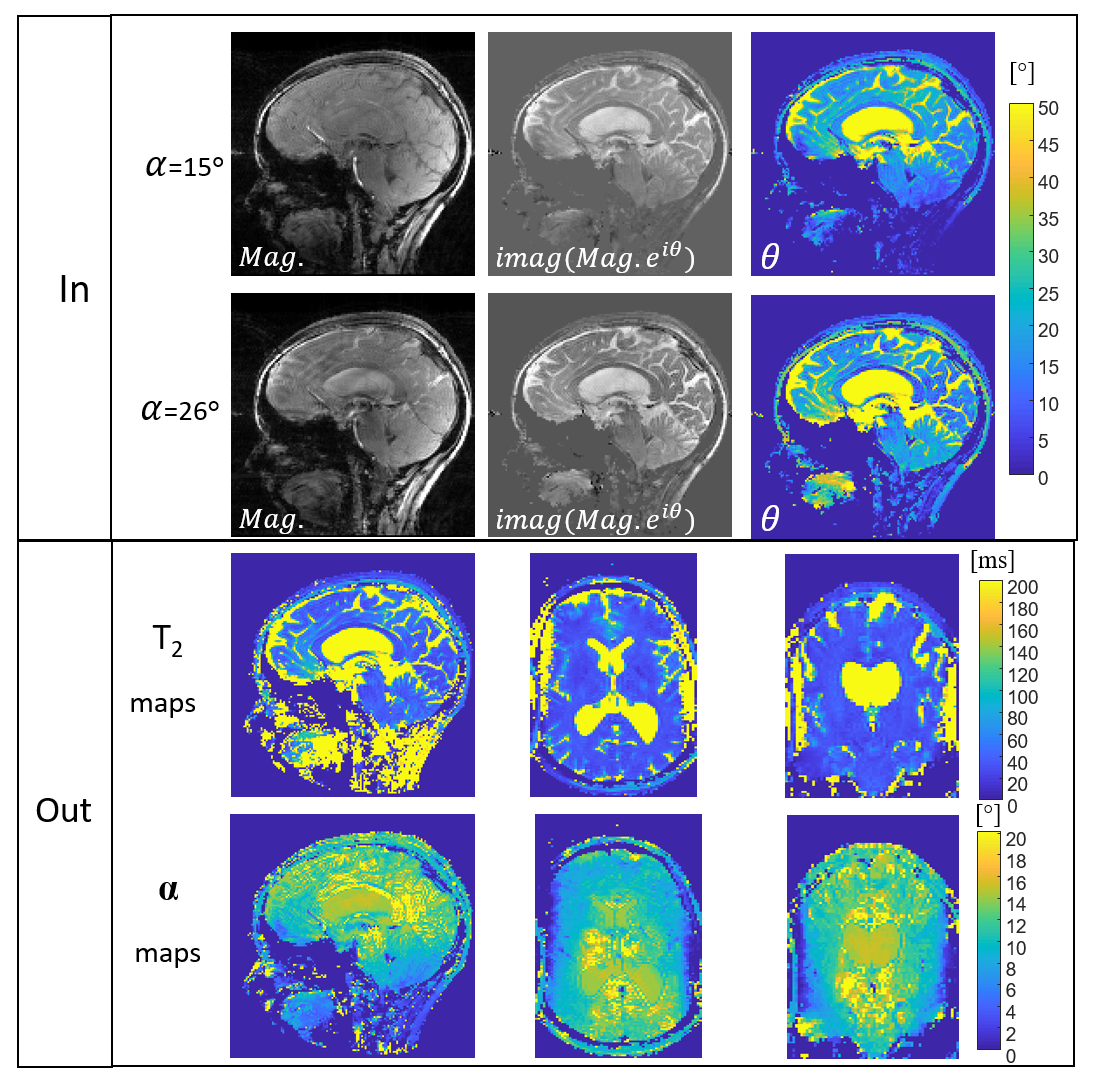
Figure 4: STARE - human volunteer imaging. Upper images
shows the acquired magnitude data, the imaginary part of a signal defined as imag(Mag.·eiθ) and θ maps. The bottom images show the output T2 and B1 maps at the main cross sections (sagittal,
transversal and coronal images).
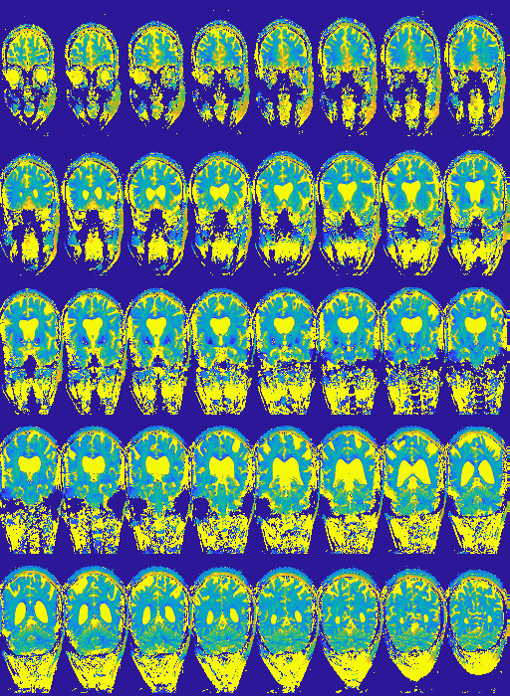
Figure 5: Coronal T2 weighted images for TE=30 ms generated from the
T2 maps of Figure 4 (only a subset of all
the images is shown). Note: the excessively low SNR in the lower part (spinal
cord and so) is currently interpreted as high T2.