0549
Multi-parametric R2’ Measurement of Brain Oxygen Extraction Fraction: Reproducibility and Application in Moyamoya Disease1Department of Biomedical Engineering, University of California, Davis, Davis, CA, United States, 2Department of Radiology, Stanford University, Stanford, CA, United States, 3Department of Medical Imaging, Taipei Medical University-Shuan-Ho Hospital, New Taipei City, Taiwan, 4General Electric Healthcare, San Ramon, CA, United States, 5Department of Neurology, University of California Davis, Davis, CA, United States
Synopsis
We quantified R2’ as a biomarker of brain oxygen extraction fraction (OEF) using a multi-parametric approach, based on multi-echo gradient echo (R2*) and fast spin echo scans (R2). Healthy volunteers received repeat scans after 1-2 weeks and the coefficient of variation of R2’ was low (4.4-8.3% in vascular territories), indicating good R2’ scan-rescan reproducibility. R2’ was also inversely correlated with PET scans of cerebral blood flow in healthy controls, as expected. In 14 Moyamoya patients, elevated R2’ (indicating abnormal, high OEF) was observed both in brain regions with and without artery stenosis, and provided complementary information to cerebral perfusion.
Introduction
Tissue oxygenation measurements provide strong indications of hemodynamic impairment within the brain. These impairments are prevalent in stroke, Alzheimer’s dementia, Moyamoya disease, and other neurological disorders where pathophysiology disrupts normal cerebrovascular flow. Imaging of spin relaxation rate R2’ is sensitive to oxygen extraction fraction (OEF) in brain voxels with clinically achievable scans that measure R2 and R2*.1 However, R2’ biomarker measurements are susceptible to inhomogeneity within the body and vary by person or time of day of the measurement. We set out to characterize the reproducibility of R2’ in 9 healthy volunteers, determine its relationship with [15O]-water PET of cerebral blood flow, and evaluate R2’ as an indicator of OEF in Moyamoya patients.Methods
Nine healthy volunteers (25-41 years, 6 female) were scanned on a simultaneous 3 Tesla PET/MRI (GE Healthcare Signa) with multi-parametric acquisitions. A fast spin echo (FSE) scan was acquired with 8 echoes (28 - 122 ms) for R2 mapping and multi-echo gradient echo with 10 echoes (11.1 - 42.4 ms) for R2* mapping, both at 0.82 x 0.82 x 4.0mm3 resolution. PET perfusion data was acquired using an intravenous bolus injection of [15O]-water (490–960 MBq), 192×192 matrix, 30 cm field-of view, 2.78 mm slice thickness, and included scatter and random corrections. Each healthy volunteer returned for a second, repeat scan after 7-15 days. Fourteen Moyamoya patients (28-61 years, 9 female, 7 bilateral and 7 unilateral) were scanned with the same PET/MRI protocol in a single session.Following acquisition, signals were processed via MATLAB and FSL imaging libraries.2 R2* maps were calculated from a custom nonlinear fitting script corrected for local frequency shifts while R2 maps were generated using the StimFit toolbox to correct for stimulated echo artifacts. For each subject, R2' was directly calculated by the difference between the R2* and R2 maps, where R2' = R2* - R2, and then registered to MNI152 brain template space.3 Linear registration was first performed with the original FSE data to the individual T1-weighted scan, followed by nonlinear registration to the MNI template with FNIRT. Similar registration was also performed for PET CBF scans onto the MNI template. Both registered R2' and CBF maps were segmented into 10 regions of interest (ROI) based on ASPECTS vascular territories.4,5 Average R2’ values and standard deviations were calculated for each ROI in each respective map. Reproducibility of R2’ in sessions was assessed using coefficient of variation (CoV). Correlation between R2’ and PET perfusion was assessed using a mixed effects model that accounted for subject clustering. Vessel occlusion and severity of Moyamoya was diagnosed by an experienced neuroradiologist.
Results
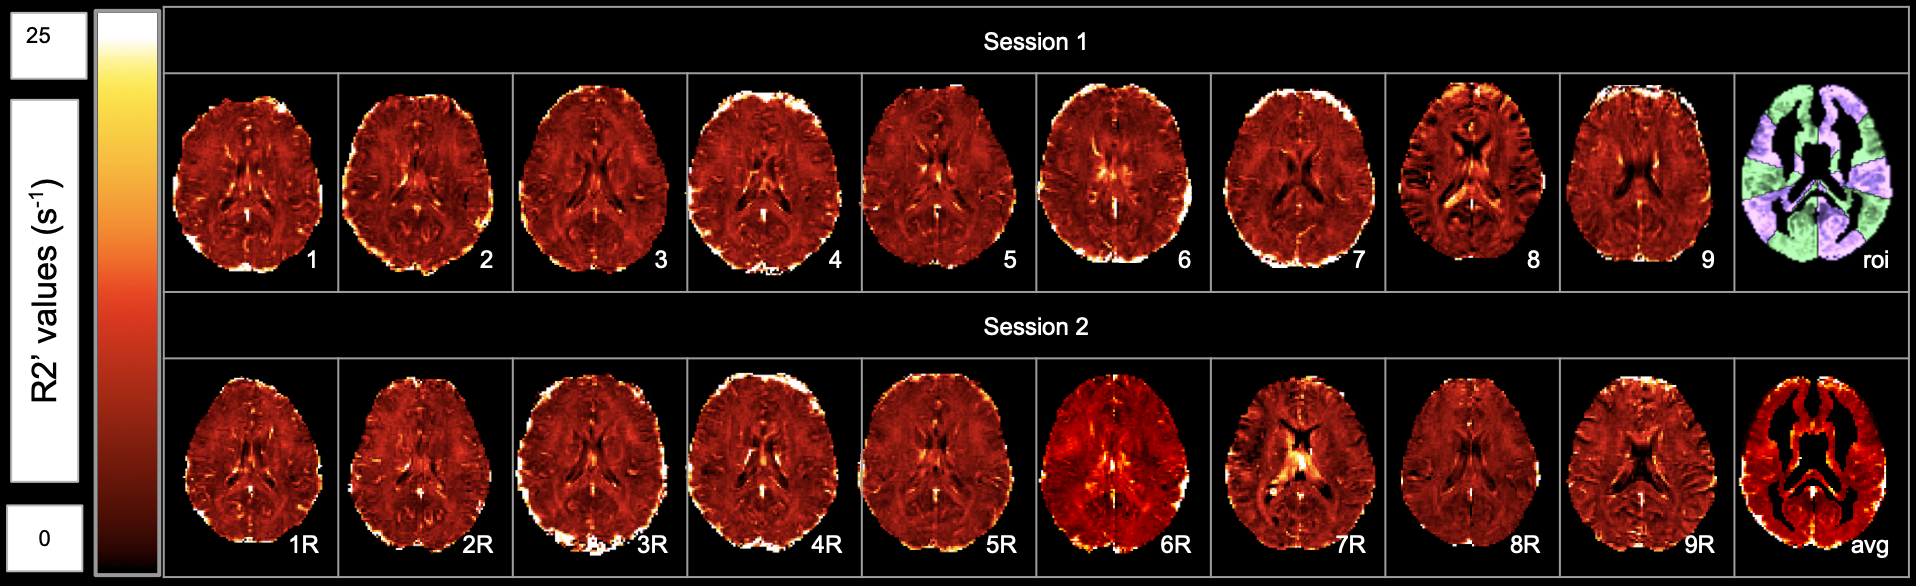
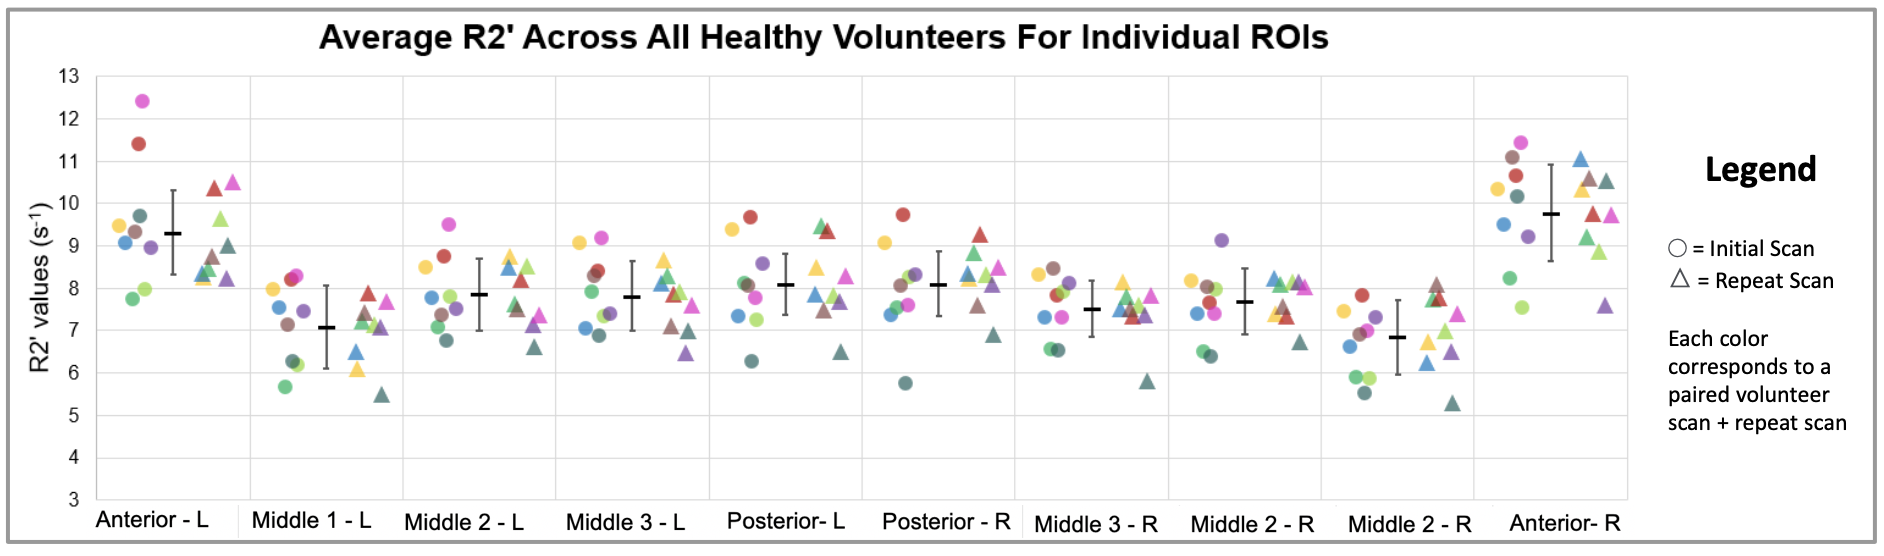
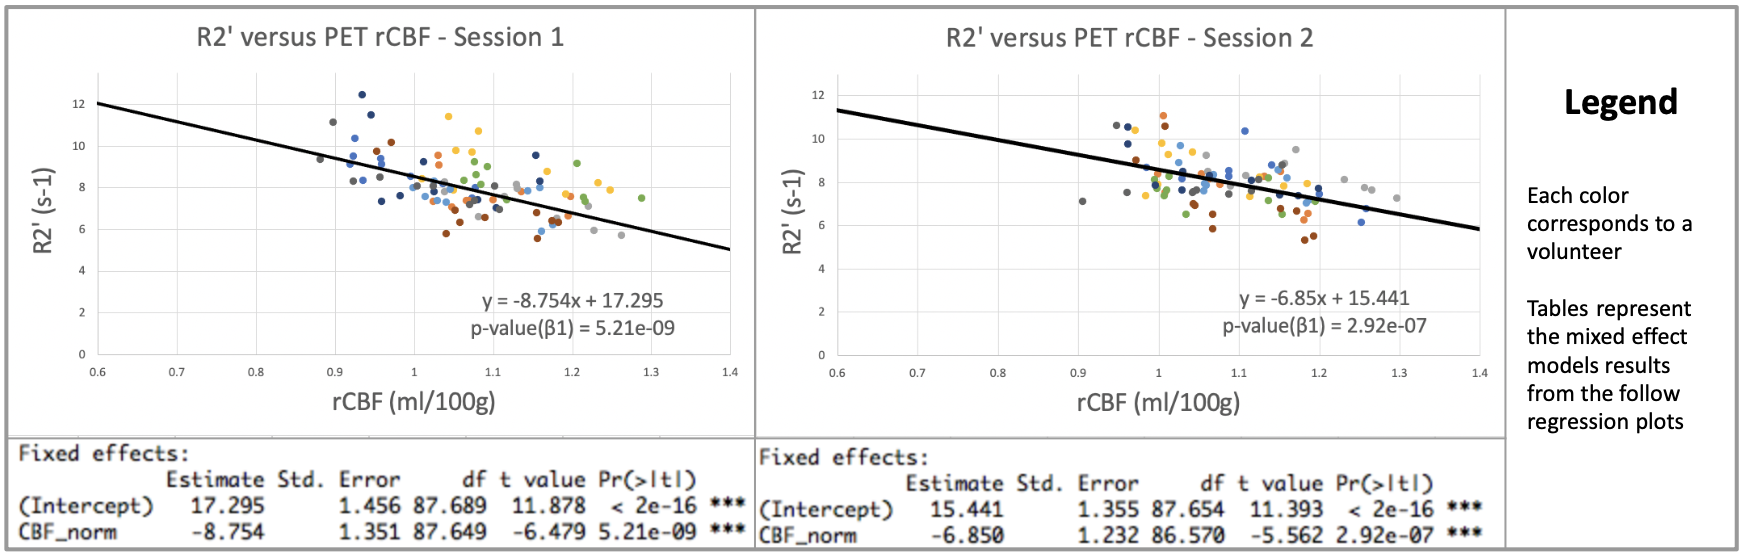
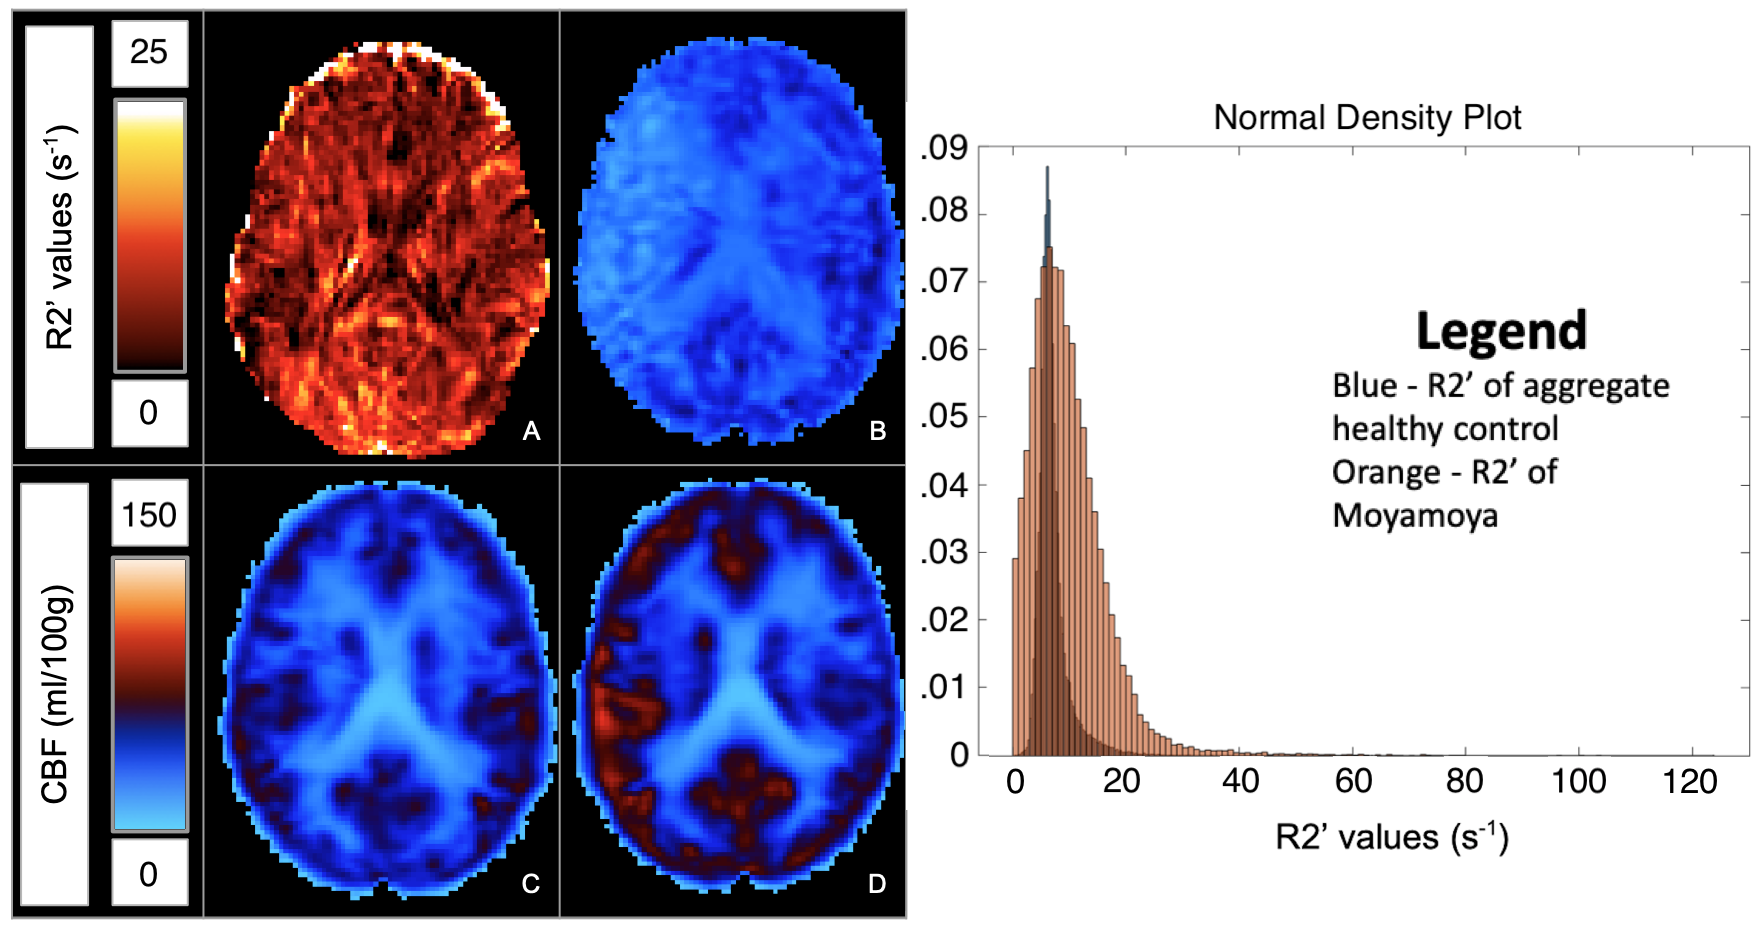
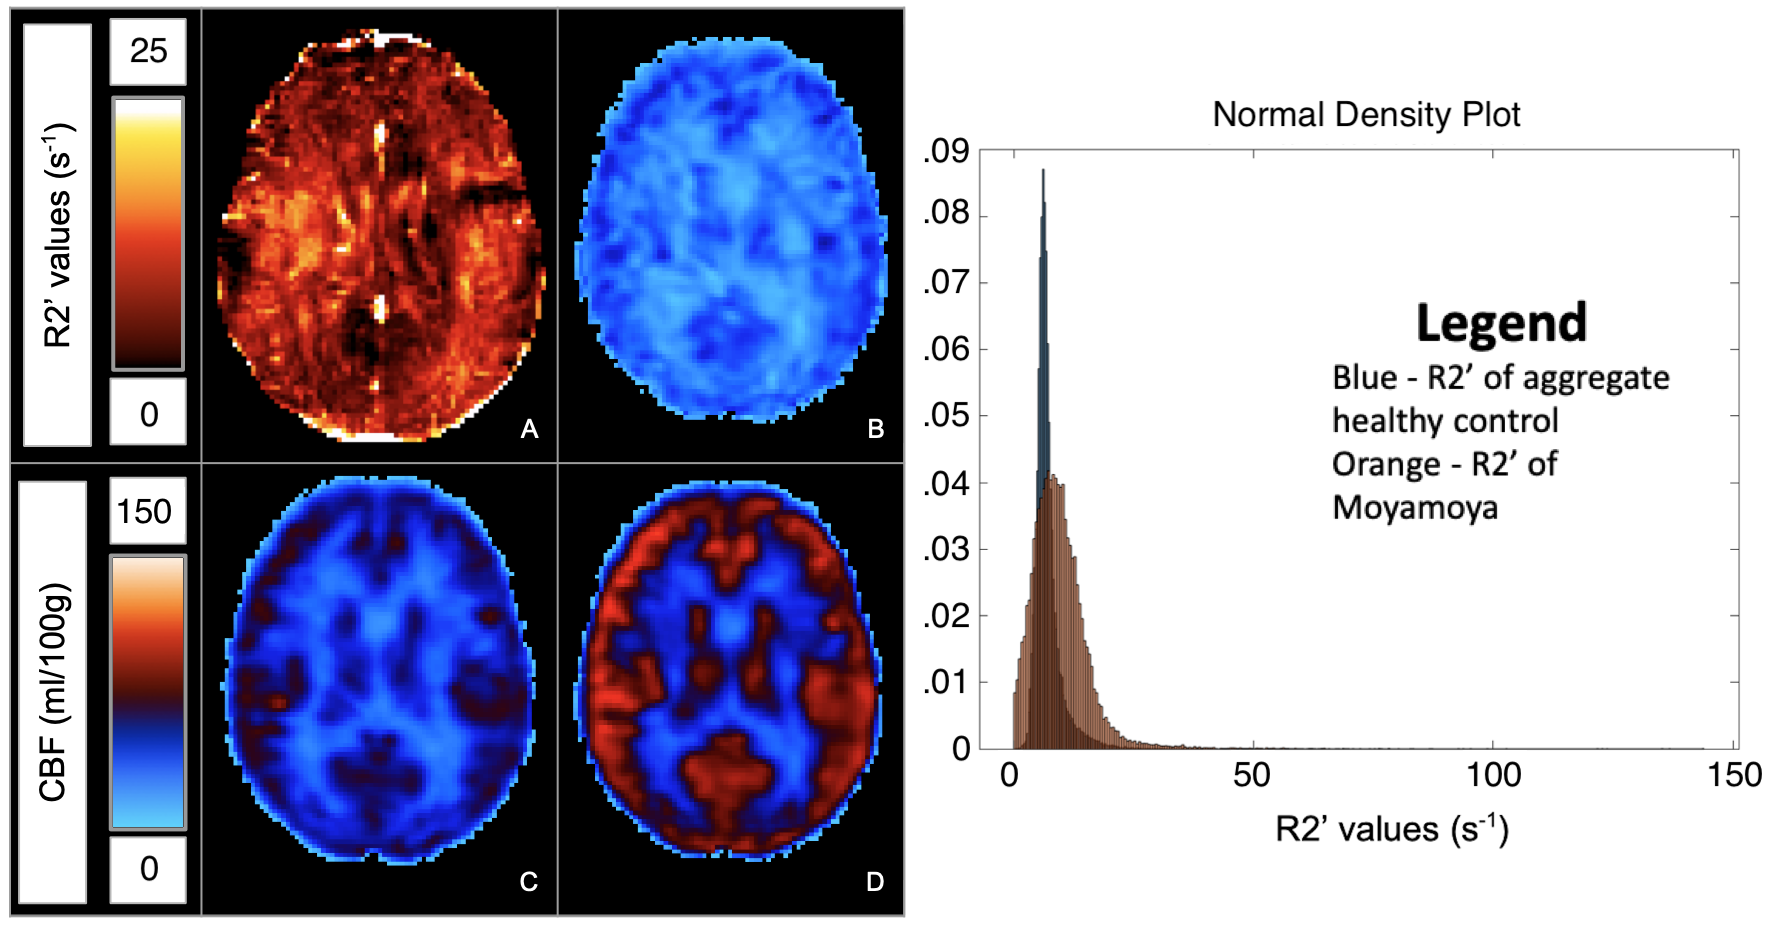
Average CoV values between scans of individual healthy volunteers across all ROIs were between 4.39% to 8.30% (Figure 1). Low CoV values were observed across scans and indicate reasonable reproducibility. Low variability was present in the anterior region despite high R2’ values due to susceptibility artifacts at air-tissue interfaces (Figure 2). R2’ measurements indicating OEF was inversely correlated with baseline rCBF data for both sessions of the healthy volunteers (Figure 3). R2’ averages per region of interest were greater across regions for Moyamoya cases when compared to healthy volunteers (Figures 4 and 5).Discussion
R2’ demonstrates a correlation to PET rCBF for healthy controls and was abnormally elevated in patients exhibiting Moyamoya, indicating high OEF. R2’ and rCBF provided valuable information about tissue physiology; some Moyamoya patients with unilateral stenosis nonetheless had uniform R2’ and rCBF maps, possibly due to collateral perfusion. Some Moyamoya patients exhibited old infarctions and white matter hyperintensities that should be considered separately for future R2’ analysis of the Moyamoya patients.Conclusion
The results demonstrate that spin relaxation rate R2’ has the potential to be a practical, reproducible measurement of blood oxygenation in the brain for neurovascular diseases affecting oxygen extraction fraction, including chronic ischemia in Moyamoya disease. Further study may be necessary to refine the registration of subject data to MNI space, susceptibility artifacts near the anterior region, and assess oxygenation differences in other neurovascular conditions.Acknowledgements
This work is supported by NIH grant 4R00NS102884-03. The authors would like to thank Dawn Holley and Kim Halbert for support in imaging acquisitions and Marc Lebel for providing the StimFit code.References
1. Seiler, A., et al. Stroke. 2017; 48:1671-1674.
2. Sedlacik, J., et al. NeuroImage. 2014; 84:1032-1041.
3. Jenkinson, M., et al. NeuroImage. 2012; 62(2):782-790.
4. Ni, W., et al. J Cereb Blood Flow Metab. 2017; 37(4):1213-1222.
5. McTaggart, R., et al. Stroke. 2014; 46(2):407-412.
Figures