0546
Distinct cognitive and anthropometric functional connectivity traits of cognitive decline in Parkinson’s disease using partial least squares.1Basque Center on Cognition, Brain and Language, Donostia, Spain, 2Medical image processing, Swiss Federal Institute of Technology Lausanne, Lausanne, Switzerland, 3Department of Neurology, Sierrallana Hospital, Torrelavega, Spain, 4Neurology Department, Clinica Universidad de Navarra, Pamplona, Spain
Synopsis
Cognitive deficits in Parkinson’s Disease (PD) are associated with abnormalities in functional brain networks that can be observed at rest. This study investigates whole-brain independent functional-connectomes in PD patients with mild cognitive impairment (PD-MCI), associating these functional connectomes with cognitive and anthropometric measures using partial least squares (PLS) regression. We found a clear distinction between two sets (PLS-components) with functional connectomes either linked to cognitive scores or anthropometric variables. A PD-specific subcortical-cortical functional connectome was common in the two PLS-components. Furthermore, in PD-MCI a functional connectome defined by attentional and sensorimotor regions linked to attention and memory deficits is critical.
Introduction
Mild cognitive impairment (MCI) is a well-known risk factor for dementia in Parkinson’s disease (PD). Functional connectivity (FC) resting state networks (RSNs) such as the default mode (DMN), dorsal-attention, executive control and sensorimotor networks have been reported to be associated with cognitive deficits in PD1,2. Standard fMRI ICA analyses are typically used to reveal FC traits that differentiate between groups of interest. Here, we investigate whole-brain independent functional connectomes extracted with connICA3 in three group of participants, associating these functional connectomes with clinical, cognitive (e.g., attention, language) and anthropometric (e.g., age, motion) measures using partial least squares4 (PLS). PLS can consistently associate neuroimaging and cognitive and behavioral features without categorizing using clinical groups.Methods
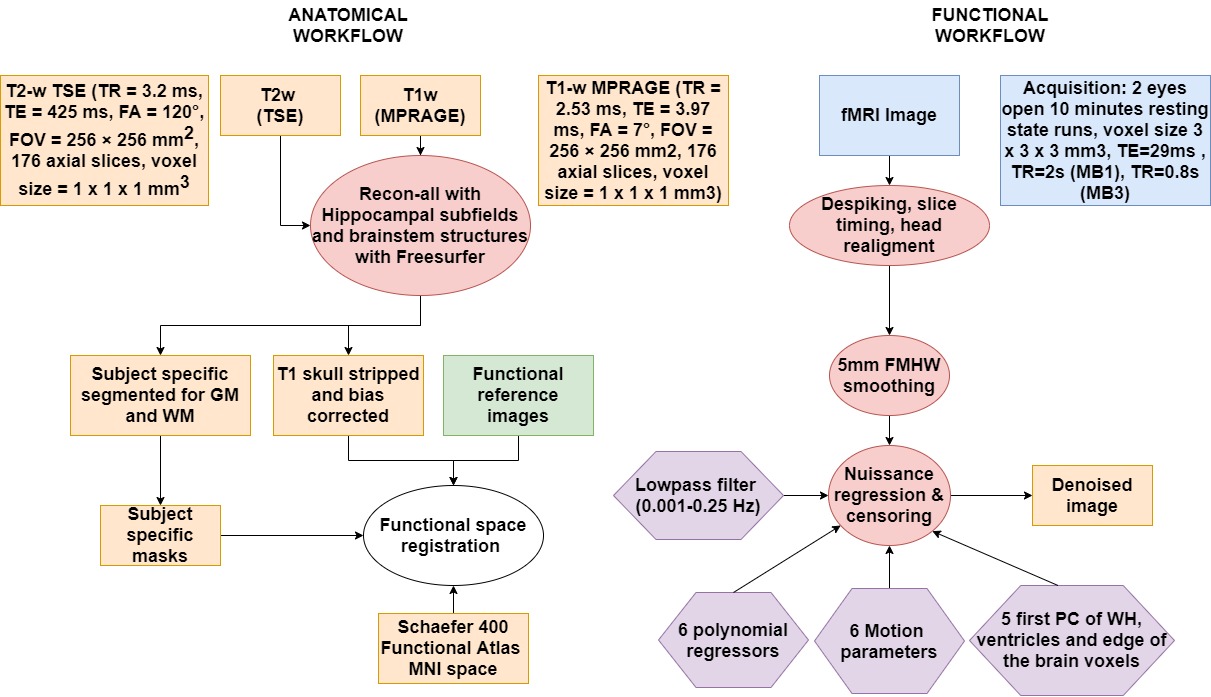
87 subjects were recruited at Hospital Donostia and BCBL, from which 65 participants including 23 PD patients with MCI (PD-MCI), 21 cognitively normal PD patients (PD-CN), and 21 healthy controls (HC) remained as the final study sample, whereas 22 participants (10 PD-MCIs, 5 PD-CNs, 7 HCs) were excluded due to excessive head motion. A battery of cognitive tests was taken by each individual to diagnose PD-MCI according to Movement Disorder Society guidelines5. PD patients were under anti-parkinsonian medication during the study. Participants underwent scanning on a Siemens Trio 3T MRI scanner with a 32-channel head coil. T1-w MPRAGE and T2-w TSE anatomical images, and two functional runs of 10-min eyes-open resting-state fMRI scans were collected. fMRI preprocessing (Figure 1) included despiking, slice timing, EPI distortion correction, head realignment and nuisance regression. FC matrices were obtained by computing Pearson’s correlation between the time-series of cortical regions defined from the Schaefer6 atlas plus subcortical regions of the Destrieux atlas7. All the FC matrices were then decomposed into independent functional connectomes (‘traits’) using ConnICA3, where the number of components was chosen to maximize subject identifiability8 (65 components). Subject-specific weights of the connICA FC traits and behavioural and non-behavioural scores were then analyzed with PLS4 (Figure 2). The behavioural variables were: z-scores from 5 cognitive domains (Attention-Memory, Executive-control, Memory, Language, Visuo-spatial) used for MCI diagnosing, the Montreal Cognitive Assessment (MoCA), the Unified Parkinson Disease Rating Scale (UPDRS), whereas the non-behavioural variables were age, motion, total grey matter (TGM) and total intracranial volume (eITV) . To determine PLS component significance, we applied permutation testing using 1000 permutations. We applied Bonferroni correction for the 11 PLScs. If a PLSc was significant, FC traits and design saliences were recalculated from a 500 random samples with replacement bootstrapping procedure. In the results, we describe the FC traits of bootstrap scores thresholded at absolute values greater than 3.00, which corresponds to a robustness at a confidence level of approximately 99%9.Results and discussion
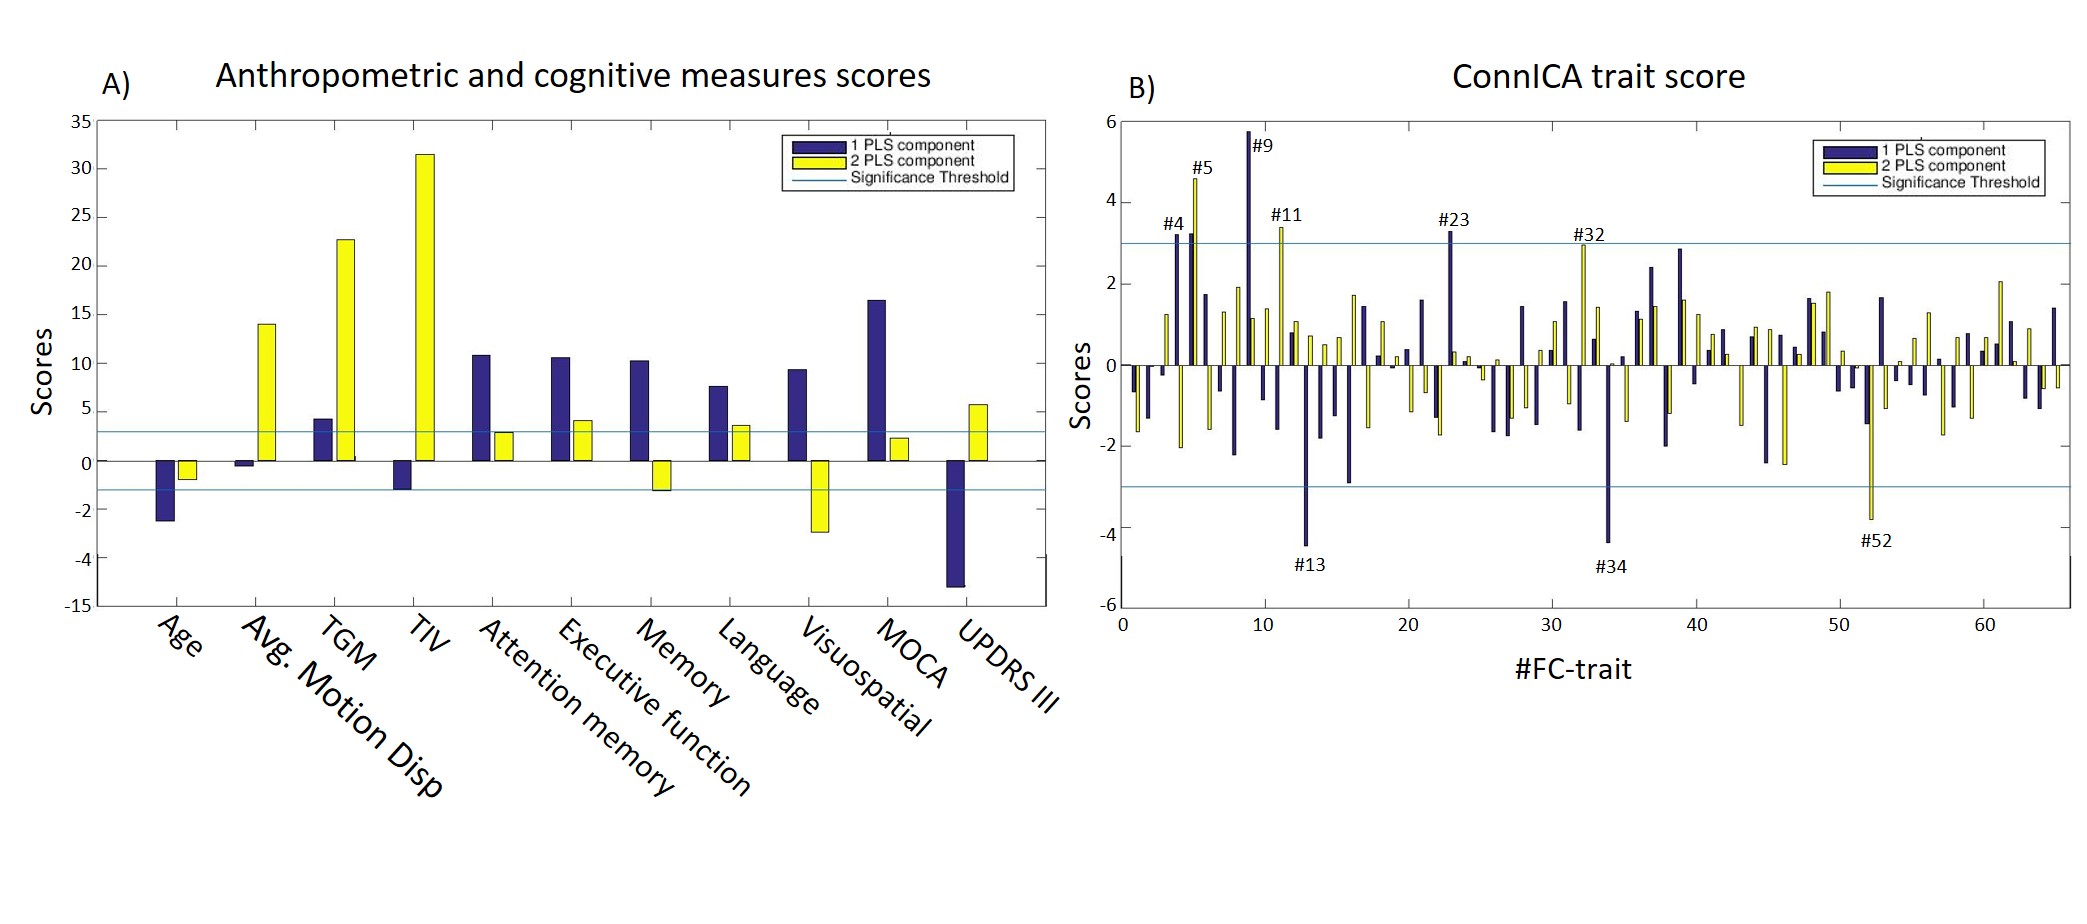
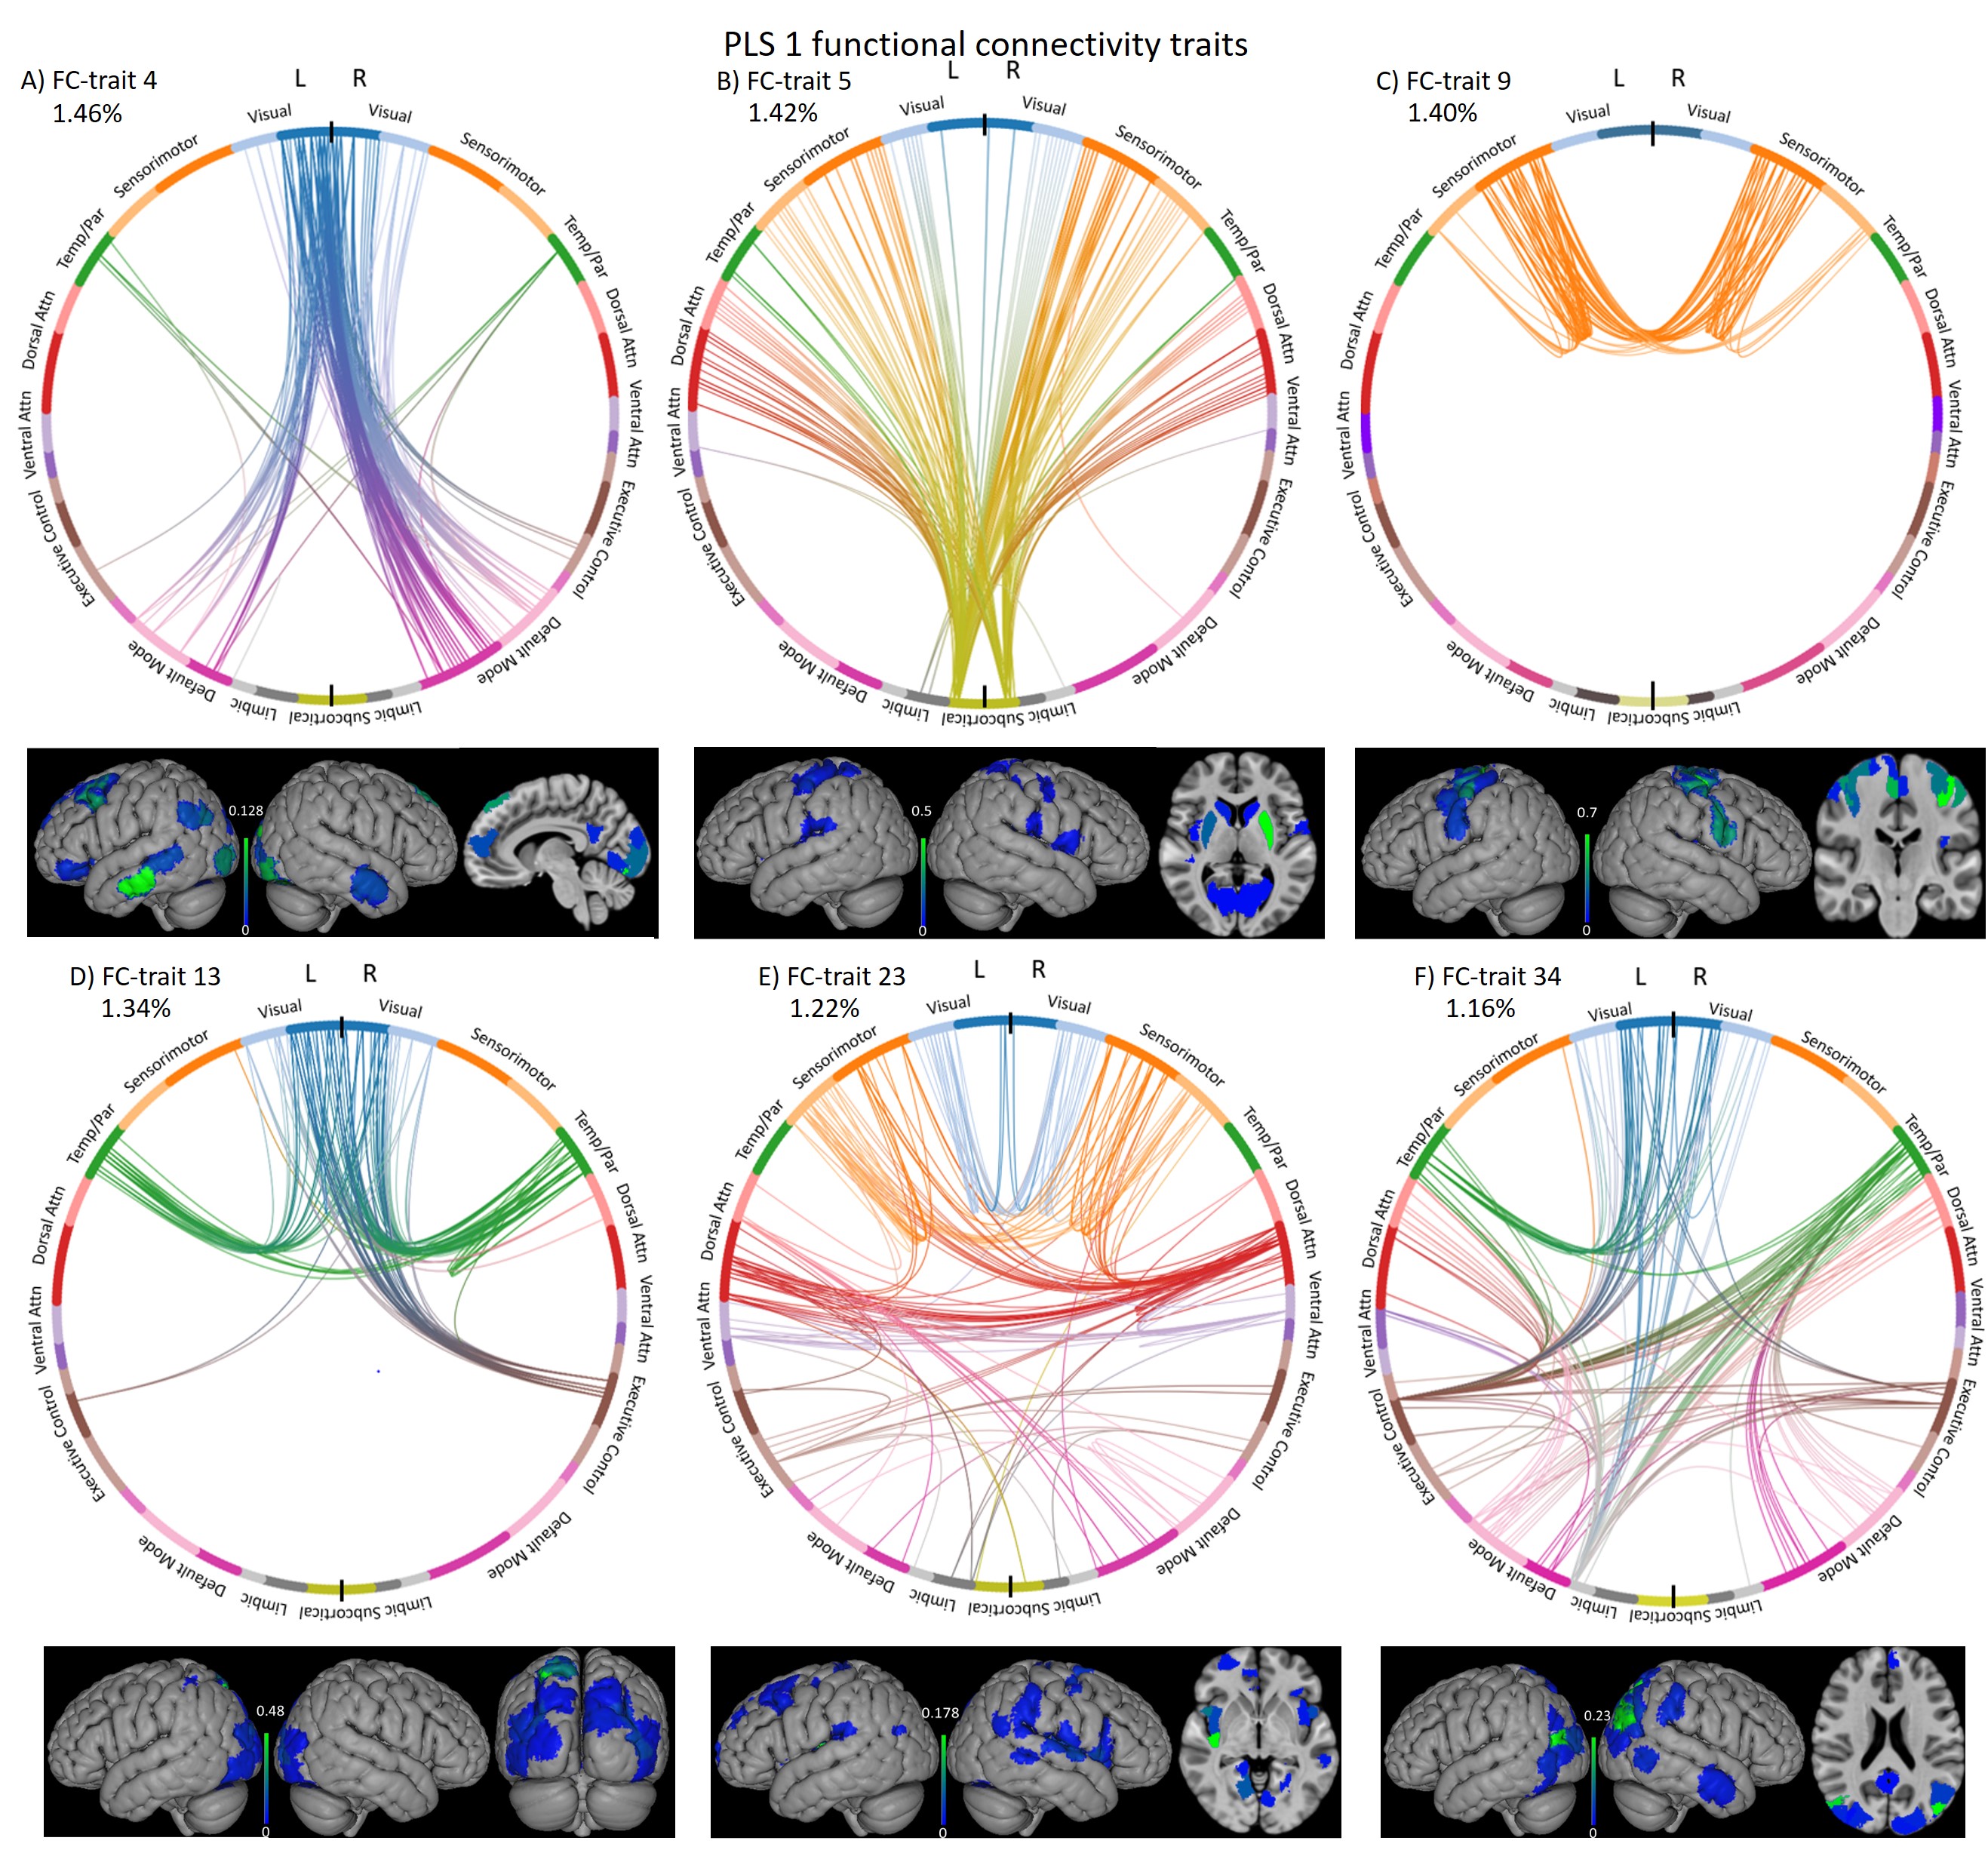
Two PLS components (PLSc) were found significant after correction. PLSc1 was mainly linked to cognitive tests and age, whereas PLSc2 was specifically related to anthropometric features such as motion, TGM and eITV (Figure 3A). The patterns of the ConnICA PLS scores (Figure 3B) clearly revealed two different FC traits.PLSc1 (Figure 4) showed a strong relationship with cognitive tests, UPDRS III and age (shown in blue in Figure 3A) and revealed FC-traits involving (in order of salience score): FC#9: regions of the sensorimotor (somatosensory, premotor and primary motor cortex) and dorsal attention networks, and from sensorimotor to limbic (e.g. insula), ventral-attention, executive-control and DMN networks10,11; FC#13: visual with temporal-parietal networks FC#34: angular gyrus; FC#23: dorsal-attention with sensorimotor and visual networks; FC#5: subcortico-cortical connections; and FC#4: visual and DMN networks.
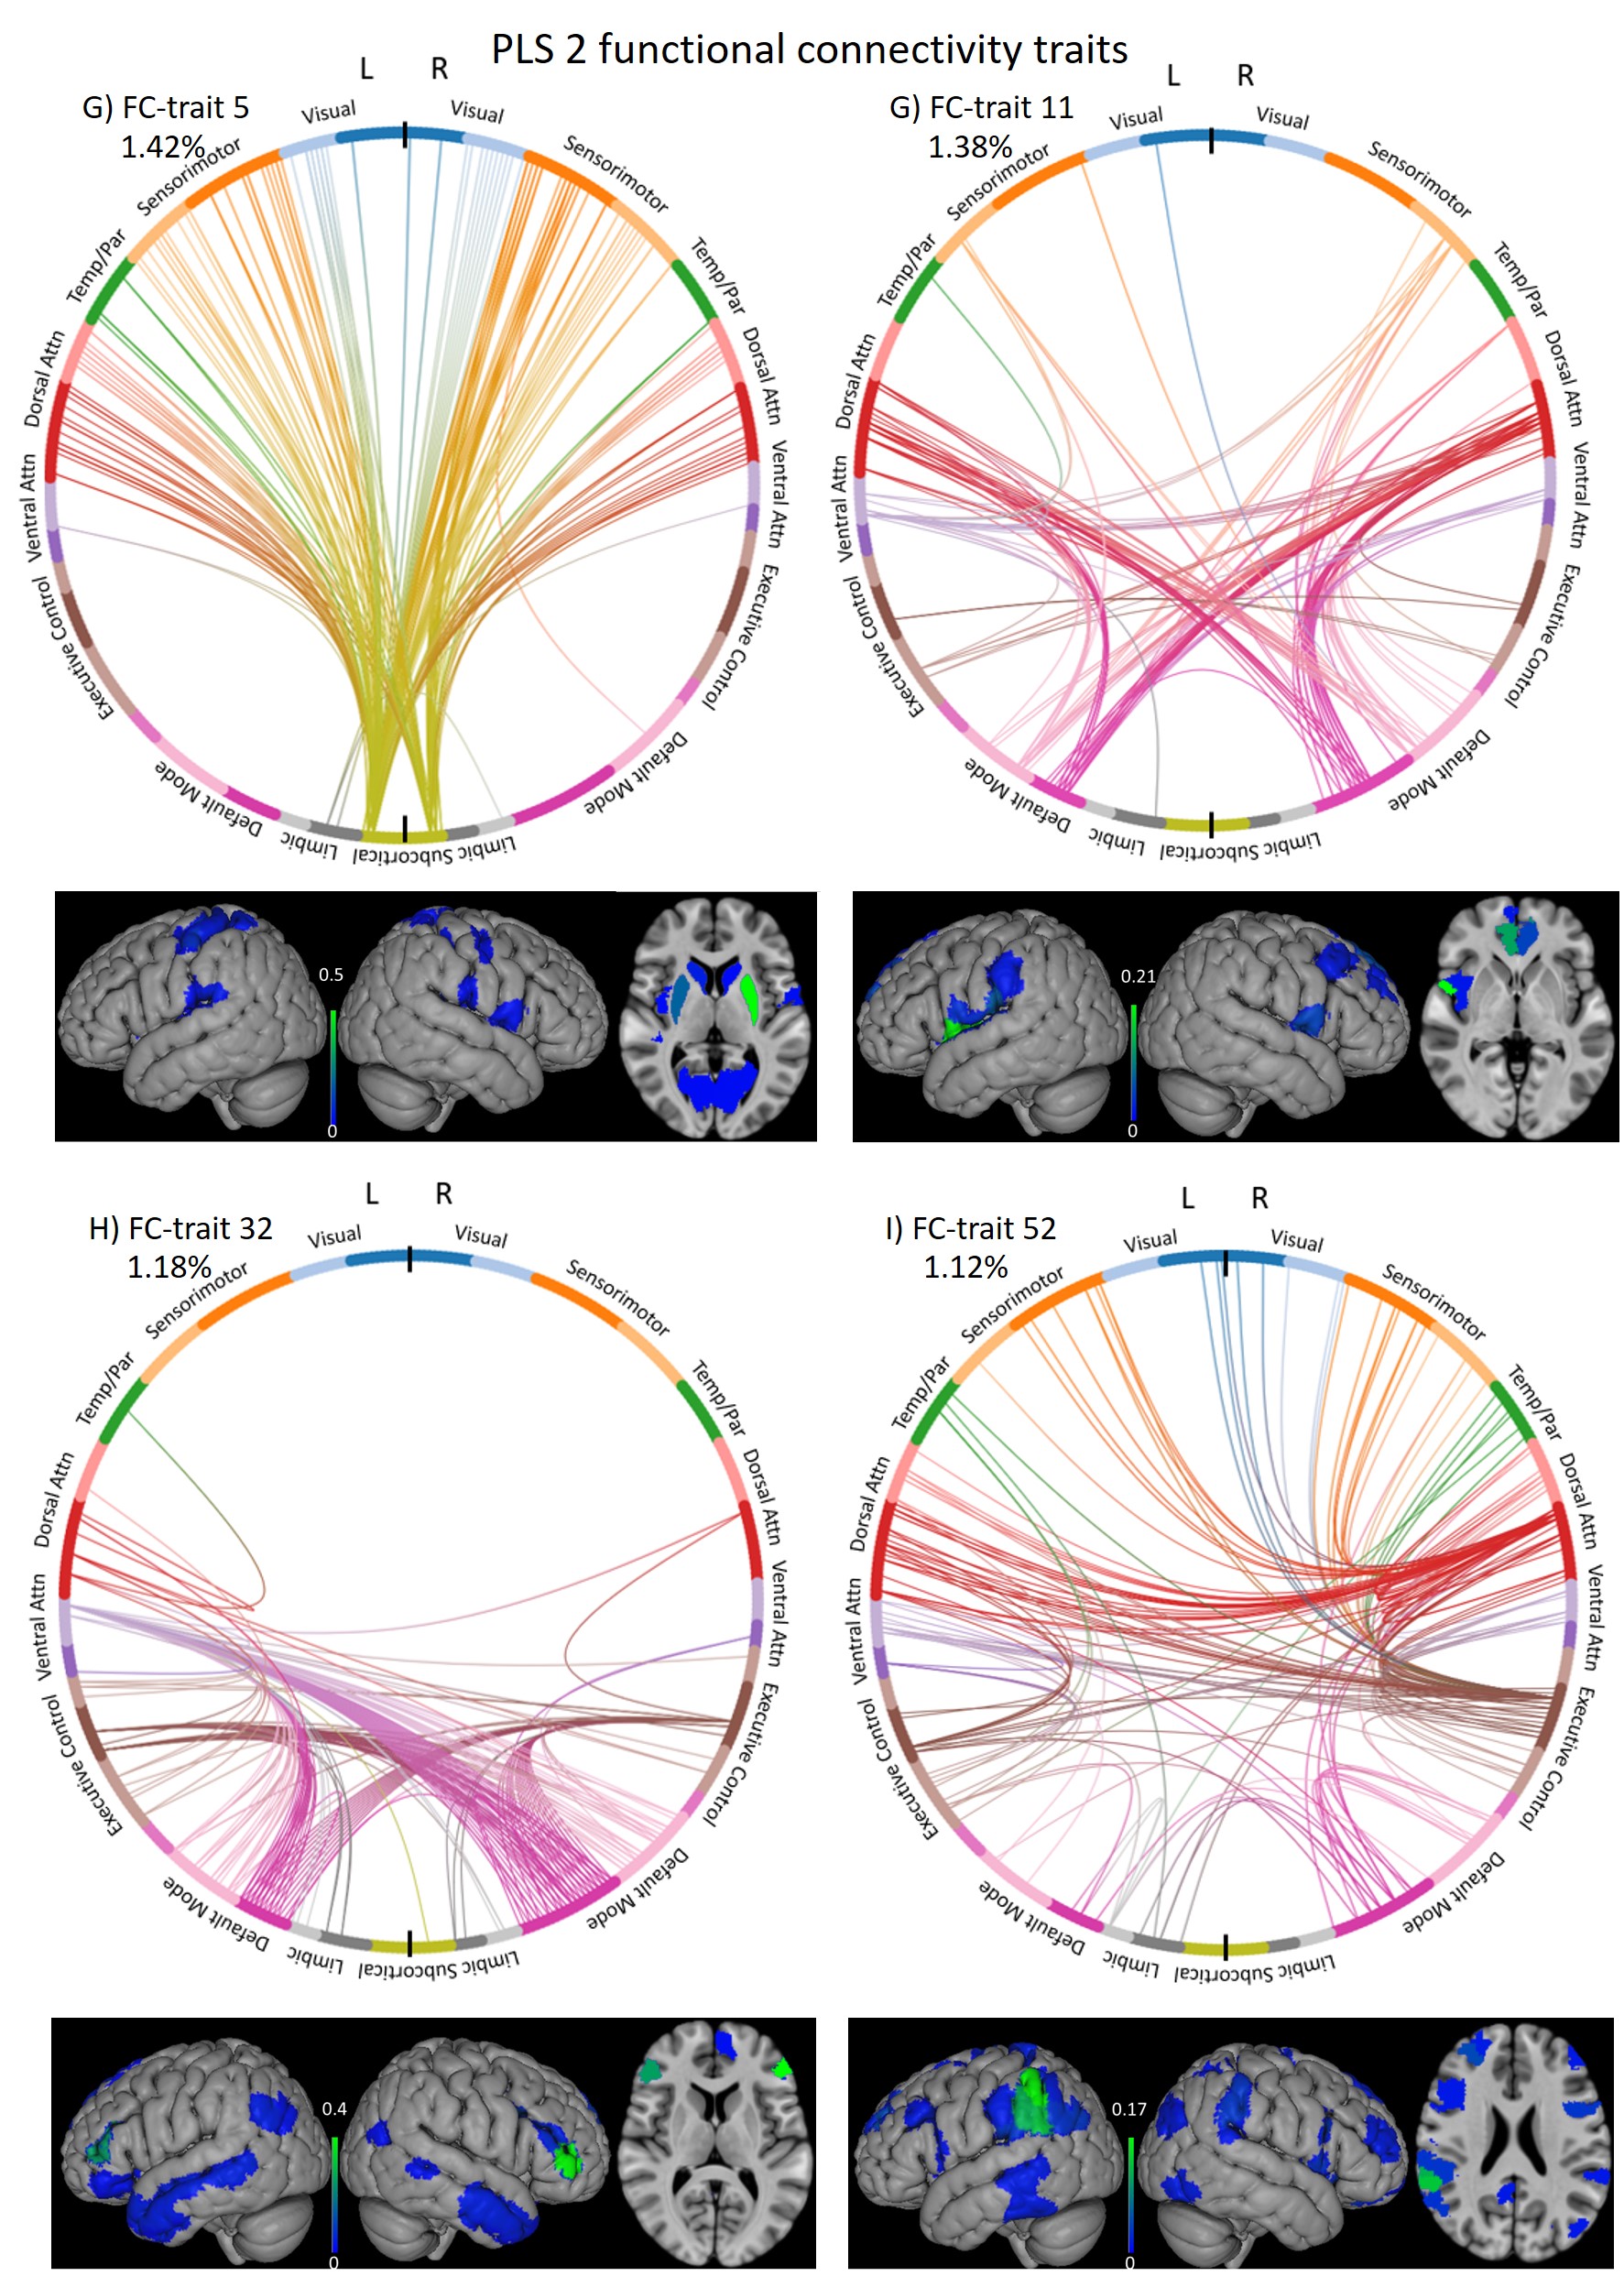
PLSc2 (Figure 5) was mainly related to brain volumetric measures (TGM and TIV), motion descriptors, and motor deficits (UPDRS-III), and revealed FC-traits involving (in order of salience score): FC#5: subcortico-cortical regions; FC#11: regions of the dorsal-attention and DMN networks FC#32: DMN with executive-control network; and FC#52: connections with the supramarginal gyrus.
Conclusions
We discover two types of whole-brain functional connectomes that are differentially related to cognitive abilities and anthropometric measures in PD patients with mild cognitive impairment. A PD-specific subcortico-cortical functional connectome was common in the two PLS-components. In PD-MCI, a functional connectome defined by attentional and sensorimotor regions is linked to attention and memory deficits.Acknowledgements
This research was possible thanks to the support of the Basque Government (predoctoral fellowship PRE_2019_1_0085, BERC 2018-2021 and PIBA_2019_104) and the Spanish Ministry of Economy and Competitiveness (Ramon y Cajal Fellowship, RYC-2017-21845).References
1. Putcha D, Ross RS, Cronin-Golomb A, Janes AC, Stern CE. Altered intrinsic functional coupling between core neurocognitive networks in Parkinson’s disease. NeuroImage Clin 2015; 7: 449–455.
2. Kim J, Criaud M, Cho SS, Díez-Cirarda M, Mihaescu A, Coakeley S, et al. Abnormal intrinsic brain functional network dynamics in Parkinson’s disease. Brain 2017; 140: 2955–2967.
3. Amico E, Marinazzo D, Di Perri C, Heine L, Annen J, Martial C, et al. Mapping the functional connectome traits of levels of consciousness. Neuroimage 2017; 148: 201–211.
4. McIntosh AR, Lobaugh NJ. Partial least squares analysis of neuroimaging data: Applications and advances. In: NeuroImage. 2004.
5. Litvan I, Goldman JG, Tröster AI, Schmand BA, Weintraub D, Petersen RC, et al. Diagnostic criteria for mild cognitive impairment in Parkinson’s disease: Movement Disorder Society Task Force guidelines. Mov Disord 2012; 27: 349–56.
6. Schaefer A, Kong R, Gordon EM, Laumann TO, Zuo X-N, Holmes AJ, et al. Local-Global Parcellation of the Human Cerebral Cortex from Intrinsic Functional Connectivity MRI. Cereb Cortex 2018; 28: 3095–3114.
7. Fischl B, Salat DH, Busa E, Albert M, Dieterich M, Haselgrove C, et al. Whole brain segmentation: Automated labeling of neuroanatomical structures in the human brain. Neuron 2002; 33: 341–355.
8. Amico E, Goñi J. The quest for identifiability in human functional connectomes. Sci Rep 2018; 8: 8254.
9. Garrett DD, Kovacevic N, McIntosh AR, Grady CL. The modulation of BOLD variability between cognitive states varies by age and processing speed. Cereb Cortex. 2013 Mar;23(3):684-93.
10. Baggio H, Segura B, Sala‐Llonch R, Marti M, Valldeoriola F, Compta Y, et al. Cognitive impairment and resting-state network connectivity in Parkinson's disease. Human Brain Mapping 2015; 36: 199-212
11. Díez-Cirarda M, Strafella AP, Kim J, Peña J, Ojeda N, Cabrera-Zubizarreta A, et al. Dynamic functional connectivity in Parkinson's disease patients with mild cognitive impairment and normal cognition. NeuroImage: Clinical 2018; 17: 847-55
Figures