0545
Tracking serial Parkinson’s related changes in the substantia nigra using Neuromelanin MRI and free-water diffusion MRI1Division of Clinical Neuroscience, Queen’s Medical Centre, University of Nottingham, Nottingham, United Kingdom, 2Sir Peter Mansfield Imaging Centre, University of Nottingham, Nottingham, United Kingdom, 3NIHR Nottingham Biomedical Research Centre, University of Nottingham, Nottingham, United Kingdom, 4Department of Neurology, Nottingham University Hospital Trust, Nottingham, United Kingdom, 5Departments of Psychiatry and Radiology (O.P.), Brigham and Women's Hospital, Harvard Medical School, Boston, MA, United States
Synopsis
Parkinson’s Disease (PD) is characterized by loss of neuromelanin-containing dopaminergic neurons in the substantia nigra (SN), resulting in depigmentation as its pathological hallmark. Neuromelanin (NM)-sensitive-MRI consistently shows PD-related nigral signal-loss with limited evidence for longitudinal change. Nigral free-water (FW) derived from diffusion-MRI can track disease progression. This multimodal-serial study compared subregional annual depigmentation rates and FW in PD and controls. Longitudinal NM signal-loss and FW increase was seen in PD throughout the SN with significant acceleration compared to controls in the ventral-SN. There was no between-metrics correlation, suggesting that these promising serial biomarkers may track different aspects of PD progression.
Introduction:
Neuromelanin-sensitive MRI (NM-MRI) is an emerging biomarker of nigral depigmentation indexing the loss of melanized neurons, which reliably detects NM signal loss in the ventral substantia nigra (SN) in PD compared to age-matched controls1-2. Additionally, recent evidence showed increased nigral free-water (FW) in PD based on diffusion imaging combined with bi-tensor modeling, thought to reflect degeneration3-5. However, the precise mechanisms underlying NM and FW change metrics, their trajectories, spatial profiles, and comparative sensitivity to track PD progression are largely unknown. To address some of these gaps, our multimodal study aimed to determine and compare annualized serial NM-MRI and FW changes in ventral and dorsal SN in participants with Parkinson’s and controls.Methods:
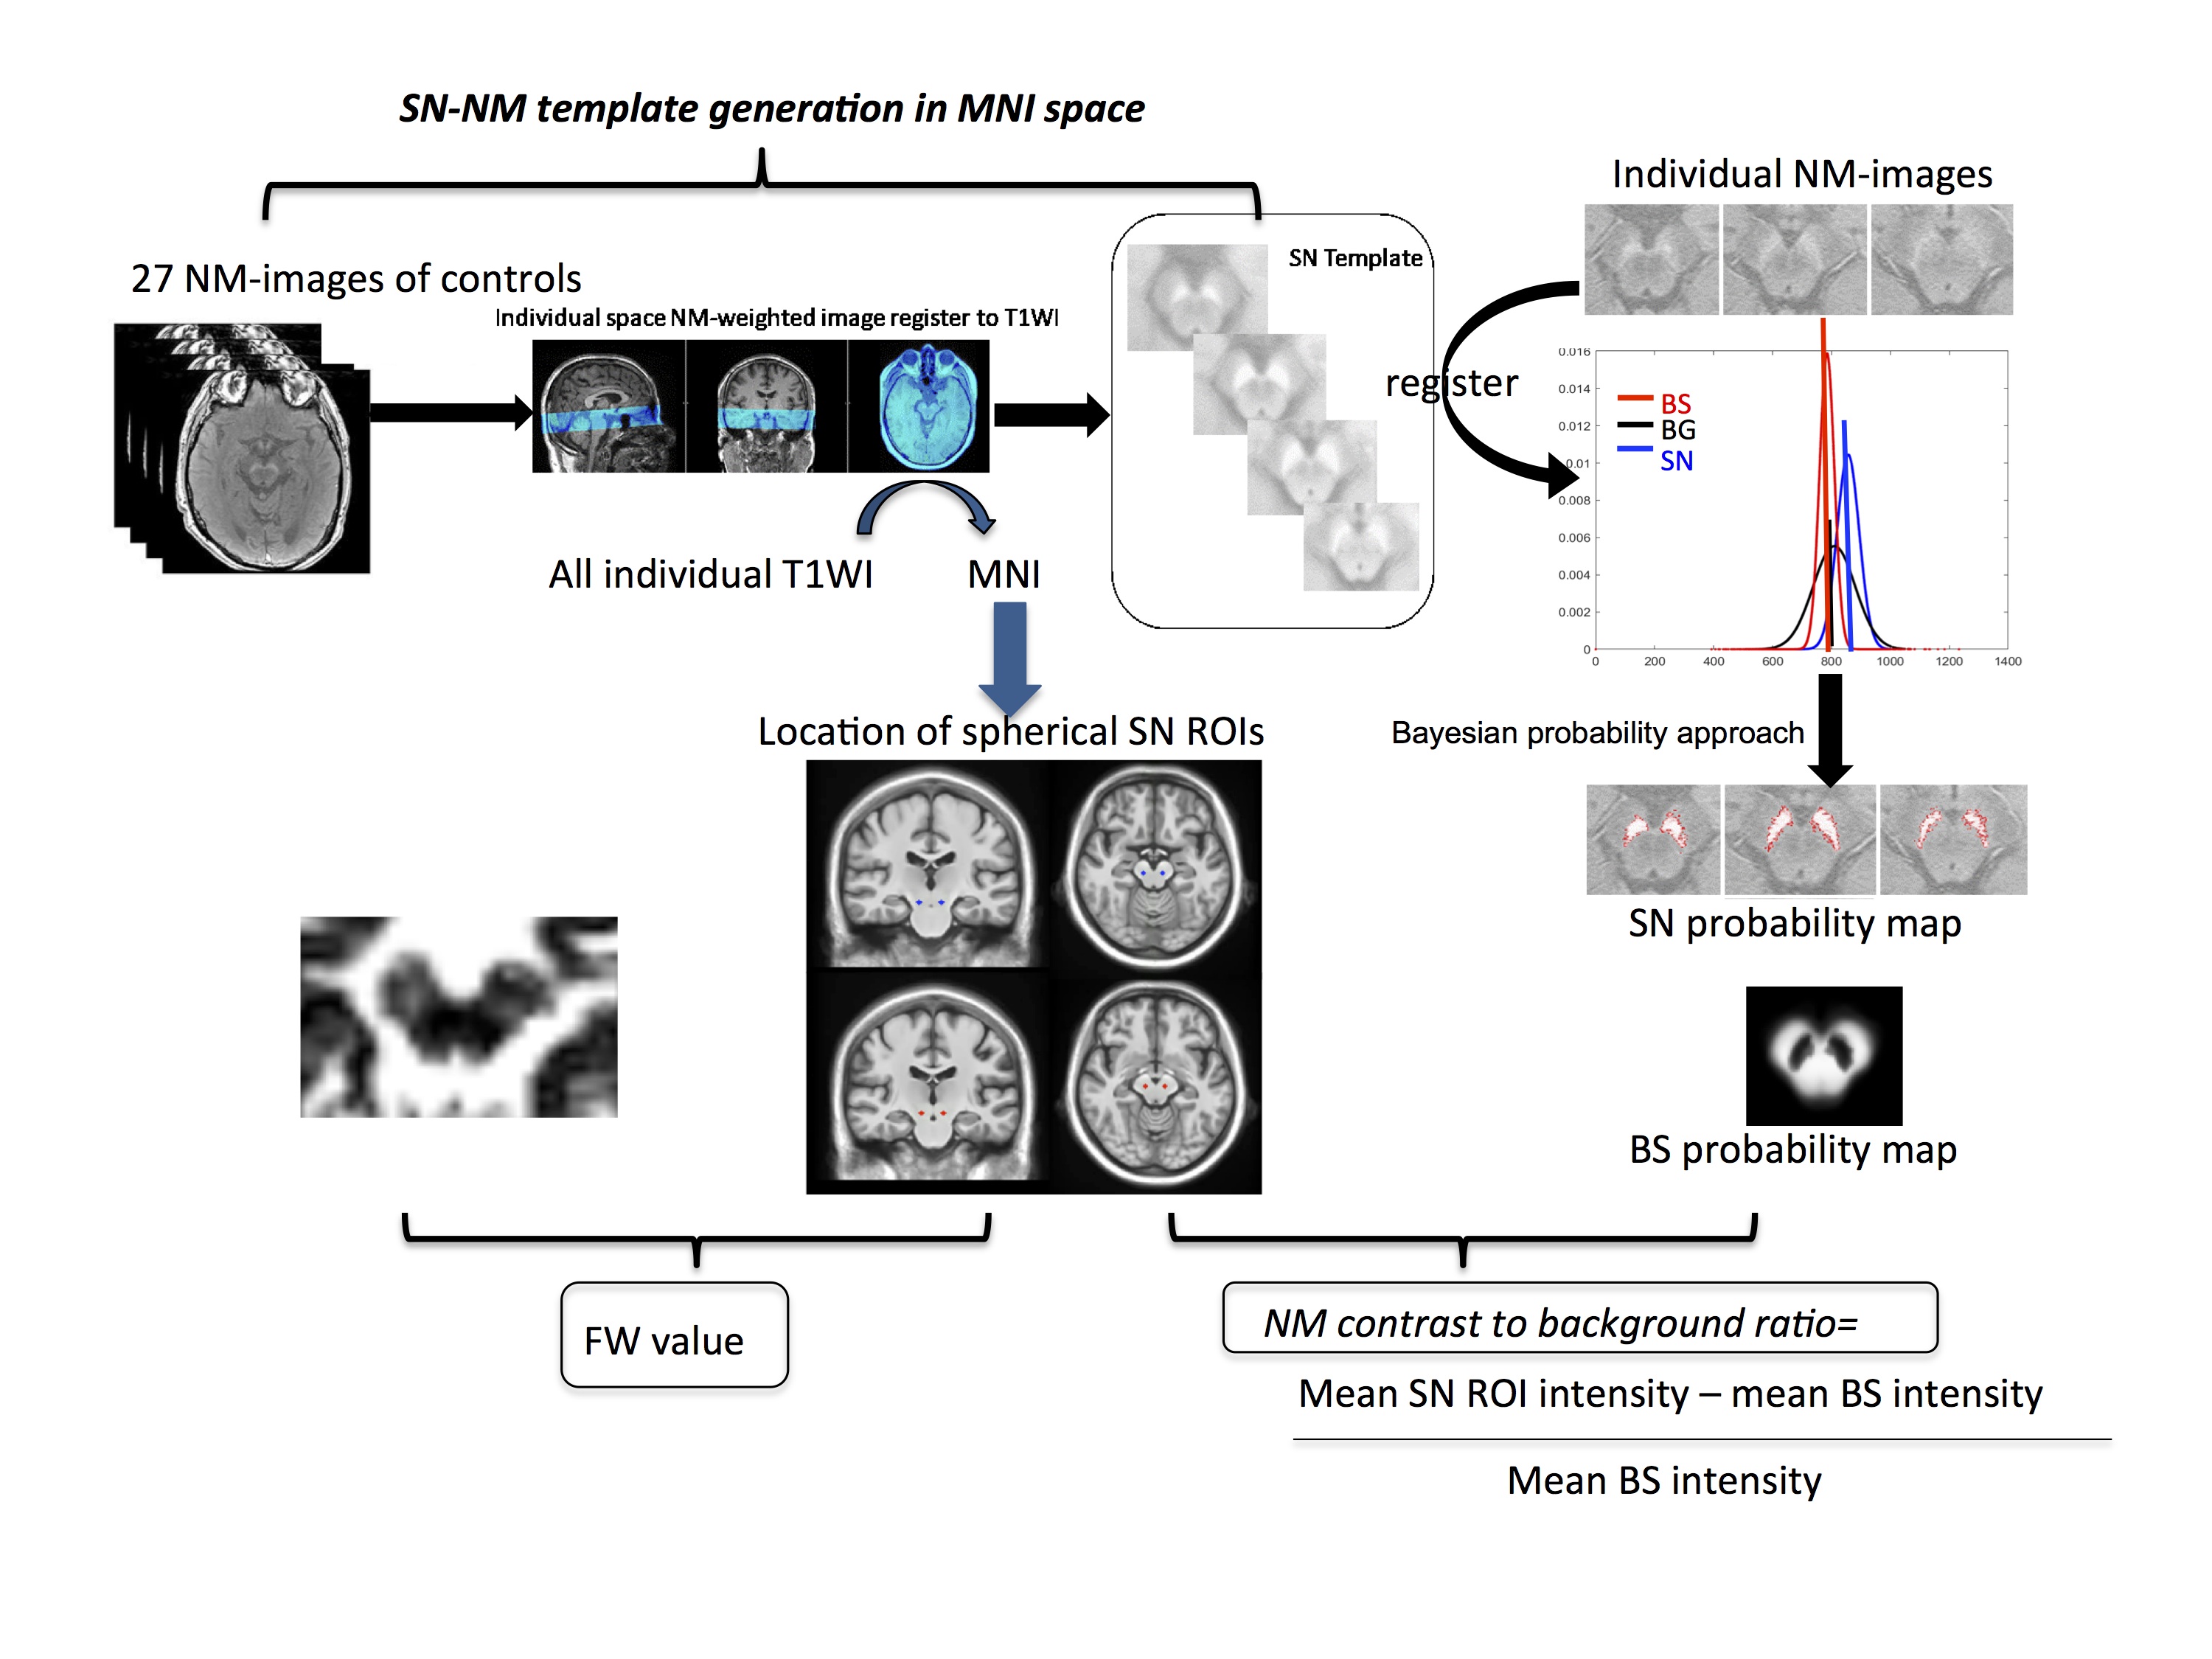
36 people with Parkinson’s (23 males, age mean±std 66.2±8.6 years) and 15 controls (5 males, age 67.1±10.2 years) were recruited at one site as part of a multi-centre longitudinal case-control imaging study (PaMIR). All participants underwent a baseline and follow-up MRI after an average of 1.9 years on a 3T GE scanner (Discovery MR750; GE Healthcare, Milwaukee, WI; 32-channel head coil) that included one of two NM-MRI protocols (TR= 38.4 ms; TE=3 ms; flip angle, 20°; slice thickness, 2mm; Field of view, 19.2; voxel size: 0.375×0.375×2mm; 30 slices; or T1-weighted spin-echo sequence with additional “off-resonance” MT pulse 600/10; section thickness, 2.5 mm; 0.38×0.38 in-plane resolution; 0.3-mm gap; three averages, 12/11 slices) and single shell diffusion-MRI (2D spin-echo EPI, voxel size 2 isotropic mm3, no gap, Matrix 128×128, TR=10s, TE=64.3ms, TI=87, b=1000s/mm2, 32 evenly spaced and non-collinear directions with 4 additional b=0s/mm2, fat-special saturation, and 48 slices) and high-resolution 3D T1-weighted image of 1mm3 isotropic. DTI analyses, including brain-extraction, nonlinear registration, and eddy current correction were performed using DTI pipeline6 developed based on FSL v6.0 Toolbox (www.fmrib.ox.ac.uk/fsl). FW was then estimated using a regularized bi-tensor model as described before7. The NM-MR images were processed following an in-house Bayesian-based automated pipeline that also provided a NM-rich template in MNI space for consistent region-of-interest analysis across time points and modalities. Spherical ROIs (kernel=3) were defined in the left and right ventral and dorsal NM-rich SN template (Figure-1). Finally, change rates were defined as the mean annualized percentages of reduction of NM or increase of FW metrics using (Vbaseline-Vfollow-up)/ Vbaseline/interval [years], where V represents either the values of NM contrast or FW.Results:
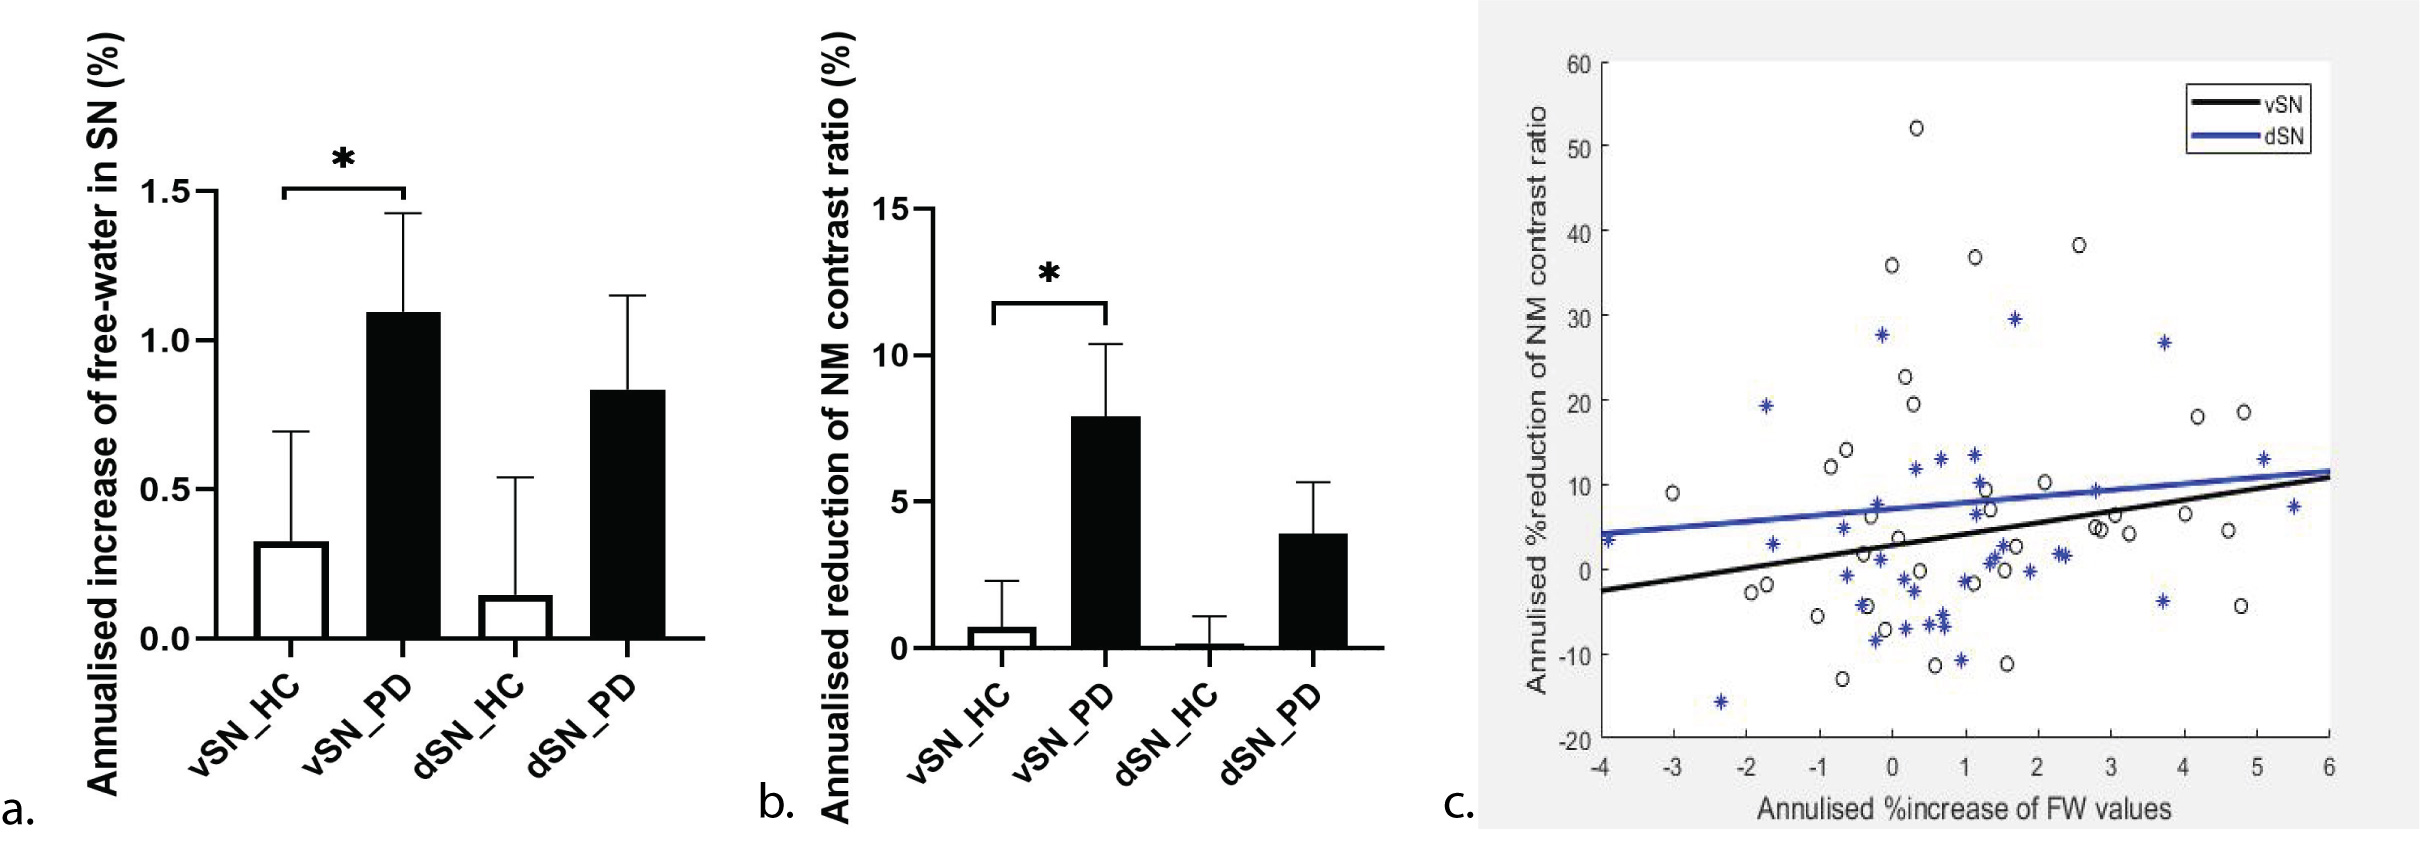
We found an accelerated loss of ventral-SN NM contrast ratio in PD compared to controls with an estimated mean difference of 7.2% (95% confidence interval [1.47 12.9]%) [Figure-2a]. We also showed an accelerated increase in nigral FW in PD compared to controls (mean difference 0.8% and 95% CI [0.199 1.736]%) [Figure-2b]. Acceleration rates were nominally higher for NM metrics with similar effect-sizes presented as Cohen’s d in the dorsal SN (0.4 for FW and 0.5 for NM), but higher for NM-SN in the ventral SN (0.7 vs ventral SN FW 0.4). There was substantial intersubject heterogeneity but no correlation was found between the annualized % increase of FW values versus the annualized % reduction of NM contrast ratio in ventral or dorsal SN [Figure-2c].Discussion:
To our best knowledge, this is the first study to investigate the serial change of NM and FW simultaneously. Several recent longitudinal diffusion-MRI investigations have reported increases of MRI estimates of FW in the ventral SN in PD 8-9, which are well in line with our results. This alteration of FW could reflect several pathologic processes, such as cellular atrophy and/or inflammation4-5. The serial NM analysis also revealed an accelerated loss of NM-SN signal in PD compared to controls showing a larger effect size than FW change metrics in the ventral SN. These NM contrast changes are considered to reflect a concentration loss of the neuromelanin-iron complex. Our findings are well in line with recently reported SN volume loss in PD, which was demonstrated to follow an exponential decrease with disease duration10. Interestingly, we did not observe a correlation between the NM and FW change metrics, which may imply diverse or complicated mechanisms11 that warrant further investigation. A previous multimodal-MRI study also reported modality specificity with higher free water in the ventral and higher paramagnetic effects in the dorsal SN in PD but did not observe serial changes in either modality which may reflect the more advanced disease stage of their cohort12. Finally, we noticed considerable interindividual variability with inverse changes of both FW and NM in a minority of cases, suggesting limited measurement precision or co-registration errors. Given the size of SN subregions and the known spatial heterogeneity of effects, reliable localization is important for accurate estimations, and we suggest that future studies may adopt a dual-imaging template by integrating NM and b=0smm2 when the association is explored.Conclusions:
Our multimodal serial substudy demonstrates the sensitivity of both neuromelanin-MRI and free-water diffusion-MRI to monitor progressive nigral pathology in early PD over two years, which illustrates their potential to track disease progression.Acknowledgements
We thank all participants, and Andrew Cooper for scanning the participants. We also thank Dr. Sare and the research nurses from the movement disorder clinic at Queen’s Medical Centre, Nottingham for support and recruiting patients. We acknowledge Parkinson’s UK and Michael J. Fox Foundation for funding us.References
1.Schwarz ST , Xing Y , Tomar P , Bajaj N , Auer DP. In vivo assessment of brainstem depigmentation in Parkinson disease: potential as a severity marker for multicenter studies. Radiology 2017; 283: 789–98.
2.Takahashi H , Watanabe Y , Tanaka H , Mihara M , Mochizuki H , Takahashi K , et al. Comprehensive MRI quantification of the substantia nigra pars compacta in Parkinson's disease. Eur J Radiol 2018; 109: 48–56.
3. Ofori E, Pasternak O, Planetta PJ, et al. Increased free water in the substantia nigra of Parkinson’s disease: a single-site and multi-site study. Neurobiol Aging. 2015;36(2):1097-1104. doi:10.1016/j.neurobiolaging.2014.10.029
4.Pasternak O, Sochen N, Gur Y, et al. Free water elimination and mapping from diffusion MRI. Magn Reson Med 2009;62:717–30doi:10.1002/mrm.22055 pmid:19623619
5.Planetta PJ, Ofori E, Pasternak O, et al. Free-water imaging in Parkinson's disease and atypical parkinsonism. Brain 2016;139:495–508 doi:10.1093/brain/awv361 pmid:26705348
6. Ali-Reza Mohammadi-Nejad, Stefan Pszczolkowski, Dorothee Auer, Stamatios Sotiropoulos. Multi-modal neuroimaging pipelines for data preprocessing. Zenodo. http://doi.org/10.5281/zenodo.3624973
7. Pasternak O, Shenton ME, Westin CF, Estimation of extracellular volume from regularized multi-shell diffusion MRI. Med Image Comput Comput Assist Interv 2012;15(Pt 2):305–12 pmid:23286062
8.Burciu RG, Ofori E, Archer DB, et al. Progression marker of Parkinson’s disease: A 4-year multi-site imaging study. Brain. doi:10.1093/brain/awx146
9.T. Guttuso, N. Bergsland, J. Hagemeier, D.G. Lichter, O. Pasternak and R. Zivadinov; American Journal of Neuroradiology February 2018, DOI: https://doi.org/10.3174/ajnr.A5545
10.Emma Biondetti, Rahul Gaurav, Lydia Yahia-Cherif, Graziella Mangone, Nadya Pyatigorskaya, Romain Valabrègue, Claire Ewenczyk, Matthew Hutchison, Chantal François, Jean-Christophe Corvol, Marie Vidailhet, Stéphane Lehéricy, Spatiotemporal changes in substantia nigra neuromelanin content in Parkinson’s disease, Brain, Volume 143, Issue 9, September 2020, Pages 2757–2770, https://doi.org/10.1093/brain/awaa216
11. Priovoulos, N., van Boxel, S.C.J., Jacobs, H.I.L. et al. Unraveling the contributions to the neuromelanin-MRI contrast.Brain Struct Funct 225, 2757–2774 (2020). https://doi.org/10.1007/s00429-020-02153-z
12. Arribarat G, Pasternak O, De Barros A, Galitzky M, Rascol O, Péran P. Substantia nigra locations of iron-content, free-water and mean diffusivity abnormalities in moderate stage Parkinson's disease. Parkinsonism Relat Disord. 2019 Aug;65:146-152. doi: 10.1016/j.parkreldis.2019.05.033. Epub 2019 May 22. PMID: 31182373.
Figures