0544
Investigating Spatiotemporal Changes in Dopamine, Neuromelanin and Iron in the Nigrostriatal System in Parkinson's Disease
Emma Biondetti1,2,3, Mathieu D. Santin1,2, Romain Valabrègue1,2, Graziella Mangone1,4, Rahul Gaurav1,2,3, Nadya Pyatigorskaya1,3,5, Matthew Hutchison6, Lydia Yahia-Cherif1,2, Nicolas Villain1,7, Marie-Odile Habert8, Isabelle Arnulf1,3,9, Smaranda Leu-Semenescu9, Pauline Dodet9, Jean-Christophe Corvol1,4,7, Marie Vidailhet1,3,7, and Stéphane Lehéricy1,2,3,5
1Institut du Cerveau – ICM, INSERM U 1127, CNRS UMR 7225, Sorbonne Université, Paris, France, 2ICM, Centre de NeuroImagerie de Recherche – CENIR, Paris, France, 3ICM, Team “Movement Investigations and Therapeutics” (MOV’IT), Paris, France, 4National Institute of Health and Medical Research - INSERM, Clinical Investigation Centre, Pitié-Salpêtrière Hospital, Paris, France, 5Department of Neuroradiology, Pitié-Salpêtrière Hospital, AP-HP, Paris, France, 6Biogen Inc., Cambridge, MA, United States, 7Department of Neurology, Pitié-Salpêtrière Hospital, AP-HP, Paris, France, 8Department of Nuclear Medicine, Pitié-Salpêtrière Hospital, AP-HP, Paris, France, 9National Reference Center for Rare Hypersomnias, Pitié-Salpêtrière Hospital, AP-HP, Paris, France
1Institut du Cerveau – ICM, INSERM U 1127, CNRS UMR 7225, Sorbonne Université, Paris, France, 2ICM, Centre de NeuroImagerie de Recherche – CENIR, Paris, France, 3ICM, Team “Movement Investigations and Therapeutics” (MOV’IT), Paris, France, 4National Institute of Health and Medical Research - INSERM, Clinical Investigation Centre, Pitié-Salpêtrière Hospital, Paris, France, 5Department of Neuroradiology, Pitié-Salpêtrière Hospital, AP-HP, Paris, France, 6Biogen Inc., Cambridge, MA, United States, 7Department of Neurology, Pitié-Salpêtrière Hospital, AP-HP, Paris, France, 8Department of Nuclear Medicine, Pitié-Salpêtrière Hospital, AP-HP, Paris, France, 9National Reference Center for Rare Hypersomnias, Pitié-Salpêtrière Hospital, AP-HP, Paris, France
Synopsis
Parkinson's disease (PD) and idiopathic rapid eye movement sleep behaviour disorder (iRBD, a prodromal condition of Parkinsonism) are characterised by progressive striatal dopaminergic denervation, loss of neuromelanin-containing neurons and increased iron deposition in the substantia nigra. Here, we evaluated neurodegeneration-induced changes in the nigrostriatal system of PD and iRBD patients using longitudinal SPECT and MR imaging compared to healthy control subjects. We showed that dopamine, neuromelanin and iron changes followed similar spatiotemporal gradients of neurodegeneration, and we assessed the temporal onset and ordering of such changes.
Introduction
Parkinson's disease (PD) is diagnosed when 30-50% dopaminergic neurons in the substantia nigra pars compacta (SNc) are lost.1,2 Motor symptoms in PD are often preceded by early non-motor symptoms, e.g. idiopathic rapid eye movement sleep behaviour disorder (iRBD).3Neuromelanin (NM) and iron are interrelated via the dopaminergic metabolic pathway and may participate in the neurodegenerative process of PD.4,5 Indeed, the NM-containing neurons of PD patients have abnormally elevated iron concentrations, up to 50% higher than in healthy controls (HCs).6,7
Previous studies using a combination of NM-sensitive MRI (NM-MRI), iron-sensitive MRI, and dopamine-sensitive nuclear imaging have correlated striatal dopamine decrease and SNc NM decrease,8-11 striatal dopamine decrease and SNc iron increase,11 SNc NM decrease and SNc iron increase.12-15 These three measurements have never been investigated together longitudinally in both clinical PD and prodromal PD (iRBD). Other studies have temporally placed the onset of striatal dopamine changes (10-25 years before PD diagnosis)16 or nigral NM (5 years before PD diagnosis).17 However, the time onset of nigral iron changes is unknown.
Here, we aimed to investigate the spatiotemporal relationships between iron, NM and dopamine transporter (DaT) in the nigrostriatal system of patients with PD and iRBD.
Methods
A longitudinal cohort was prospectively investigated, including (#visit 1[#visit 2]): 55[28] HCs, 43[21] iRBDs and 135[83] PDs (Table 1). Motor disability, global cognition and mood/behaviour were respectively evaluated using the MDS-UPDRS part III;18 the Mattis DRS19,20 and the MoCA scales;21 and the ASBPD scales22 (Table 1).MRI was performed on a Siemens Prisma 3 T system (64-channel receive head coil) including a 3D T1-weighted MP2RAGE acquisition for anatomical reference, a 2D T1-weighted TSE protocol for NM-MRI, and a 3D T2*-weighted FLASH protocol for iron-sensitive MRI (Table 2). 35[18] HCs, 32[16] iRBDs, 48[40] PDs also underwent DaT-SPECT on a hybrid gamma camera Discovery 670 Pro system using the 123I-Ioflupane tracer.
For each subject, a quantitative susceptibility map (QSM) was calculated based on the iron-sensitive data (QSM pipeline: nonlinear temporal fitting,23 background field removal using projection onto dipole fields,24 inverse problem solution using piece-wise constant regularization,25 referencing to the posterior limb of the internal capsule26). Both the NM-sensitive and QSM images were coregistered to a digital brain template as previously described.17 In template space, an SNc region of interest (ROI) previously calculated based on NM-MRI of HCs17 was considered, and here voxel-wise values of NM signal to noise ratio (SNR) and QSM were calculated. The SNc ROI was manually subdivided into three subregions:27 sensorimotor, associative and limbic. In each SNc subregion, the average NM SNR and QSM signal were calculated. For each subject, the DaT-SPECT was aligned to the MP2RAGE image, then referenced to an ROI in the occipital cortex with non-specific DaT uptake.28 The average DaT (specific binding ratio) was calculated in seven striatal ROIs segmented by aligning the YeB atlas29,30 to the MP2RAGE image: the nucleus accumbens (NAc), the sensorimotor, associative and limbic caudate nucleus (Cd) and the sensorimotor, associative and limbic putamen (Pu). In patients, all NM, QSM and DaT values were lateralized to obtain consistent alignment with the most affected brain hemisphere.
In the most affected hemisphere, the temporal evolution of striatal DaT, SNc NM and SNc iron was investigated by exponentially fitting their percent ratio relative to HCs over disease duration. Inter-group differences in striatal DaT, nigral NM and nigral iron at V1, V2 and longitudinally were assessed using univariate linear models (covariates: sex and age, Tukey’s correction for multiple comparisons). In the SNc, concomitant changes between striatal DaT, SNc NM and SNc iron were evaluated by calculating voxel-wise correlations between each pair of measurements (adjusted for multiple comparisons).
Results and Discussion
In the striatum and SNc of patients, based on the inter-group differences in DaT, NM and iron, neurodegeneration appeared to start in the most affected hemisphere (progressing from sensorimotor, to associative and limbic areas) and to progress with a similar spatial pattern and a lower extent in the contralateral hemisphere (Figure 1).In the most affected hemisphere of PDs, the analysis of DaT, NM and iron over disease duration indicated that DaT loss started between 20.7 (sensorimotor Pu) and 1.9 years (limbic Cd) before PD diagnosis (Figure 2). In the SNc, iron accumulation started 9.6 (sensorimotor), 6.2 (associative) or 4.1 years (limbic) before diagnosis, whereas NM loss started 5.9 (sensorimotor) and 3.6 years (associative) before diagnosis (Figure 2). In the limbic SNc, NM signal changes were very small.
In the SNc, the spatial DaT-NM correlation pattern was lateralized in the most affected hemisphere, whereas the DaT-iron correlation pattern was always bilateral (except for the NAc) (Figure 3). The NM-iron correlation pattern was located in the anterior SNc, corresponding to associative/limbic territories (Figure 3).
Taken together, these results suggest that in PD, first DaT is lost in the striatum, then iron accumulation precedes NM loss in the SNc. All three measurements were correlated.
Conclusions
In the nigrostriatal system in prodromal and clinical PD, we showed the spatial gradient of changes in DaT, NM and iron, and estimated the temporal onset and the relative temporal ordering of such changes. DaT, NM and iron were correlated suggesting a relationship between iron changes and degeneration of the dopaminergic pathway.Acknowledgements
This study was funded by grants from the Investissements d'Avenir, IAIHU-06 (Paris Institute of Neurosciences – IHU), ANR-11-INBS-0006, Fondation d’Entreprise EDF, Biogen Inc., Fondation Thérèse and René Planiol, Fondation Saint Michel, Unrestricted support for Research on Parkinson’s disease from Energipole (M. Mallart) and Société Française de Médecine Esthétique (M. Legrand). Emma Biondetti received grant funding from France Parkinson and Biogen Inc. The authors would like to thank all the subjects who participated in this study.References
- Greffard S, Verny M, Bonnet, AM, et al. Motor Score of the Unified Parkinson Disease Rating Scale as a Good Predictor of Lewy Body–Associated Neuronal Loss in the Substantia Nigra. Arch Neurol. 2006;63(4):584-588
- Cheng HC, Ulane CM, Burke RE. Clinical progression in Parkinson disease and the neurobiology of axons. Ann. Neurol. 2010;67(6):715-725
- Schenck CH, Boeve BF, Mahowald MW. Delayed emergence of a parkinsonian disorder or dementia in 81% of older men initially diagnosed with idiopathic rapid eye movement sleep behavior disorder: A 16-year update on a previously reported series. Sleep Med. 2013;14(8):744-748
- Zecca L, Zucca FA, Wilms H, et al. Neuromelanin of the substantia nigra: a neuronal black hole with protective and toxic characteristics. Trends Neurosci. 2003;26(11):578-580
- Sulzer D, Cassidy C, Horga G, et al. Neuromelanin detection by magnetic resonance imaging (MRI) and its promise as a biomarker for Parkinson’s disease. npj Park Dis. 2018;4(1):1-11
- Zucca FA, Segura-Aguilar J, Ferrari E, et al. Interactions of iron, dopamine and neuromelanin pathways in brain aging and Parkinson’s disease. Prog Neurobiol. 2017;155:96-119
- Hare DJ, Double KL. Iron and dopamine: A toxic couple. Brain. 2016;139(4):1026-1035
- Martín-Bastida A, Lao-Kaim NP, Roussakis, AA, et al. Relationship between neuromelanin and dopamine terminals within the Parkinson’s nigrostriatal system. Brain. 2019;142(7):2023-2036
- Kuya K, Ogawa T, Shinohara Y, et al. Evaluation of Parkinson’s disease by neuromelanin-sensitive magnetic resonance imaging and 123I-FP-CIT SPECT. Acta radiol. 2018;59(5):593-598
- Kuya K, Shinohara Y, Miyoshi F, et al. Correlation between neuromelanin-sensitive MR imaging and 123I-FP-CIT SPECT in patients with parkinsonism. Neuroradiology. 2016;58(4):351-356
- Isaias IU, Trujillo P, Summers P, et al. Neuromelanin imaging and dopaminergic loss in parkinson’s disease. Front Aging Neurosci. 2016;8(8):1-12
- Langley J, Huddleston DE, Chen X, et al. A multicontrast approach for comprehensive imaging of substantia nigra. Neuroimage. 2015;112:7-13
- Reimão S, Ferreira S, Nunes RG, et al. Magnetic resonance correlation of iron content with neuromelanin in the substantia nigra of early-stage Parkinson’s disease. Eur J Neurol. 2016;23(2):368-374
- Takahashi H, Watanabe Y, Tanaka H, et al. Comprehensive MRI quantification of the substantia nigra pars compacta in Parkinson’s disease. Eur J Radiol. 2018;109(5):48-56
- Langley J, Huddleston DE, Crosson B, et al. Multimodal assessment of nigrosomal degeneration in Parkinson’s disease. Park Relat Disord. 2020;80(6):102-107
- De La Fuente-Fernández R, Schulzer M, Kuramoto L, et al. Age-specific progression of nigrostriatal dysfunction in Parkinson’s disease. Ann Neurol. 2011;69(5):803-810
- Biondetti E, Gaurav R, Yahia-Cherif L, et al. Spatiotemporal changes in substantia nigra neuromelanin content in Parkinson’s disease. Brain. 2020;143(9):2757-2770
- Goetz CG, Tilley BC, Shaftman SR, et al. Movement Disorder Society-sponsored revision of the Unified Parkinson's Disease Rating Scale (MDS-UPDRS): scale presentation and clinimetric testing results. Mov Disord. 2008; 23(15):2129-70
- Mattis S. Dementia Rating Scale. Professional manual. Florida: Psychological Assessment Resources. 1988
- Mattis S, Bellak L, Karasu TB. Mental Status Examination for Organic Mental Syndrome in the Elderly Patient. Geriatric Psychiatry A Handbook for Psychiatrists and Primary Care Physicians. New York: Grune & Stratton. 1976
- Nasreddine ZS, Phillips NA, Bedirian V, et al. The Montreal Cognitive Assessment, MoCA: a brief screening tool for mild cognitive impairment. J Am Geriatr Soc. 2005;53(4):695-699
- Ardouin C, Chereau I, Llorca PM, et al. [Assessment of hyper- and hypodopaminergic behaviors in Parkinson's disease]. Rev Neurol (Paris). 2009;165(11):845-856
- Liu T, Wisnieff C, Lou M, et al. Nonlinear formulation of the magnetic field to source relationship for robust quantitative susceptibility mapping. Magn Reson Med. 2013;69(2):467-476
- Liu T, Khalidov I, de Rochefort L, et al. A novel background field removal method for MRI using projection onto dipole fields (PDF). NMR Biomed. 2011;24(9):1129-1136
- de Rochefort L, Brown R, Prince MR, et al. Quantitative MR susceptibility mapping using piece-wise constant regularized inversion of the magnetic field. Magn Reson Med. 2008;60(4):1003-1009
- Straub S, Schneider TM, Emmerich J, et al. Suitable reference tissues for quantitative susceptibility mapping of the brain. Magn Reson Med. 2017;78(1):204–214
- Haber SN. The place of dopamine in the cortico-basal ganglia circuit. Neuroscience. 2014;282:248-57
- O'Brien JT, Colloby S, Fenwick J, et al. Dopamine transporter loss visualized with FP-CIT SPECT in the differential diagnosis of dementia with Lewy bodies. Arch Neurol. 2004;61(6):919-25
- Yelnik J, Bardinet E, Dormont D, et al. A three-dimensional, histological and deformable atlas of the human basal ganglia. I. Atlas construction based on immunohistochemical and MRI data. Neuroimage. 2007; 34(2):618-638
- Bardinet E, Bhattacharjee M, Dormont D, et al. A three-dimensional histological atlas of the human basal ganglia. II. Atlas deformation strategy and evaluation in deep brain stimulation for Parkinson disease. J Neurosurg. 2009;110(2):208-19
Figures
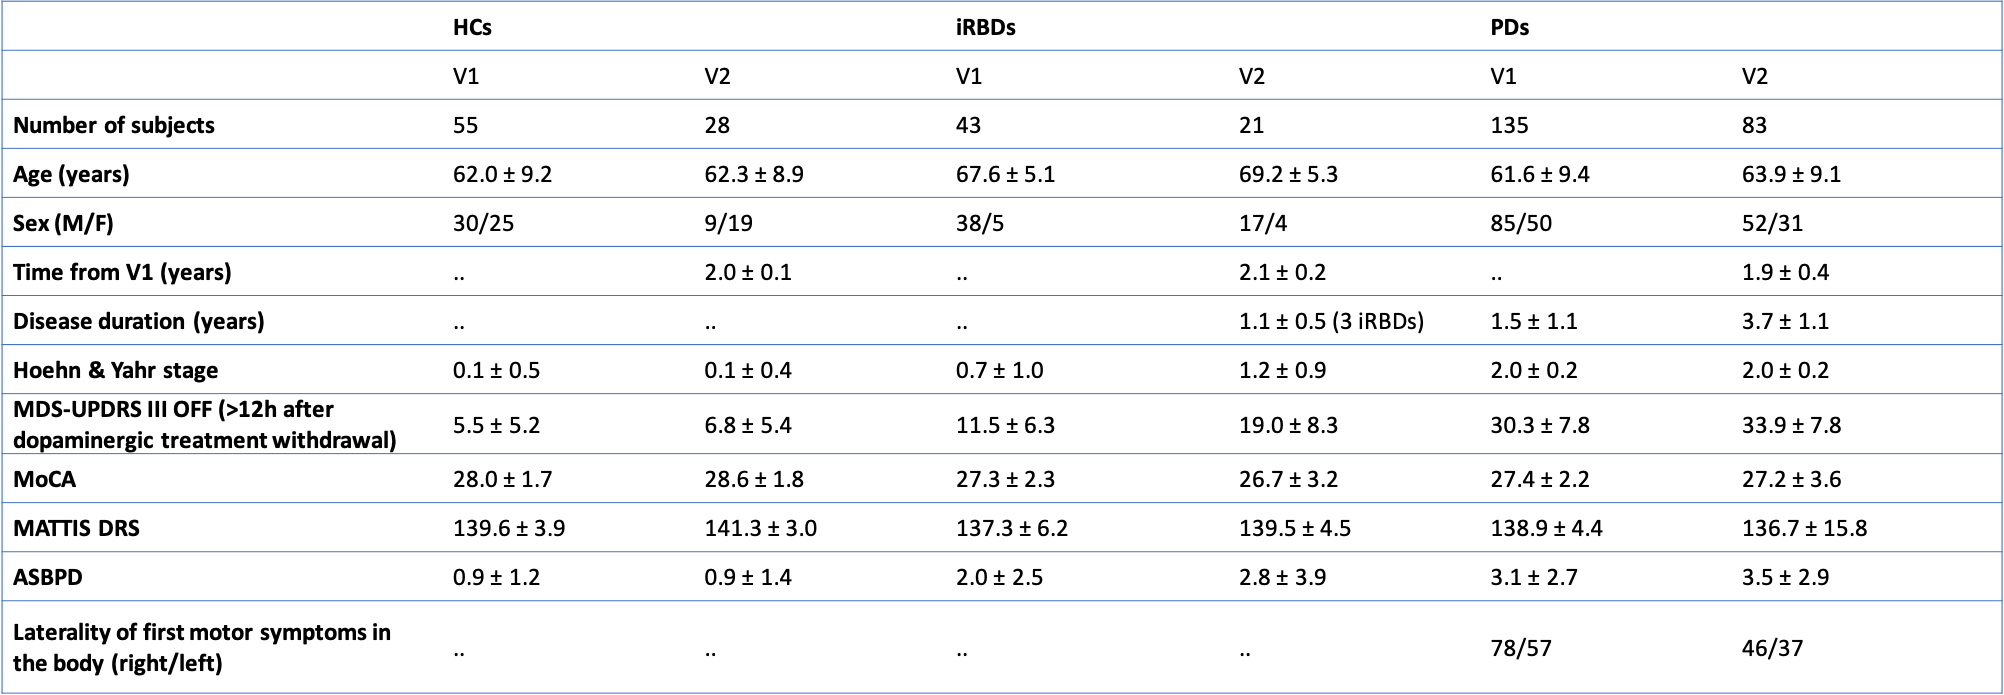
Table 1: Demographical and clinical characteristics of
the cohort. Values are means ± standard deviations. V1/V2 = visit one or
two; HCs = healthy control subjects; iRBDs = iRBD patients; PDs = Parkinson’s
disease patients; MDS-UPDRS = Movement Disorder Society unified Parkinson’s
disease rating scale; MoCA = Montréal cognitive assessment score; MATTIS DRS =
Mattis’ dementia rating scale; ASBPD = Ardouin’s scale for behaviour in PD
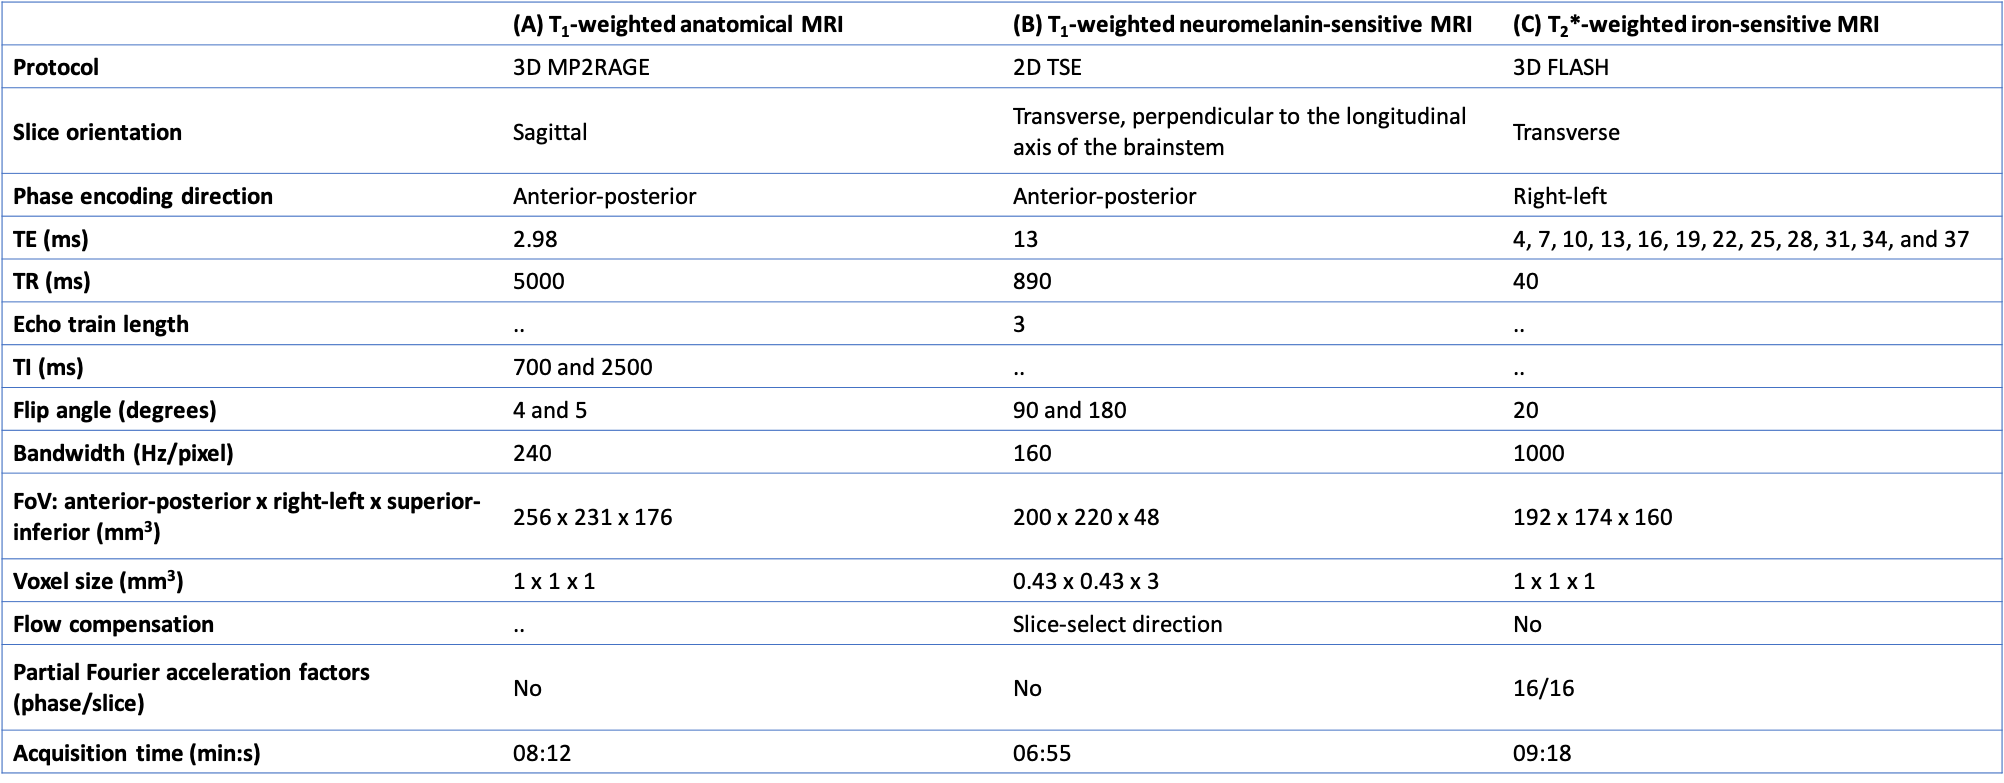
Table 2: MRI protocols. The table shows the T1-weighted
3D MP2RAGE (A) protocol for whole-brain anatomical reference, T1-weighted
2D TSE protocol for NM-sensitive imaging of the SNc (B) and the T2*-weighted
3D FLASH protocol for iron-sensitive imaging of the SNc (C). MP2RAGE=magnetization prepared two rapid
acquisition gradient echoes. TSE=turbo spin echo; FLASH=fast low angle shot;
TE=echo time; TR=repetition time; TI=inversion time; FoV=field of view
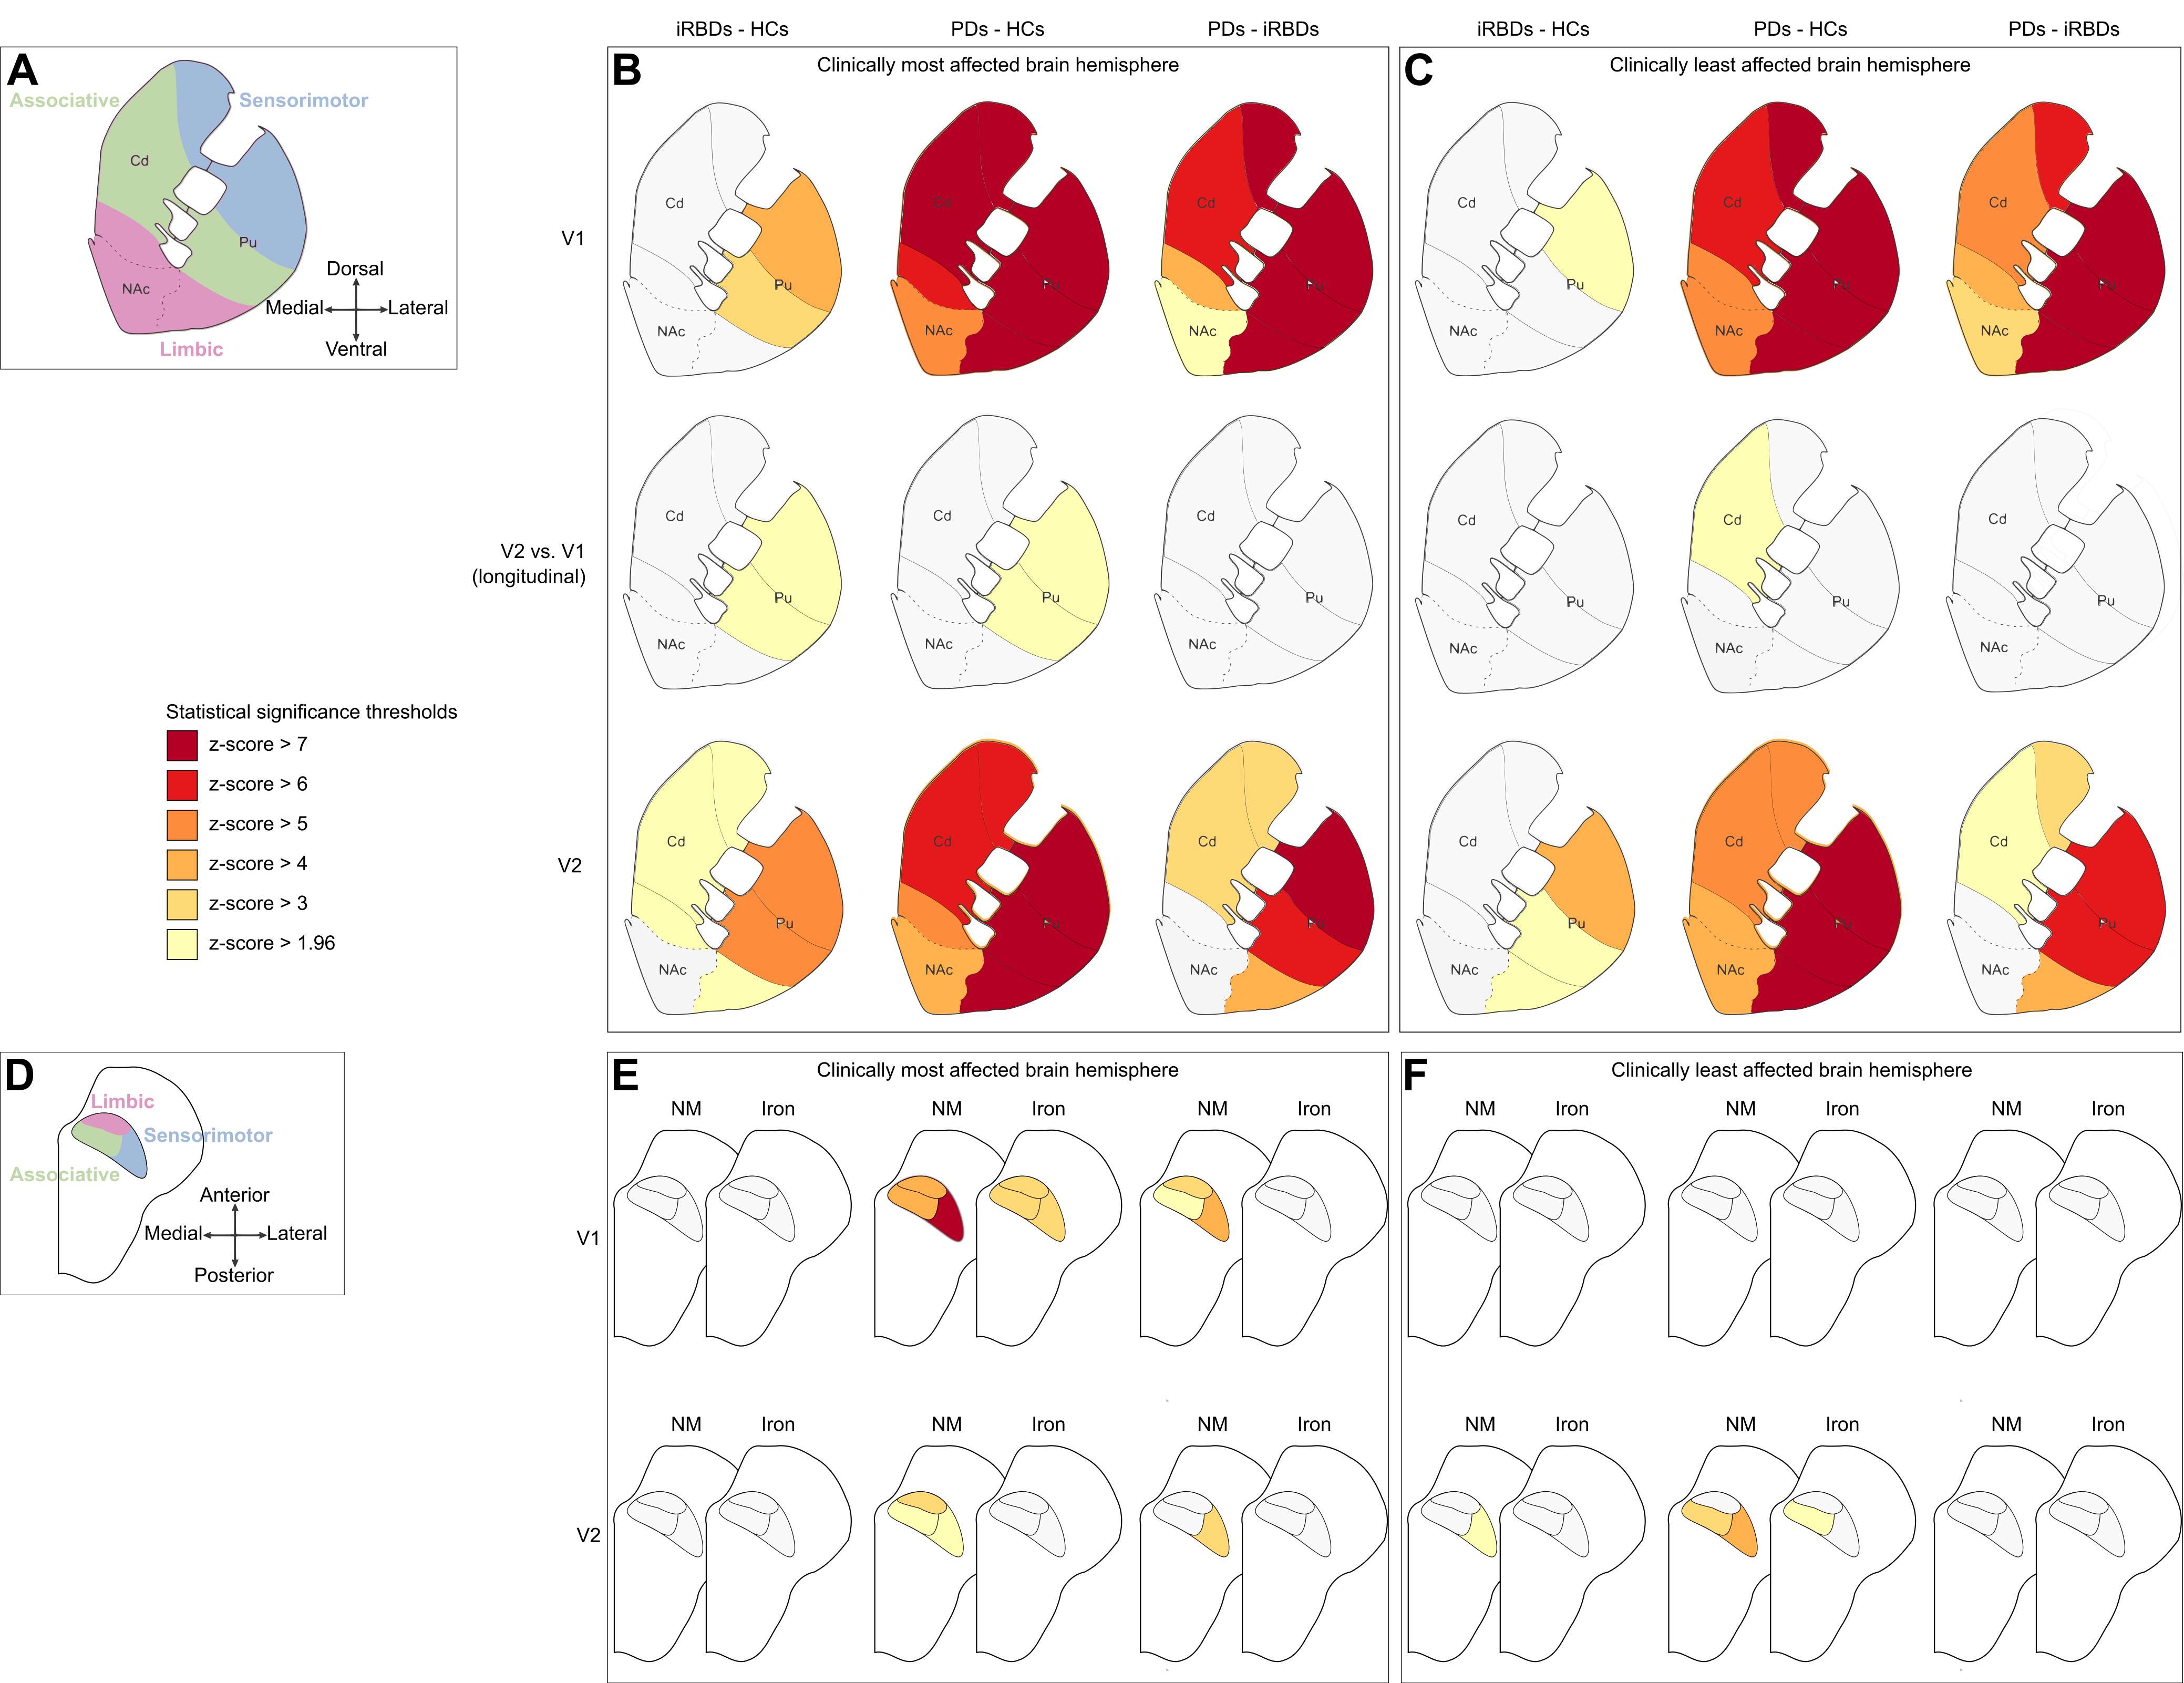
Figure 1: Group differences in striatal DaT and SNc NM
and iron levels. Functional subregions in the striatum (A) and the
SNc (D). The panels show the results of the statistical comparison
between groups in the clinically most (B, E) and least affected brain
hemispheres (C, F). Each panel shows the inter-group comparison between
iRBDs and HCs (left column), PDs and HCs (centre column), or PDs and iRBDs
(right column). P-values were converted into z-scores
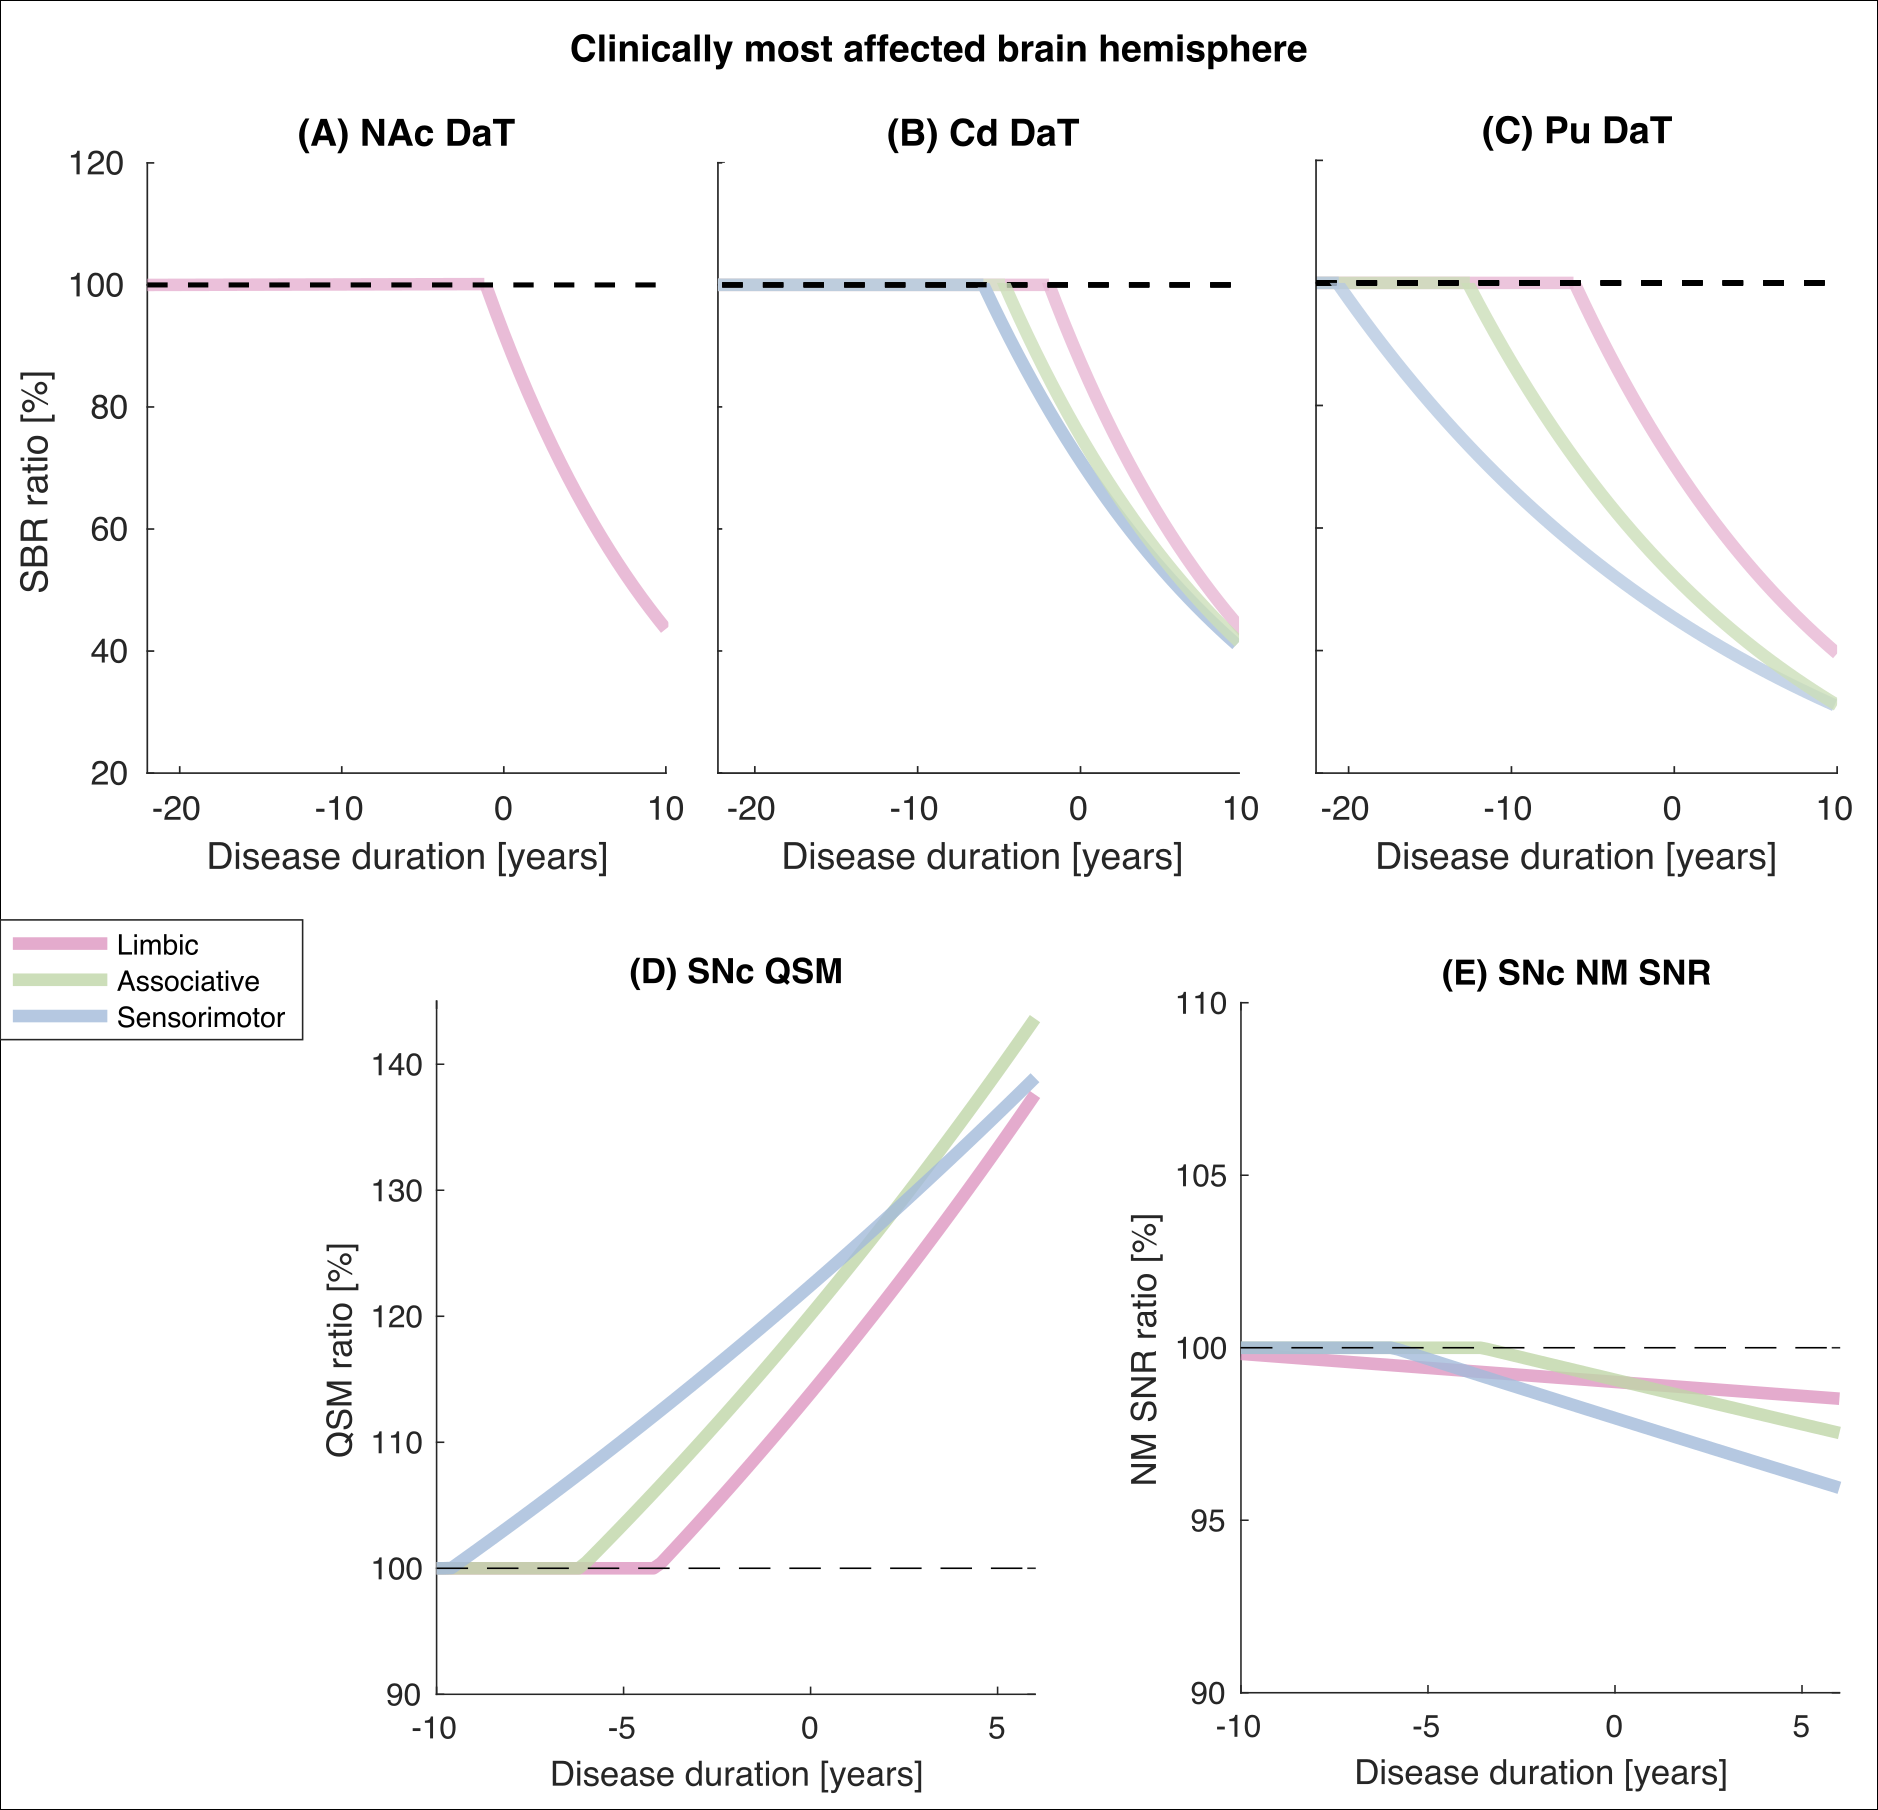
Figure 2: Change over disease duration in striatal DaT,
SNc NM and SNc iron in PDs relative to HCs. For all PDs relative to HCs, in
each functional subregion of the striatum (A-C) and SNc (D, E) in
the most affected brain hemisphere, the mono-exponential fitting functions for the
percent ratios of DaT striatal binding ratio (SBR), NM SNR and QSM are plotted
against disease duration
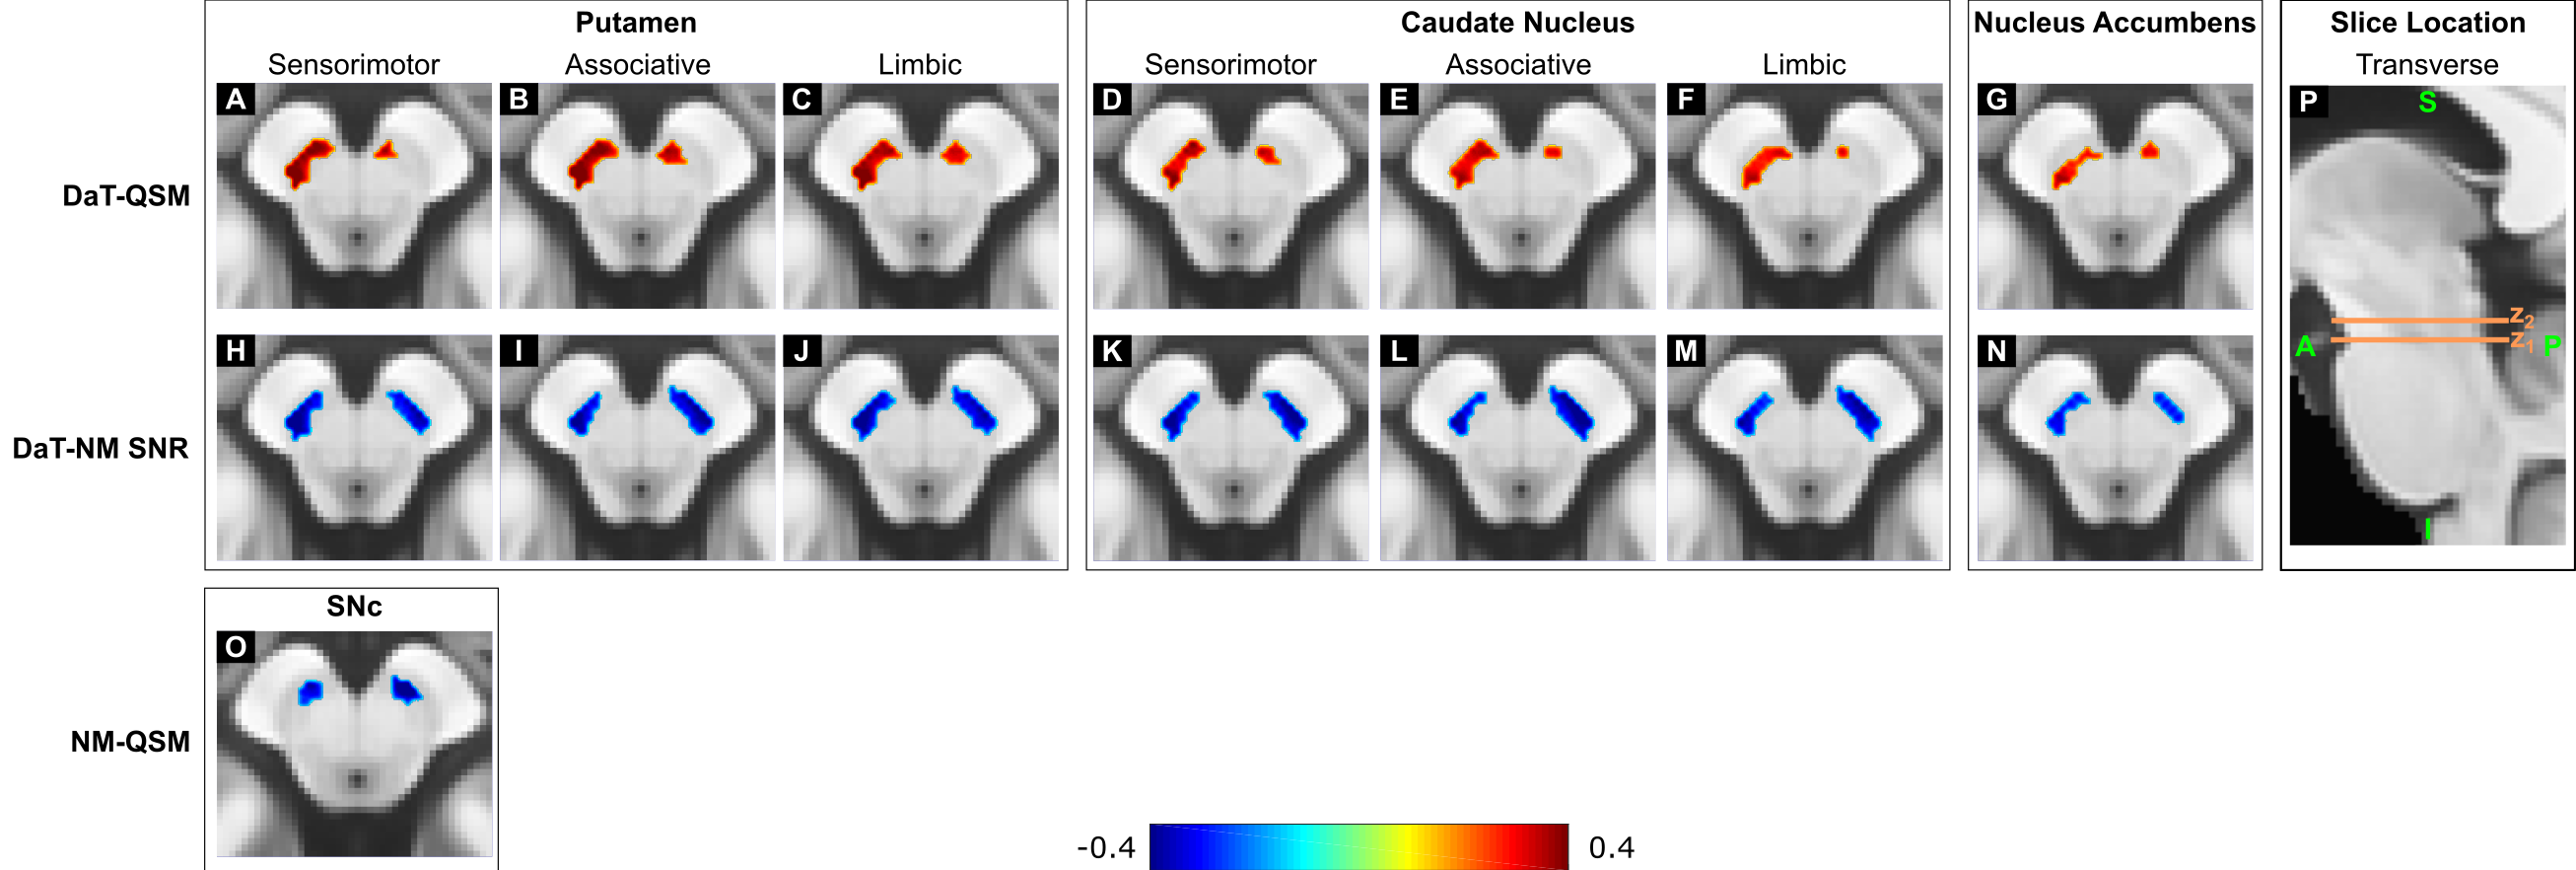
Figure 3: Voxel-wise spatial correlation patterns between
striatal DaT, SNc NM and SNc iron. One representative transverse slice (z1
or z2) of the DaT-NM (A-G), DaT-QSM (H-N) and NM-QSM (O)
is shown overlaid on the brain template. In each image, the brain template is
displayed using the same intensity range in arbitrary units. The side panel
shows the locations of the transverse slices (P). In the transverse slices, the most affected
brain hemisphere is always shown on the left side of the image