0539
Twelve-Year Microstructural Changes in The Deep Gray Nuclei in Parkinson’s Disease: A Serial Diffusion Tensor Imaging Study1Department of Diagnostic Radiology, Singapore General Hospital, Singapore, Singapore, 2Duke-NUS Medical School, Singapore, Singapore, 3Department of Neurology, National Neuroscience Institute (Outram-campus), Singapore, Singapore, 4Health Services Research Unit, Singapore General Hospital, Singapore, Singapore
Synopsis
Diffusion tensor imaging (DTI) characterizes microstructural changes in the basal ganglia in relation to idiopathic Parkinson's disease (PD). However, inconsistent results due to short-interval longitudinal studies with heterogeneous neuropathology across PD stages have been reported. We elucidated microstructural changes in the deep gray nuclei throughout the disease course in a large, prospective, three time-point case-control DTI study in PD over twelve years, with six-year interval gaps. Increased mean striatal diffusivity reflected progressive neurodegeneration, whereas factional anisotropy changes suggested effects of abnormal iron accumulation followed by neuronal loss in the putamen and thalamus as the disease progresses into the late stages.
Introduction
The deep gray nuclei in the basal ganglia emerges as the main therapeutic target in patients with idiopathic Parkinson’s disease (PD). Diffusion tensor imaging (DTI) enables the characterization of microstructural changes in this region1. However, the findings of striatal integrity were heterogenous, suggesting diverse disease presentations at different stages of PD2. There is a paucity of prospective longitudinal DTI studies investigating the neuropathology in relation to PD progression, with limited follow-up periods of up to 6 years2. Comprehensive, serial elucidation of neuropathological changes across disease progression in PD beyond a decade span are wanting. We performed a multivariate linear mixed-effects model to investigate serial DTI changes in the deep gray nuclei (i.e., caudate, putamen, globus pallidus, and thalamus) at three time points (TPs) 6 years apart. We hypothesized that progressive deep gray nuclear neuropathology begins in the striatum at the early-stage of PD and extend to the thalamus in the later stages due to secondary neurodegeneration.Methods and Materials
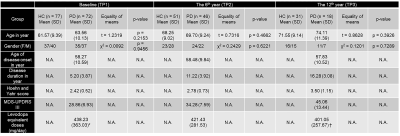
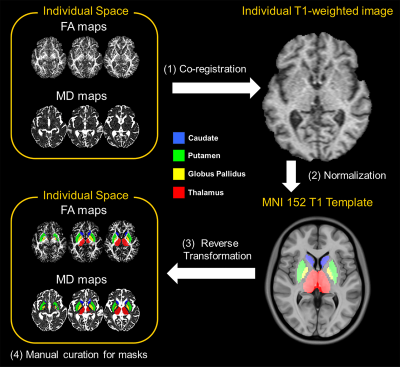
Seventy-two patients clinically diagnosed with mild or moderate PD were first recruited by a movement disorders expert neurologist according to the UK PD Brain Bank criteria, together with seventy-seven age- and gender-matched healthy controls (HC). The demographic and clinical information over the 12-year study period were tabulated in Table 1. All brain MRI scans were conducted on the same 1.5T MAGNETOM scanner (Siemens Avanto, Erlangen, Germany) using a standardized protocol, taking care to scan the patients in their “on” stage to reduce motion, and including a high-resolution DTI sequence with the following parameters (TR/TE=4300/90 ms, b-value=0/800 s/mm2, diffusion directions=12, NEX=4, slice number=27, slice thickness=4 mm, in-plane resolution=1.2x1.2 mm2, matrix=192x192, FOV=23x23 cm2) and structural T1-weighted magnetization-prepared rapid gradient-echo (MPRAGE) sequences. All DTI datasets were used to produce fractional anisotropy (FA) and mean diffusivity (MD) DTI metrics. The regions of interest (ROIs) were segmented on FA and MD maps via a semi-automated pipeline (Fig. 1): (1) individual DTI maps were registered to T1 MPRAGE image via a transformation matrix between the b0 and MPRAGE images; (2) the individual T1 MPRAGE images were normalized to the Montreal Neurological Institute 152 template through the Symmetric image Normalization method3 (SyN); (3) eight ROIs obtained from the Harvard-Oxford subcortical structures atlas4 were automatically projected onto the individual diffusion maps using the SyN method; finally (4) each segmented nucleus was manually curated to reduce partial volume effects from voxel bleeding into adjacent white matter or CSF, and the resulting masks used to sample DTI metrics for each subject. Extracted DTI metrics of left and right ROIs were averaged. A multivariate linear mixed-effects regression model was employed to assess between-group differences in DTI metrics at each TP. In addition, the univariate linear mixed-effects regression model was used to separately predict clinical scores of motor symptoms from FA or MD of deep gray nuclei.Results
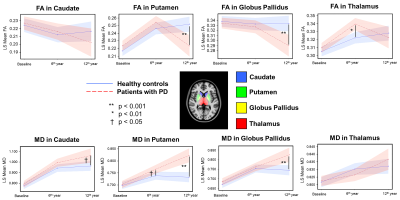
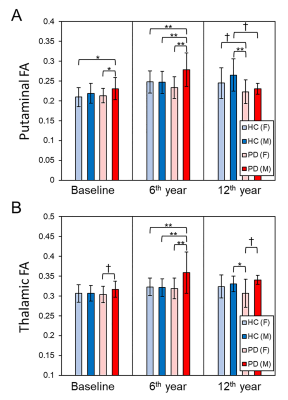
Demographics: No significant difference in either age or gender between patients and controls at each TP was found. However, there were significant differences in the modified Hoehn and Yahr staging (H&Y) score and Movement-Disorder-Society version of Unified-Parkinson-Disease-Rating-Scale part-3 (MDS-UPDRS III) across the three TPs in patients (Table 1).Microstructural Changes of Deep Gray Nuclei: There were no differences in FA and MD in any nucleus between patients and controls at baseline. After 6 years, increased FA in the thalamus and increased MD in the putamen were observed in patients. After 6 more years, decreased FA in the putamen and globus pallidus and increased MD in the caudate, putamen, and globus pallidus were observed in patients (Fig. 2). We also found gender-related differences within the patient group only, with higher FA in men than women in the thalamus for all TPs and putamen at baseline and 2nd TP (Fig. 3).
Relationships with Clinical Variables: The univariate linear mixed-effects model without correction for multiple tests only revealed associations of H&Y score with the mean FA of the left caudate (coefficient=0.003, p = 0.014) and mean MD in the left putamen (coefficient=0.001, p=0.047).
Discussion
We demonstrated in our case-control DTI study in PD spanning over a decade on the same 1.5T unit that nigral deficit in PD5 first led to putaminal neuronal degeneration (given increases in MD) and either abnormal thalamic iron accumulation6 or selective demyelination with α-synuclein aggregates7 (given increases in FA), before progression to widespread deep gray nuclear neuronal degeneration in the late stages (Fig. 2). In terms of gender differences in iron deposition8, our findings suggested that the male PD patients could be more susceptible to iron accumulation in the putamen and thalamus8 and/or underwent greater functional re-organization9 in the basal ganglia circuitry in these nuclei secondary to dopaminergic deafferentation. The temporal DTI changes in the putamen and caudate in relation to clinical H&Y staging support the Braak theory in part10, as the nigral deficit mainly affects the dorsal striatum via the lateral nigrostriatal projections11.Conclusion
Our longitudinal study showed the utility of DTI in differentiating PD and controls on deep gray nuclei changes only after a decade. Future work should consider iron deposition effects in both disease and aging, besides potential gender effects when using DTI in PD.Acknowledgements
No acknowledgement found.References
1. Kim HJ, Kim SJ, Kim HS, Choi CG, Kim N, Han S, Jang EH, Chung SJ and Lee CS. Alterations of mean diffusivity in brain white matter and deep gray matter in Parkinson's disease. Neurosci Lett. 2013; 550:64-68.
2. Sarasso E, Agosta F, Piramide N and Filippi M. Progression of grey and white matter brain damage in Parkinson's disease: a critical review of structural MRI literature. J Neurol. 2020.
3. Avants BB, Epstein CL, Grossman M and Gee JC. Symmetric diffeomorphic image registration with cross-correlation: evaluating automated labeling of elderly and neurodegenerative brain. Med Image Anal. 2008; 12(1):26-41.
4. Desikan RS, Ségonne F, Fischl B, Quinn BT, Dickerson BC, Blacker D, Buckner RL, Dale AM, Maguire RP, Hyman BT, Albert MS and Killiany RJ. An automated labeling system for subdividing the human cerebral cortex on MRI scans into gyral based regions of interest. Neuroimage. 2006; 31(3):968-980.
5. Chan LL, Rumpel H, Yap K, Lee E, Loo HV, Ho GL, Fook-Chong S, Yuen Y and Tan EK. Case control study of diffusion tensor imaging in Parkinson's disease. J Neurol Neurosurg Psychiatry. 2007; 78(12):1383-1386.
6. Pfefferbaum A, Adalsteinsson E, Rohlfing T and Sullivan EV. Diffusion tensor imaging of deep gray matter brain structures: effects of age and iron concentration. Neurobiol Aging. 2010; 31(3):482-493.
7. Budde MD and Frank JA. Neurite beading is sufficient to decrease the apparent diffusion coefficient after ischemic stroke. Proc Natl Acad Sci U S A. 2010; 107(32):14472-14477.
8. Bartzokis G, Tishler TA, Lu PH, Villablanca P, Altshuler LL, Carter M, Huang D, Edwards N and Mintz J. Brain ferritin iron may influence age- and gender-related risks of neurodegeneration. Neurobiol Aging. 2007; 28(3):414-423.
9. Péran P, Cherubini A, Assogna F, Piras F, Quattrocchi C, Peppe A, et al. Magnetic resonance imaging markers of Parkinson's disease nigrostriatal signature. Brain 2010;133(11):3423-3433.
10. Braak H, Del Tredici K, Rüb U, de Vos RA, Jansen Steur EN and Braak E. Staging of brain pathology related to sporadic Parkinson's disease. Neurobiol Aging. 2003; 24(2):197-211.
11. Scherfler C, Seppi K, Mair KJ, Donnemiller E, Virgolini I, Wenning GK and Poewe W. Left hemispheric predominance of nigrostriatal dysfunction in Parkinson’s disease. Brain. 2012; 135(11):3348-3354.
Figures

TABLE 1. Demographics of study groups.
Note .— *70 of 72 patients at TP1, and †16 of 18 patients at TP3 were treated by levodopa. HC = Healthy Control, PD = Parkinson’s Disease, TP = Time Point, MDS-UPDRS = Movement Disorder Society version of United Parkinson Disease Rating Scale.


