0530
Motion Analysis in Fetal MRI using Deep Pose Estimator1Department of Electrical Engineering and Computer Science, Massachusetts Institute of Technology, Cambridge, MA, United States, 2Fetal-Neonatal Neuroimaging and Developmental Science Center, Boston Children’s Hospital, Boston, MA, United States, 3Computer Science and Artificial Intelligence Laboratory, Massachusetts Institute of Technology, Cambridge, MA, United States, 4Harvard Medical School, Boston, MA, United States, 5Massachusetts Institute of Technology, Cambridge, MA, United States
Synopsis
Fetal motion is an important measure for monitoring fetal health and neurological function. However, current clinical MRI and ultrasound assessments of fetal motion are qualitative and cannot reflect detailed 3D motion of each body part. In this work, we propose a method for fetal motion analysis in MRI using a deep pose estimator. We train a neural network to estimate fetal pose from MR volumes, and extract quantitative metrics of motion from the time series of fetal pose. In the experiments, we study how different conditions affect fetal motion, such as gestational age and maternal position during scan.
Introduction
Magnetic resonance imaging (MRI) is used in clinical practice to diagnose structural fetal disorders in pregnancy but is limited by fetal motion. At the same time, fetal motion is an important measure of neurological function, informing postnatal outcomes. However, current clinical MR and ultrasound assessments of fetal motion are qualitative, time-intensive and can only capture the complex 3D motion of all body parts simultaneously in early gestation [1]. Better assessment of fetal neurological health requires novel tools to automatically and efficiently obtain metrics that characterize 3D fetal whole-body motion throughout pregnancy. In this abstract, we adopted a recently proposed deep learning method for fetal pose estimation from volumetric MR images and compute quantitative metrics based on estimated pose for motion analysis.Methods
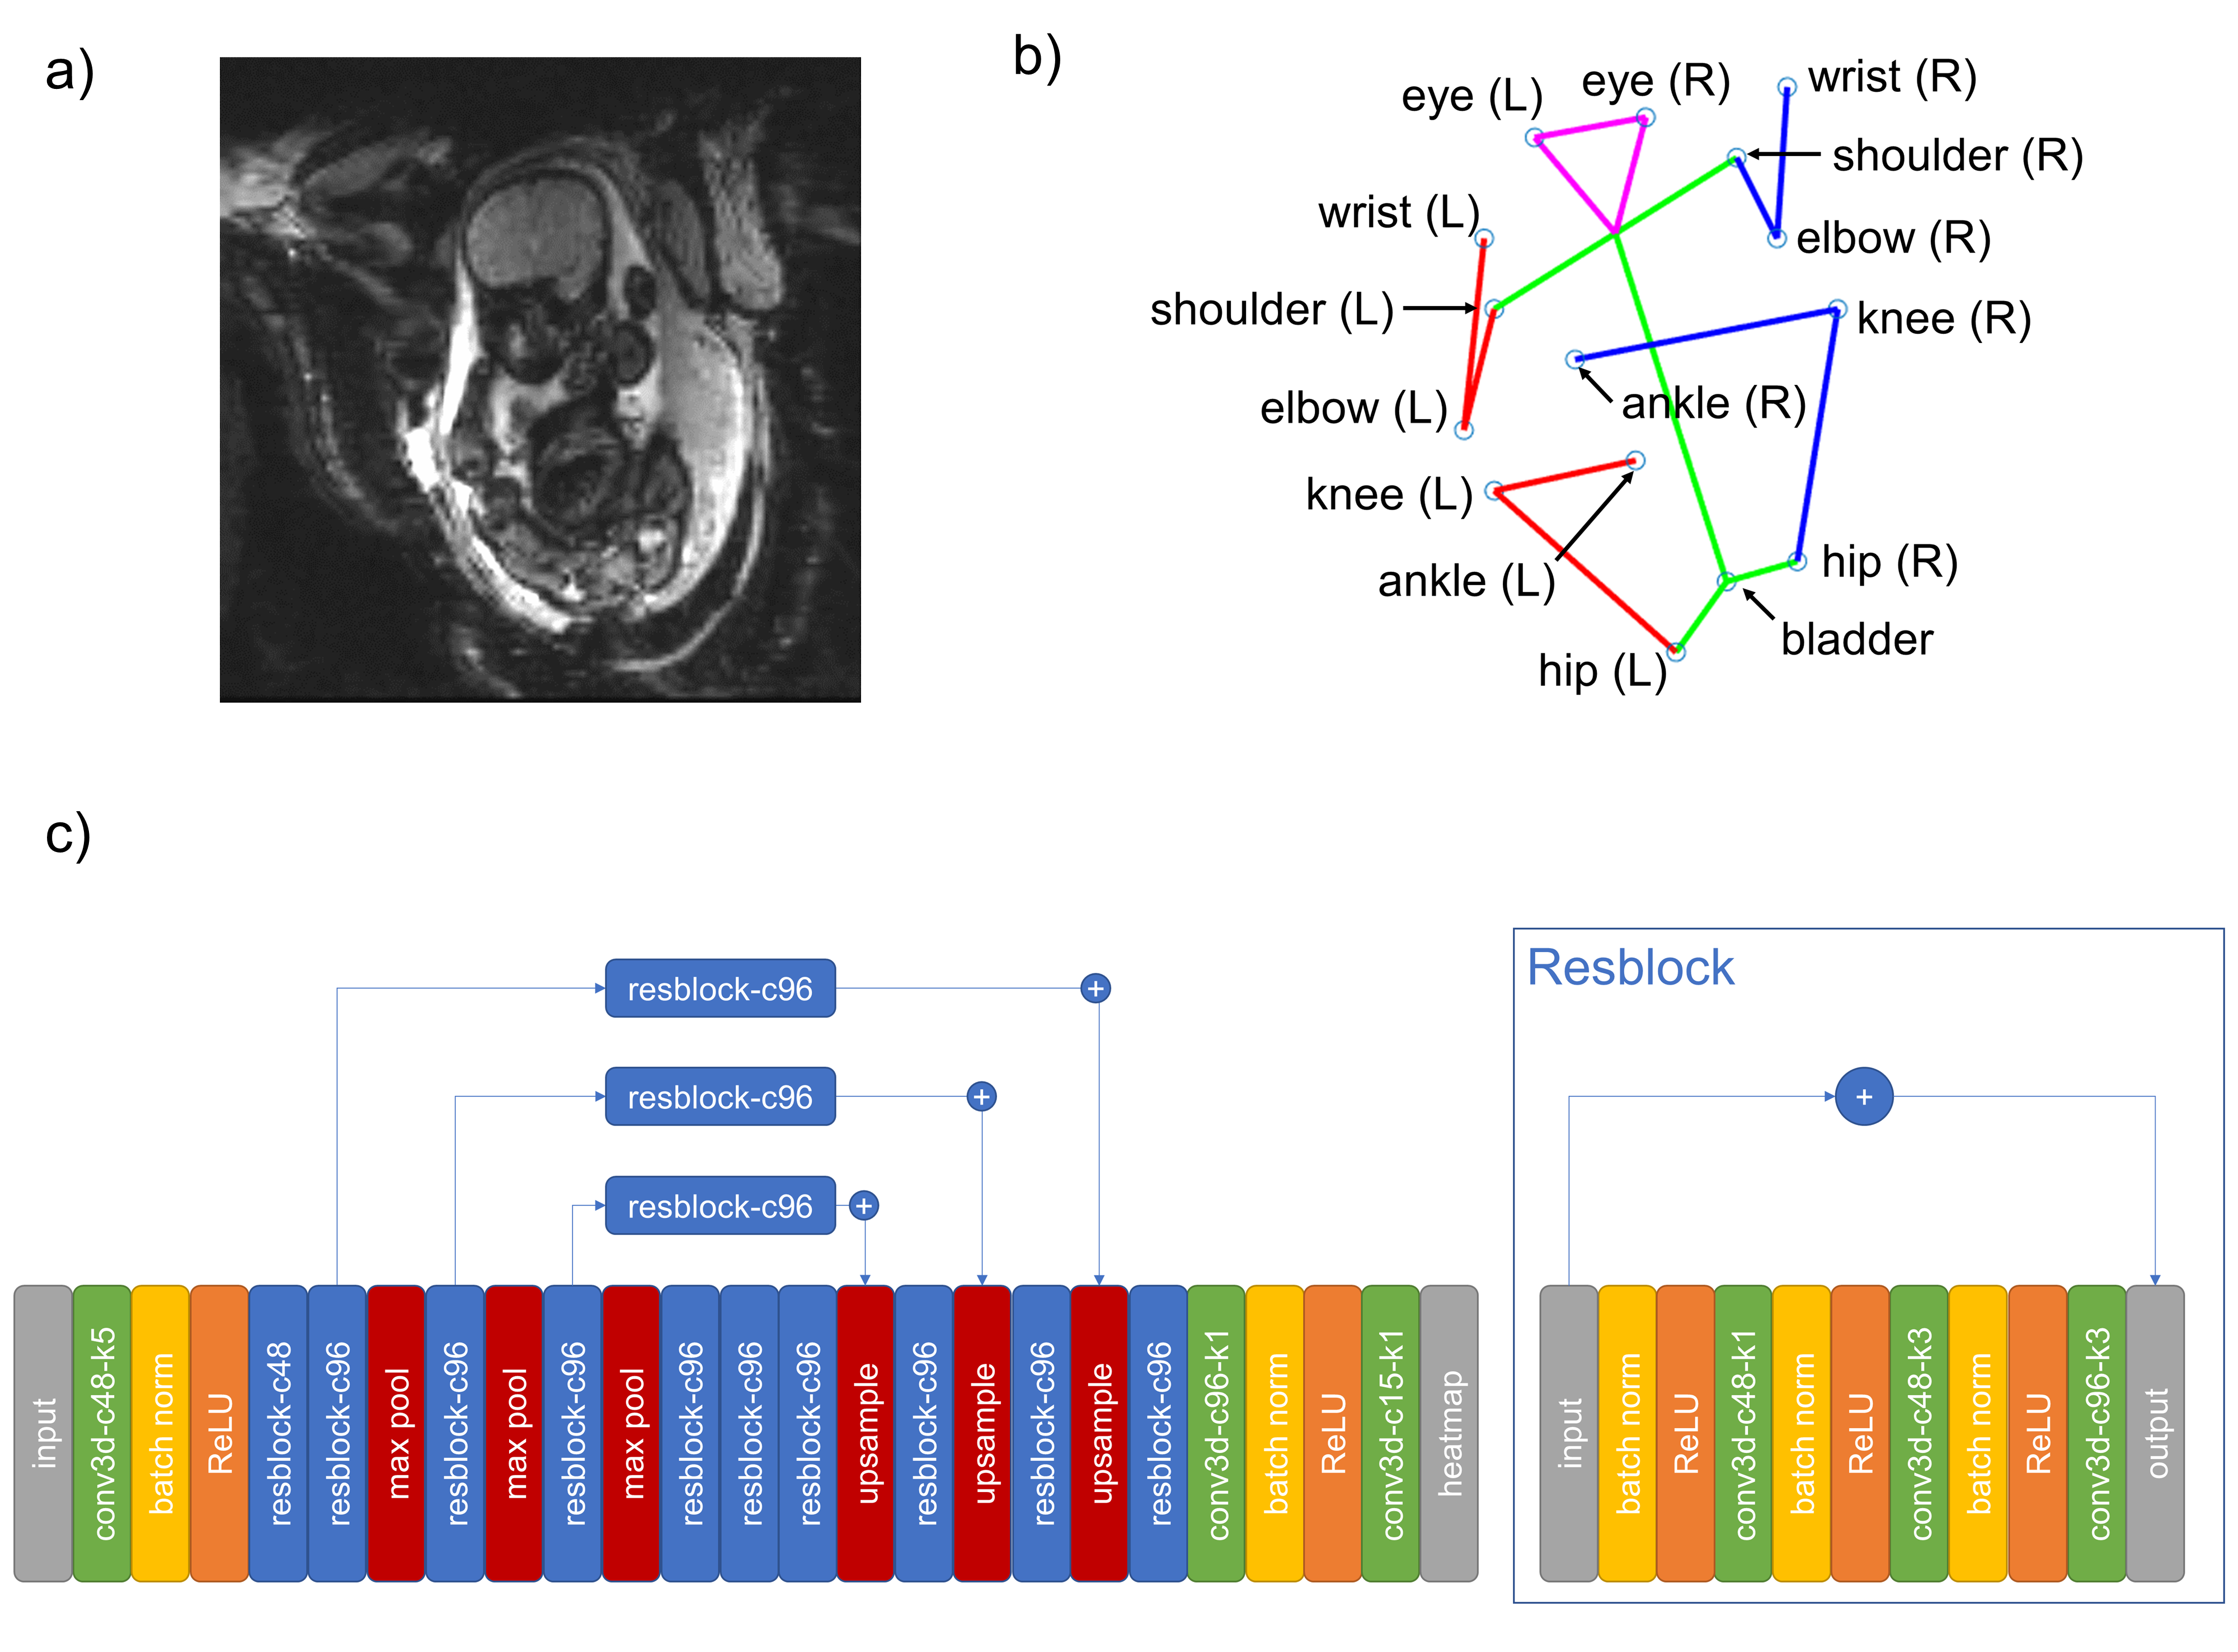
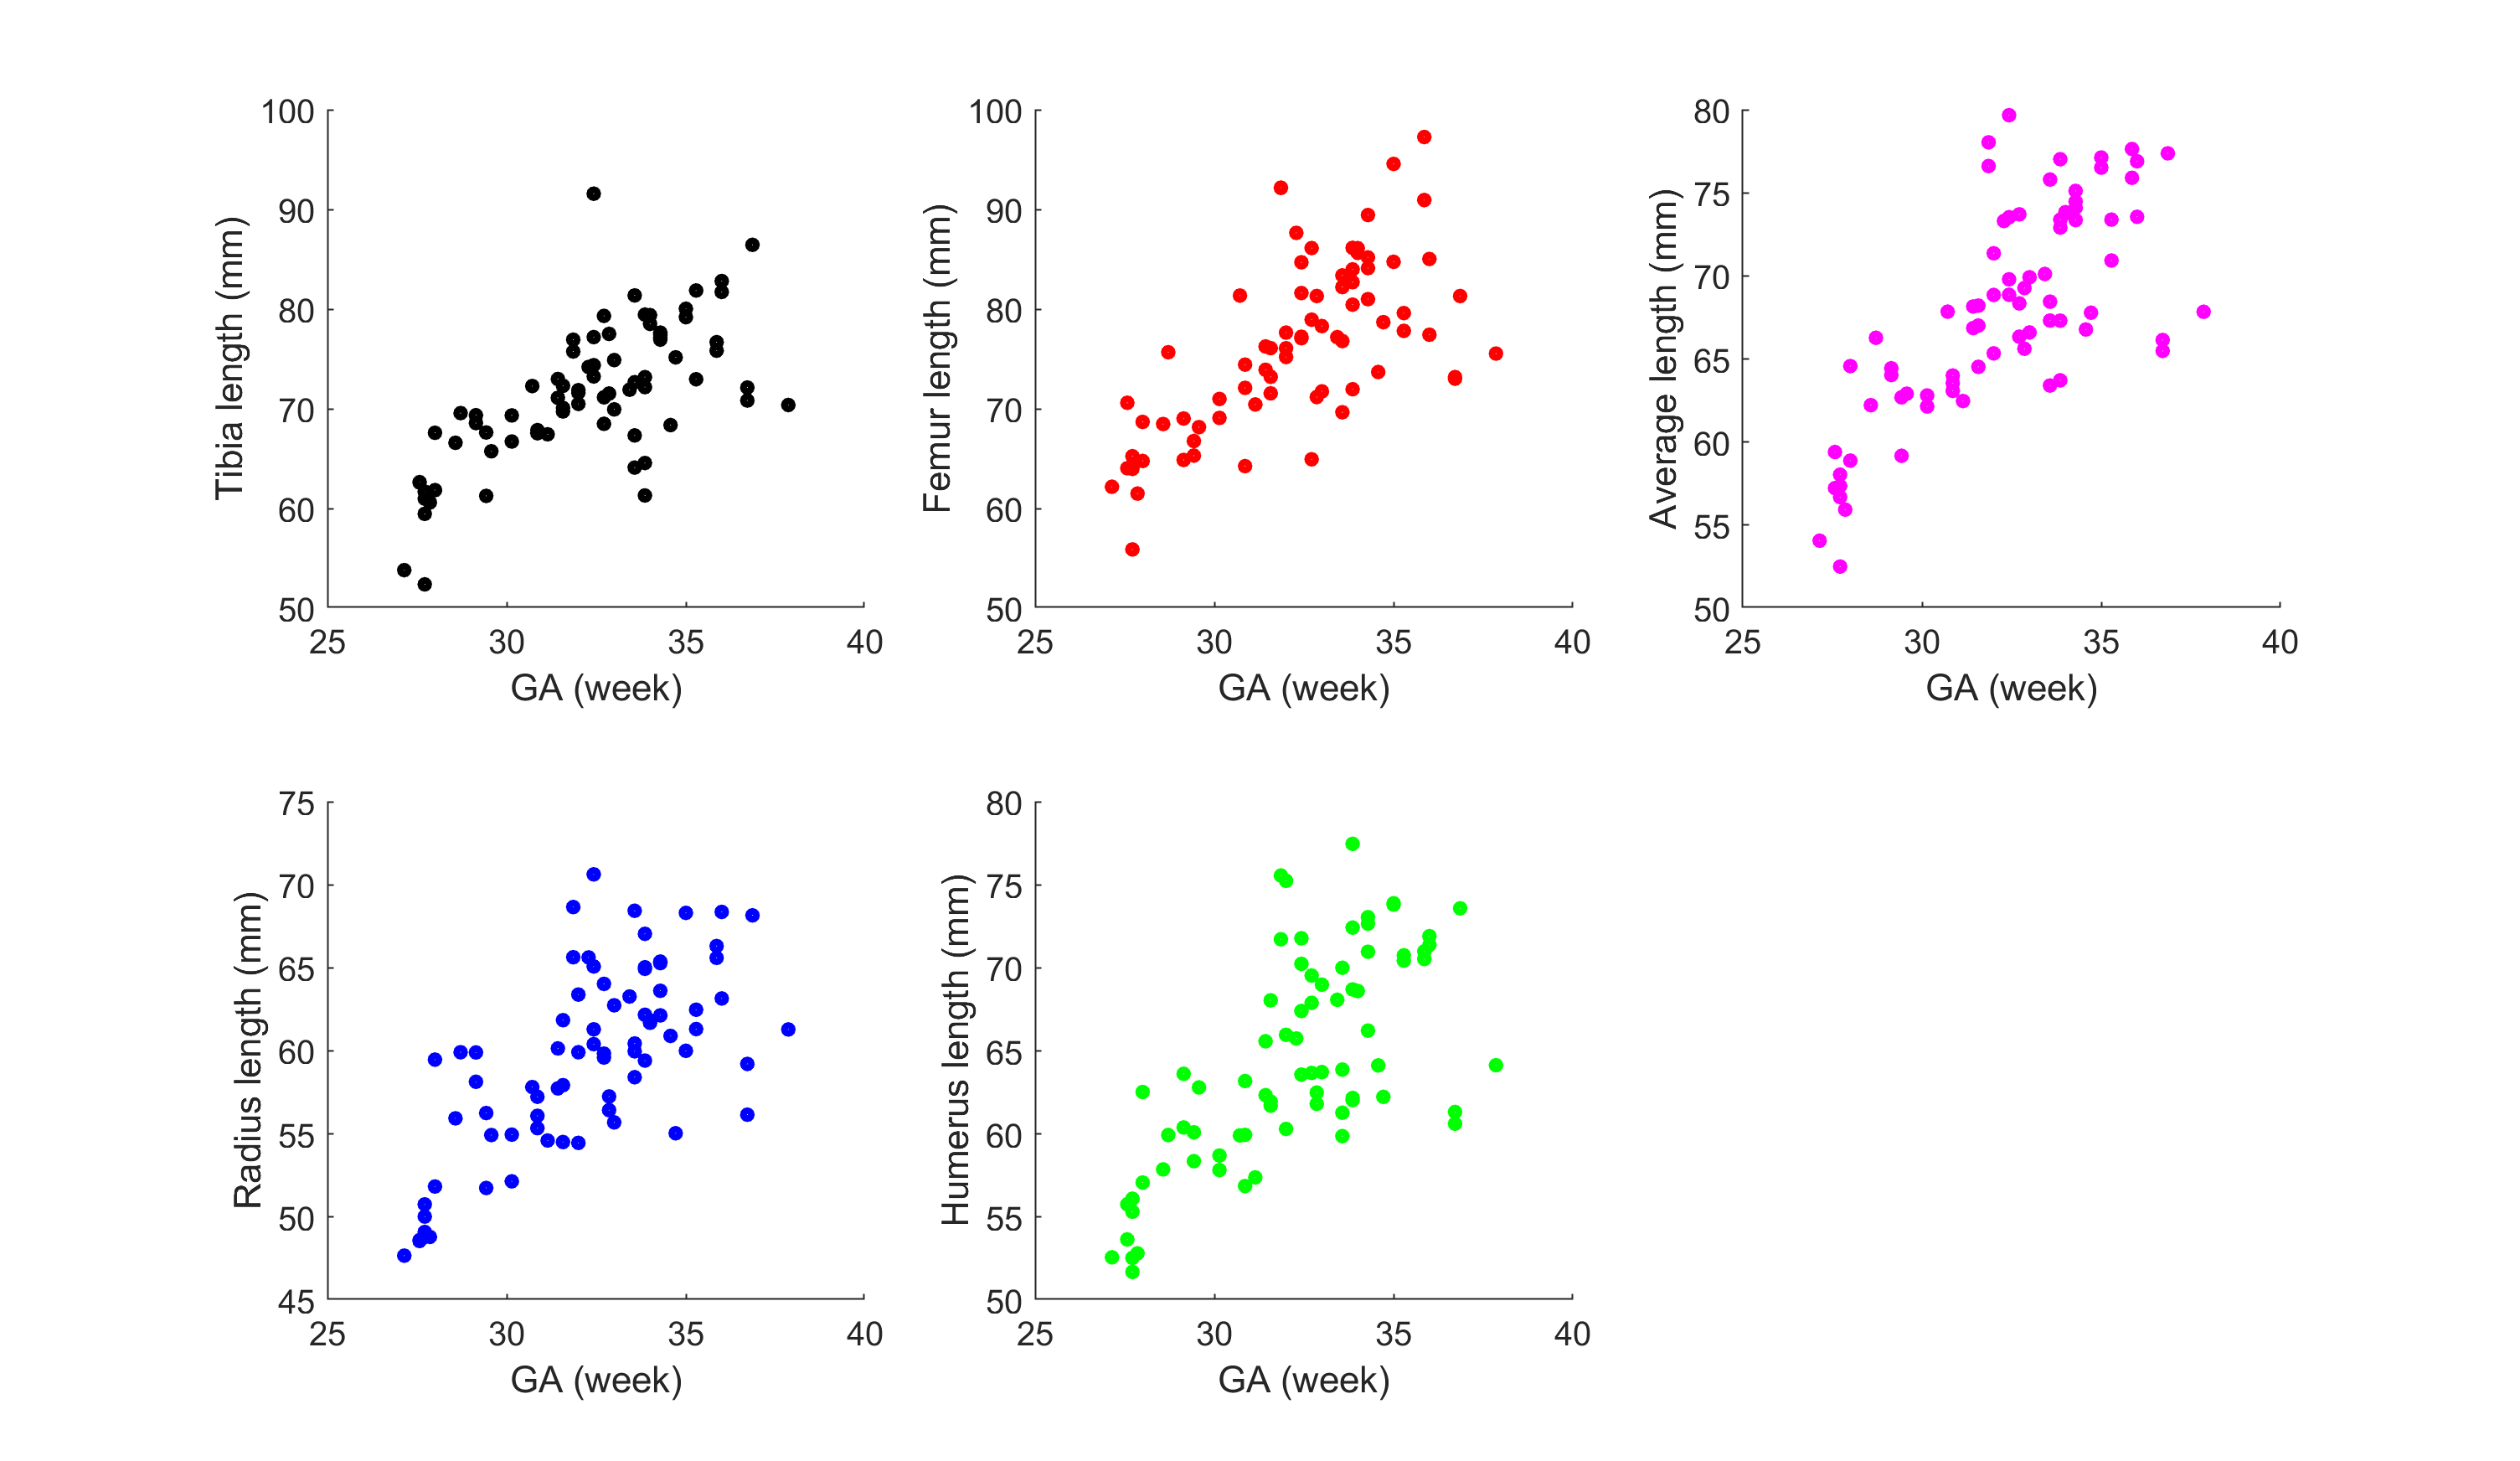
Multi-slice EPI data with matrix size of 120*120*80, resolution of 3mm*3mm*3mm, TR of 3.5s and scan duration from 10 to 30 minutes, were acquired of the pregnant abdomen for fetuses of gestational age 25 to 35 weeks, resulting in a dataset with 77 MR time series and 19,816 3D volumes. Fifteen keypoints (ankles, knees, hips, bladder, shoulders, elbows, wrists and eyes) were chosen as landmarks to define the pose of the fetus [2]. An example of the fetal MRI data and the corresponding keypoint labels are shown in Fig. 1 a and b respectively. In the dataset, 1705 volumes are randomly selected and manually annotated as training set under the instruction of radiologists. We train a 3D Unet based [3] convolution neural network (CNN) for 3D fetal pose estimation [4] on this training set (Fig. 1 c). The trained CNN is then applied to the unlabeled dataset to predict fetal pose.For pre-processing of fetal pose, we normalize each fetal pose by the average bone length to remove the effect of fetal growth at different gestational ages, where the average bone length is defined as the average length of tibia, femur, radius and humerus of each subject (Fig. 2). To compensate for maternal motion, we adopt the fetal coordinate system instead of the scanner coordinate system.
To quantify fetal motion, we introduce three motion metrics: the averaged standard deviation of all keypoint locations, $$$\sigma_{kp}$$$, the standard deviation of the angle between tibia and femur, $$$\sigma_{knee}$$$, and the standard deviation of the angle between radius and humerus, $$$\sigma_{elbow}$$$. The definitions of the three metrics are as follows.
$$\sigma_{kp}=\frac{1}{J}\sum_{j=1}^J\sqrt{\frac{1}{N-1}\sum_{i=1}^N||p_j^{(i)}-\bar{p}_j||_2^2}$$
$$\sigma_{knee}=\frac{1}{2}(\sqrt{\frac{1}{N-1}(\theta_{left,knee}^{(i)}-\bar{\theta}_{left,knee})^2 }+\sqrt{\frac{1}{N-1}(\theta_{right,knee}^{(i)}-\bar{\theta}_{right,knee})^2 })$$
$$\sigma_{elbow}=\frac{1}{2}(\sqrt{\frac{1}{N-1}(\theta_{left,elbow}^{(i)}-\bar{\theta}_{left,elbow})^2 }+\sqrt{\frac{1}{N-1}(\theta_{right,elbow}^{(i)}-\bar{\theta}_{right,elbow})^2 })$$
where $$$N$$$ and $$$J$$$ are the number of subjects and keypoints, $$$p$$$ and $$$\theta$$$ are the keypoint location and angle, $$$\bar{p}$$$ and $$$\bar{\theta}$$$ are the mean values.
Results
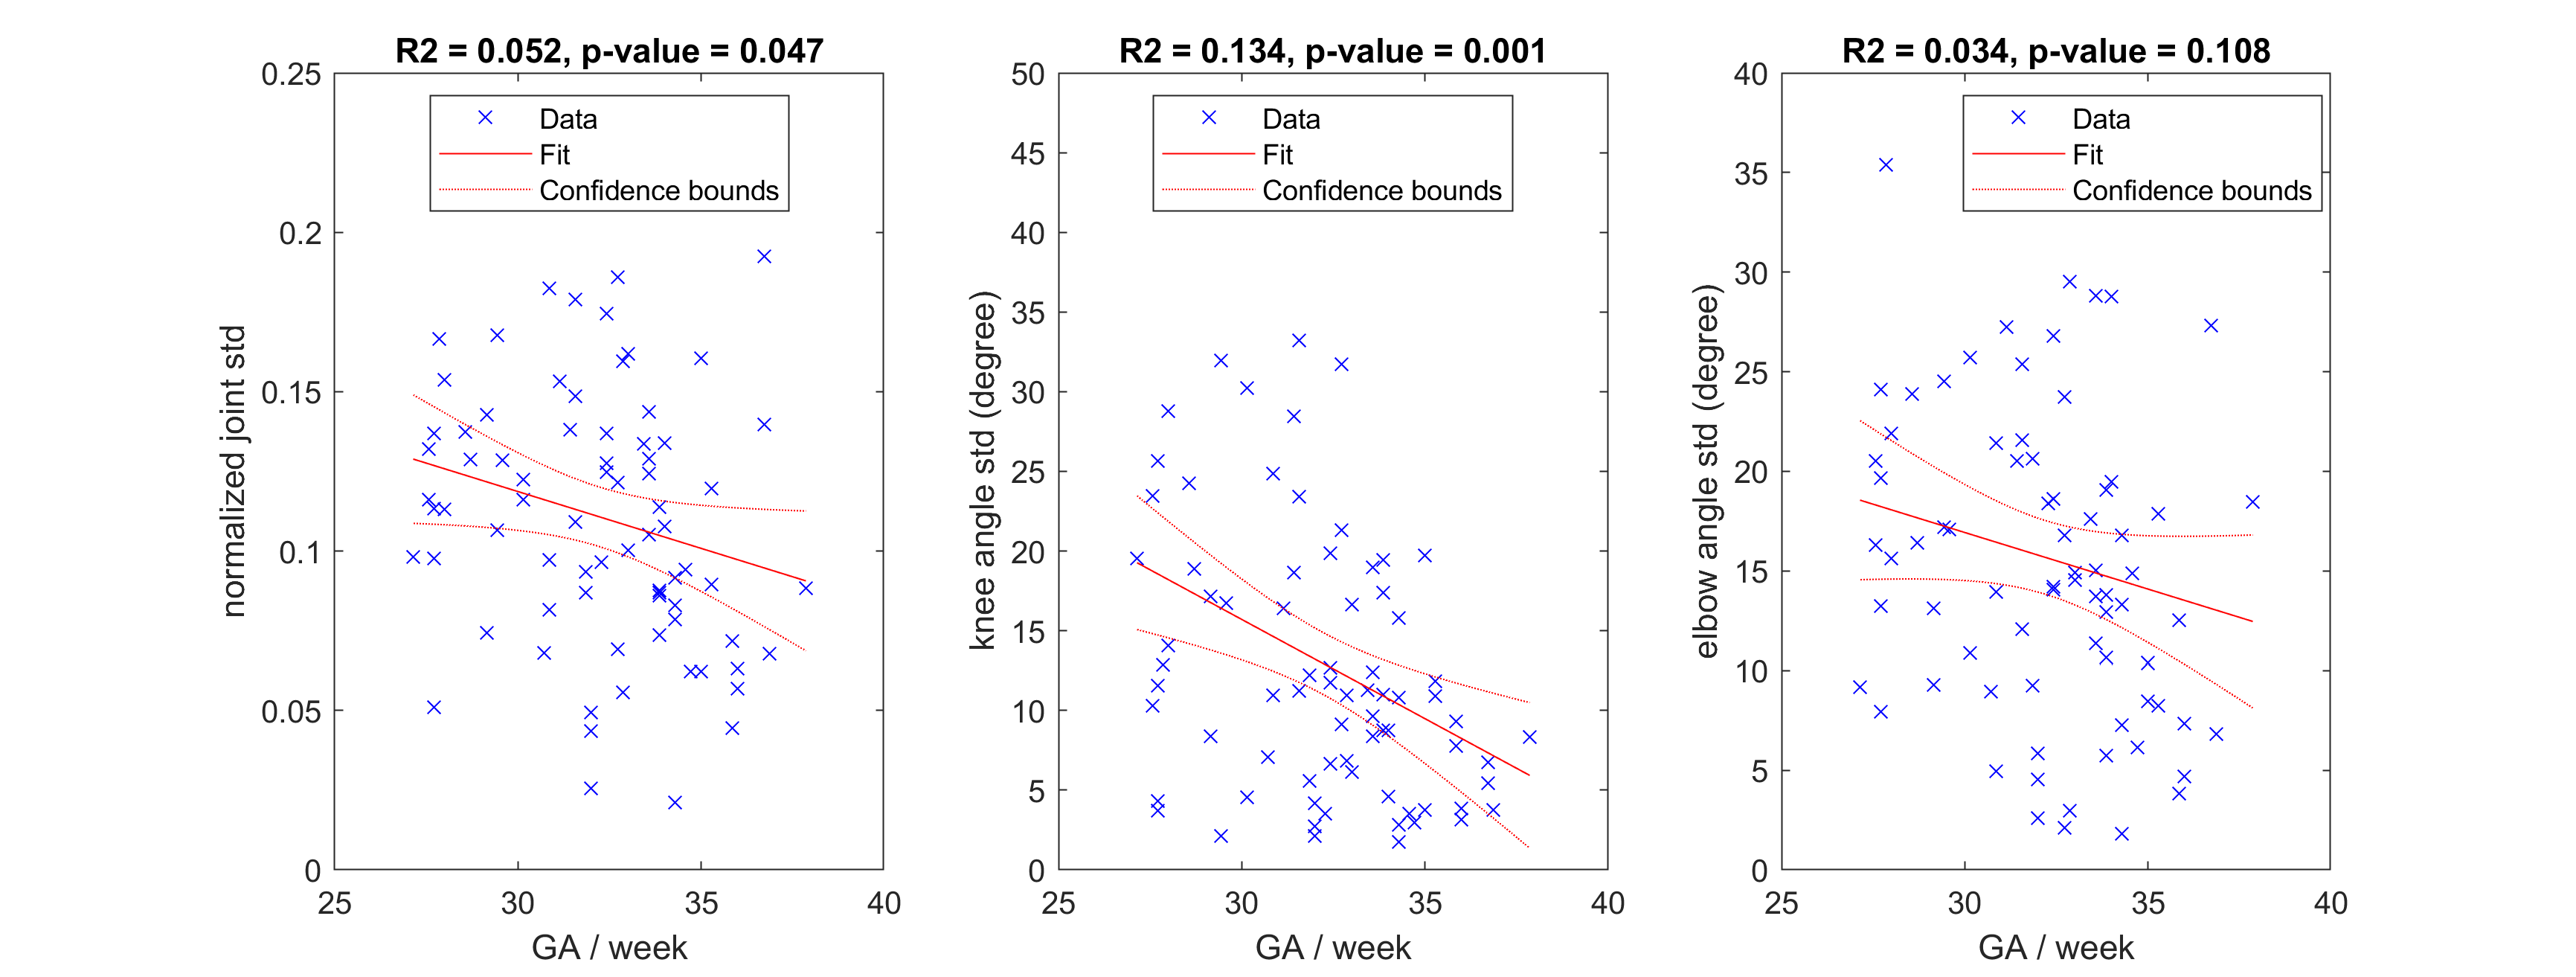
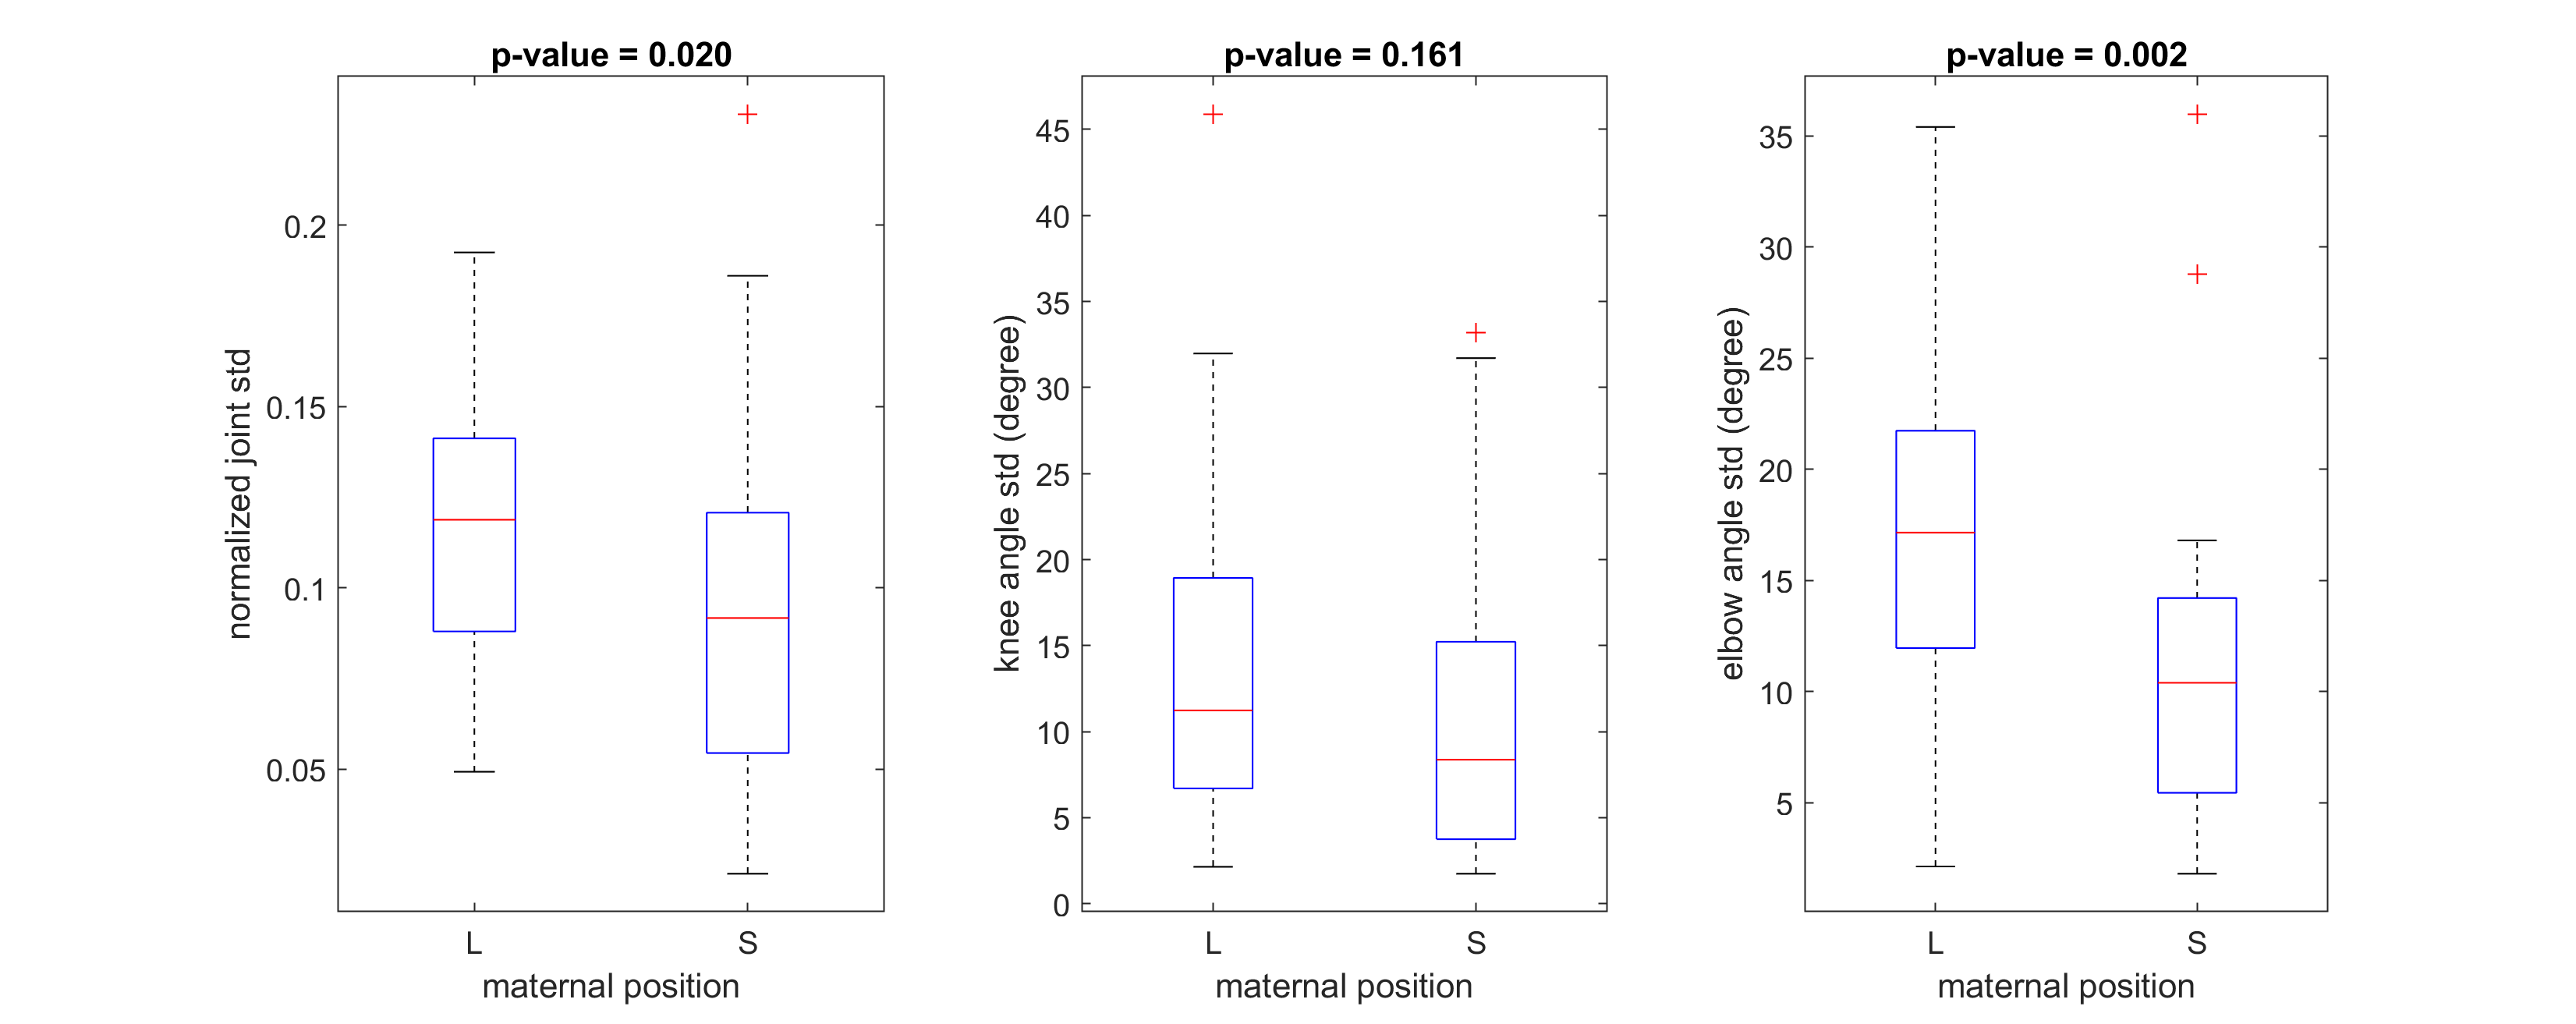
Fig. 3 shows the motion of two different subjects in our dataset, where we plot the change of knee and elbow angles and the corresponding angular velocities over the scan time. To investigate the effect of gestational age on fetal motion, we performed linear regression between, $$$\sigma_{kp}$$$, $$$\sigma_{knee}$$$, $$$\sigma_{elbow}$$$ and gestational age (GA) (Fig. 4). The coefficient of determination for the three metrics are 0.052, 0.134, and, 0.034 respectively. The p values of the slope are 0.047, 0.001, and 0.108 respectively. We also conducted experiments to compare the fetal motion ($$$\sigma_{kp}$$$, $$$\sigma_{knee}$$$, $$$\sigma_{elbow}$$$) under different maternal positions, namely left lateral (L) and Supine (S) (Fig. 5). The Wilcoxon rank-sum test was used to compare the difference between the two group and yielded the p values are 0.02, 0.161, and 0.002 for $$$\sigma_{kp}$$$, $$$\sigma_{knee}$$$, $$$\sigma_{elbow}$$$ respectively.Discussion
Fig.3 shows the difference in motion between an active subject and a sedate subject, indicating the large variation in motion patterns in our dataset. As the results show in Fig. 4, the intensity of motion decreases with GA, particularly angular motion at the knee. One explanation is that as the growth of fetus, there is less uterine space, which restricts fetal motion. In addition, when comparing the motion metrics under different maternal positions, as shown in Fig. 5, we can see that fetuses in the left lateral position tend to have higher motion intensity than fetuses in the supine position, particularly angular motion at elbow.Conclusion
In this work, we propose a framework for fetal motion characterization using a deep fetal pose estimation network and introduce three quantitative motion metrics that summaries full body motion and motion of particular joints of interest. This approach is used in the preliminary study of the motion in our fetal MRI dataset that highlights the effects of gestational age and maternal position on fetal motion and provides a premise for the future study of fetal motion tracking and analysis.Acknowledgements
This research was supported by NIH U01HD087211, NIH R01EB01733 and NIH NIBIB NAC P41EB015902. Nvidia.References
[1] Sajapala, S., AboEllail, M. A. M., Kanenishi, K., Mori, N., Marumo, G., & Hata, T. (2017). 4D ultrasound study of fetal movement early in the second trimester of pregnancy. Journal of Perinatal Medicine, 45(6), 737-743.
[2] Xu, J., Zhang, M., Turk, E. A., Grant, P. E., Golland, P., & Adalsteinsson, E. (2020). 3D Fetal Pose Estimation with Adaptive Variance and Conditional Generative Adversarial Network. In Medical Ultrasound, and Preterm, Perinatal and Paediatric Image Analysis (pp. 201-210). Springer, Cham.
[3] Çiçek, Ö., Abdulkadir, A., Lienkamp, S. S., Brox, T., & Ronneberger, O. (2016, October). 3D U-Net: learning dense volumetric segmentation from sparse annotation. In International conference on medical image computing and computer-assisted intervention (pp. 424-432). Springer, Cham.
[4] Xu, J., Zhang, M., Turk, E. A., Zhang, L., Grant, P. E., Ying, K., ... & Adalsteinsson, E. (2019, October). Fetal Pose Estimation in Volumetric MRI using a 3D Convolution Neural Network. In International Conference on Medical Image Computing and Computer-Assisted Intervention (pp. 403-410). Springer, Cham.
Figures