0528
Quantification of bone marrow edema in RA by using high-speed T2-corrected multiecho acquisition of 1H magnetic resonance spectroscopy1The First Affiliated Hospital of Guangxi Medical University, Nanning, China, 2Siemens Healthcare Ltd., Guangzhou, China, 3Siemens Healthcare Ltd., Wuhan, China
Synopsis
The purpose of this study was to determine whether high-speed T2-corrected multiecho (HISTO) sequences can quantify bone marrow edema (BME) in the capitate bone in rheumatoid arthritis (RA), and whether the HISTO fat fraction (FF) reflects therapeutic effectiveness.
The results showed that the HISTO sequence can measure the bone marrow FF of the wrist joint in RA patients. We also found that the HISTO sequence may help quantify BME in RA and help monitor the effectiveness of RA treatment.
Introduction
Rheumatoid arthritis (RA) is an autoimmune disease characterized by the chronic inflammation of peripheral joints, which leads to progressive structural damage, long-term disability, and premature mortality[1]. Bone marrow edema (BME) of RA is a powerful independent predictor of progressive joint damage, and can be used to predict the course of the disease[2-8]. Histopathological studies have shown that BME or osteitis results in the replacement of the normal fat tissues of the bone marrow with inflammatory cells in RA, which is manifested as an increase in tissue water content[9,10,11]. Therefore, it is possible to determine the severity of BME in RA by monitoring the changes in the fat content of the bone marrow.The high-speed T2-corrected multiecho (HISTO) has proved useful for the quantitative assessment of fatty liver[12-14] and muscle fatty lesions[15].Therefore, the objectives of this study were to (a) determine the feasibility of using the HISTO sequence for the quantitative assessment of BME in the capitate bone in RA-affected wrists, and (b) identify whether the FF value on HISTO sequences can be used to monitor the effectiveness of RA treatment.Methods and materials
This prospective study enrolled 25 patients (19 women; average age, 45.08 ± 13.48 years) with RA and 21 normal control subjects (15 women; age, 49.17 ± 6.56 years) from the local hospital between March and December 2019. Every subject was clearly told the whole experimental procedure and signed an informed consent form to participate in the current study, which was approved by the Medicine Ethics Committee of our hospital.The RA patients underwent MRI with HISTO sequence at the baseline and after 4, 8, and 12 weeks of treatment. Rheumatoid factor (RF), erythrocyte-sedimentation rate (ESR), C-reactive protein (CRP), platelet count (PLT), and 28-joint Disease Activity Score using ESR (DAS28-ESR) were recorded on the day of each MRI examination by a rheumatologist blinded to the MRI findings. In all patients, RA was diagnosed according to the American College of Rheumatology/European League Against Rheumatism criteria[16]. The healthy subjects underwent only the HISTO sequence at a single time point. For all participants, a 3.0-T scanner with a 15-channel joint coil was used for scanning with the same parameters.
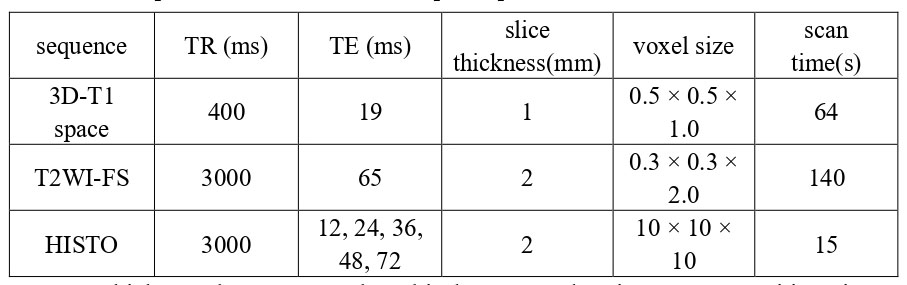
First, a three-dimensional (3D) T1 space sequence was performed, and followed by T2-weighted sequence with fat saturation which was acquired to confirm the absence of other diseases in all subjects. Reconstruction of the axial, coronal, and sagittal planes of the wrist joint was performed using the 3D-T1 space images, which were used to guide the localization of the capitate bone with the HISTO grid. Scan parameters are shown in Table 1.
Statistical analysis was performed using SPSS (version 22, Chicago, IL, USA). Differences in age, body mass index (BMI), and HISTO FF values between the control and patient groups at the baseline were tested using the independent-samples t-test. The gender difference between the control and patient groups at the baseline was examined using the chi-square test. Bland-Altman plots were used to assess the repeatability of measurements in the control group. In the RA patient group, correlations between the DAS28-ESR, RF, ESR, CRP, PLT, and HISTO FF values at the baseline, and the change in these values with each treatment course were assessed using Spearman correlation analysis. Repeated-measures analysis of variance (ANOVA) was used to analyze the trend of the correlation between the DAS28-ESR and HISTO FF values in RA patients. In all analyses, P values of <0.05 were taken to indicate a statistically significant difference.
Results
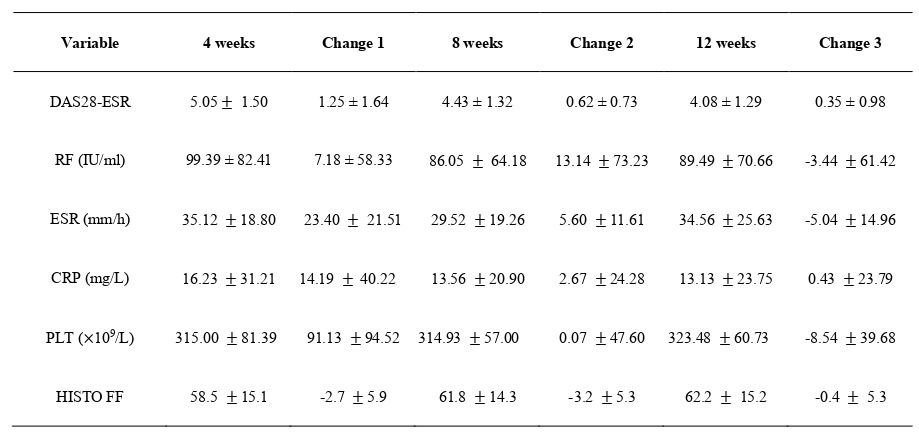
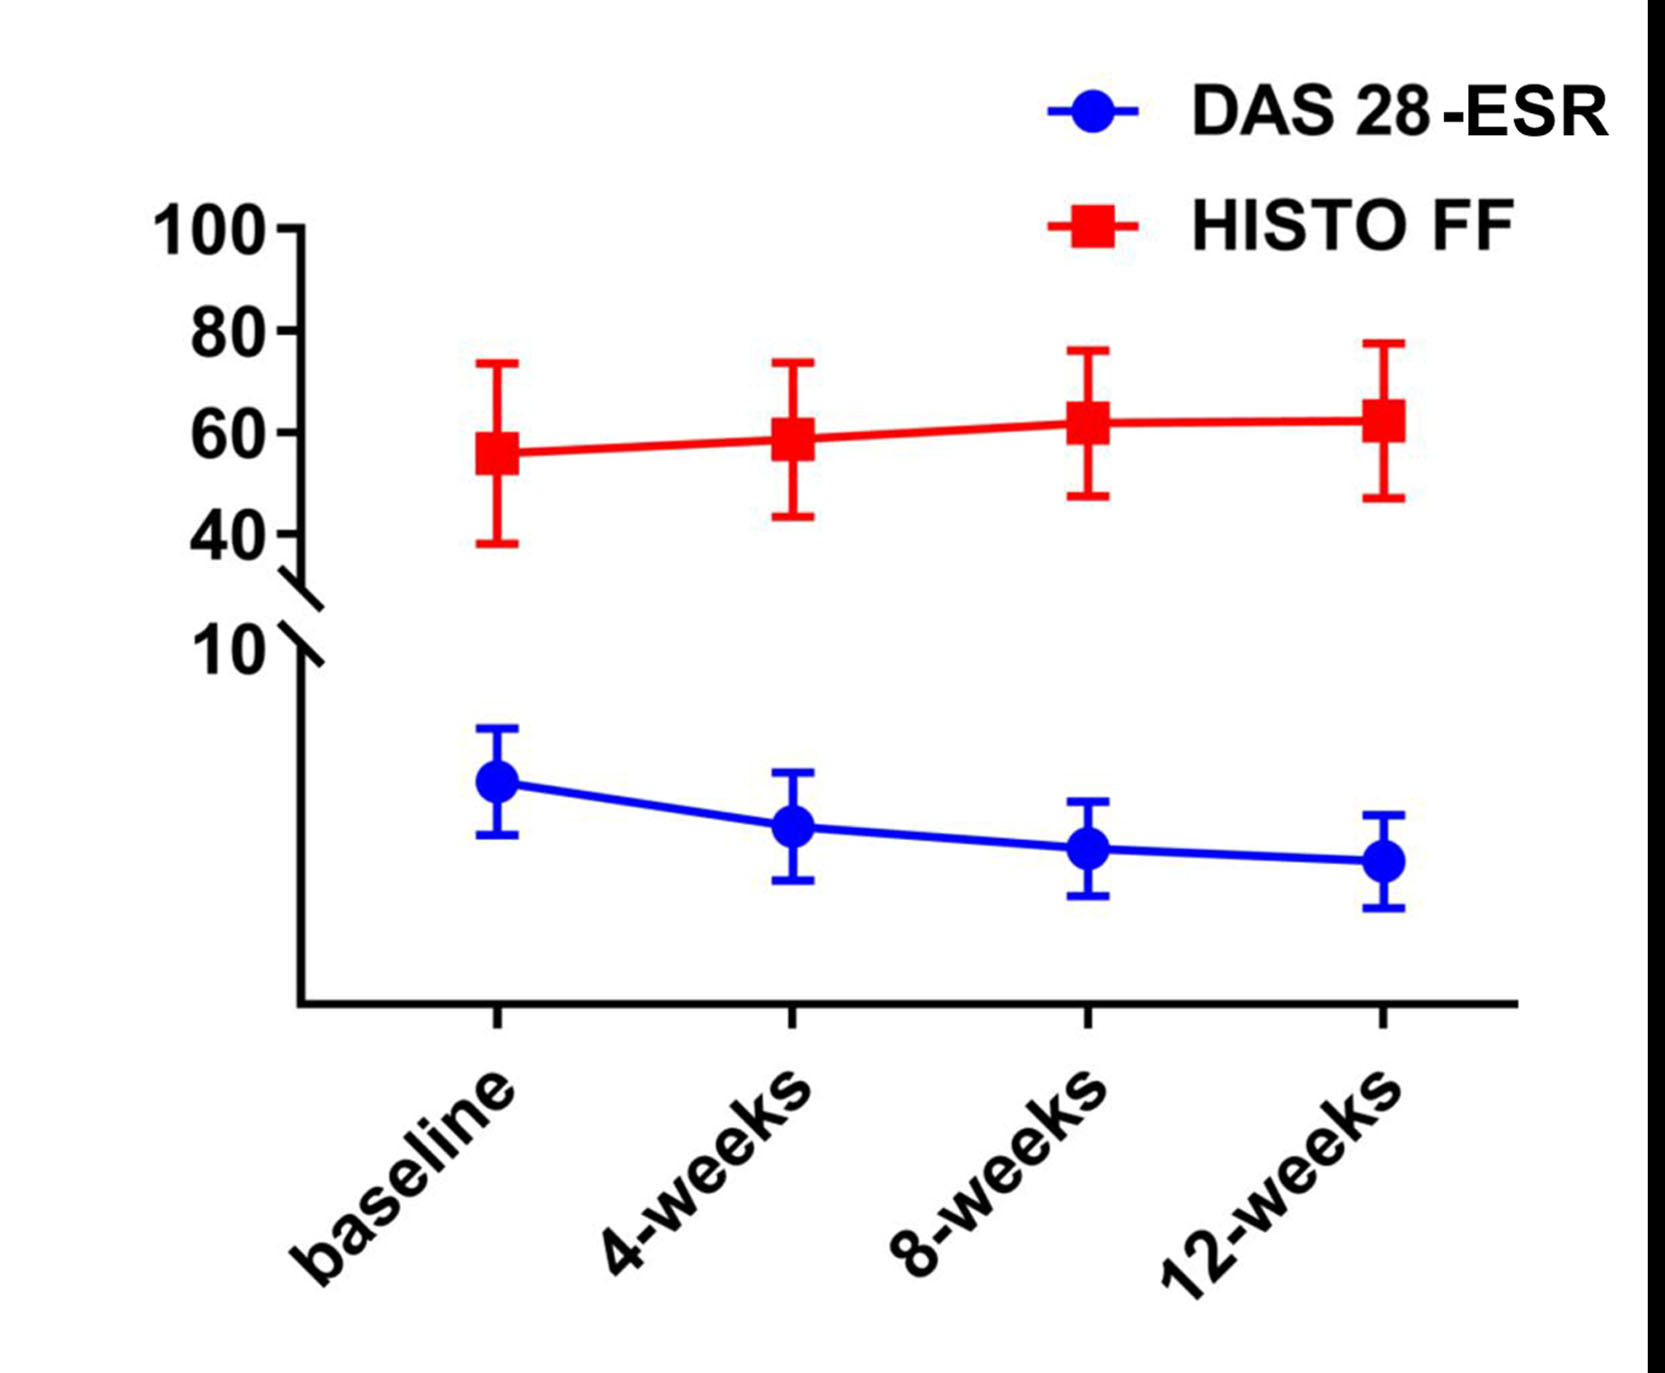
Age, gender, and BMI did not significantly differ between the patient and control groups at the baseline .From the baseline to 12 weeks, the mean DAS28-ESR and CRP values in RA patients decreased, while the mean HISTO FF increased. The average RF, ESR, and PLT decreased from the baseline to 8 weeks, but increased again at 12 weeks (Table 2).
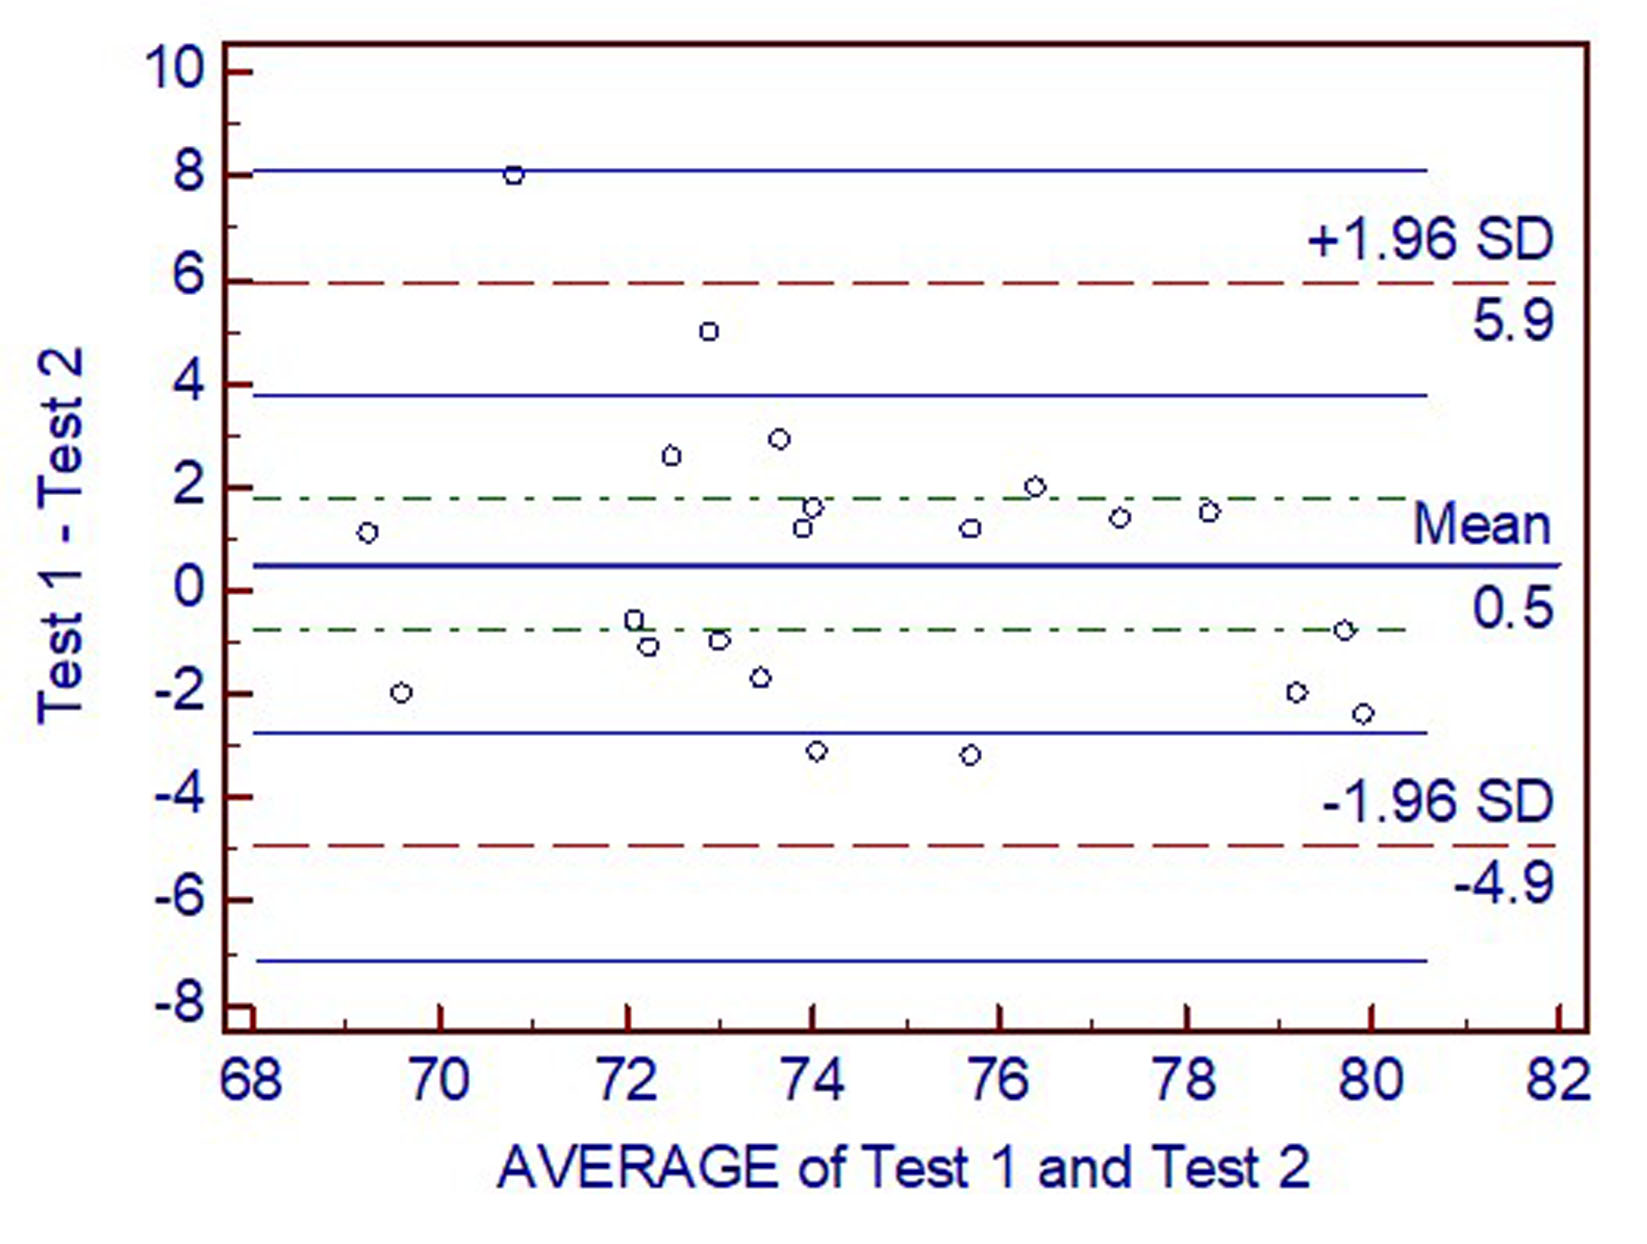
Bland-Altman plots showed good interobserver agreement of HISTO FF measurements between two repeated positioning scans (Figure 1). Patients with RA had lower HISTO FF of the capitate bone at the baseline than the control subjects (P < 0.05).
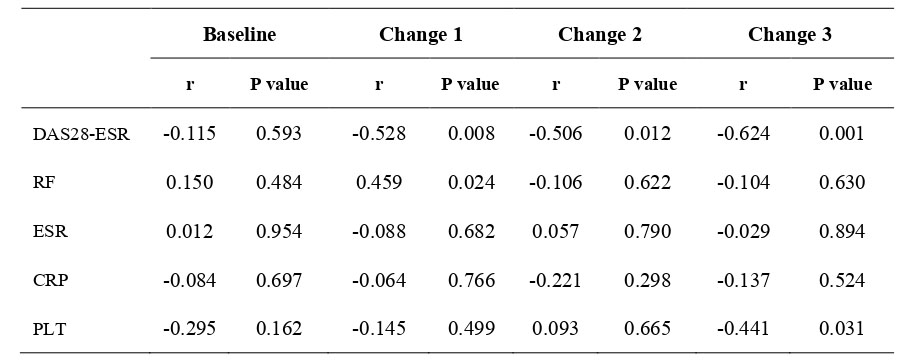
There was no correlation between DAS28-ESR, serological indicators, and HISTO FF in RA patients at the baseline (P > 0.05). After the treatment, the changes in HISTO FF and DAS28-ESR at 4, 8, and 12 weeks showed moderate negative correlations with each other (P < 0.05). The change in HISTO FF was significantly positively correlated with the change in RF at 4 weeks and significantly negatively correlated with the change in PLT at 12 weeks (P < 0.05) (Table 3).
Repeated-measures ANOVA showed an interaction between the DAS28-ESR and HISTO FF from the baseline to 12 weeks as HISTO FF increased, DAS28-ESR decreased (Figure 2).
Discussion and Conclusion
The change in FF at each time point and the overall trend of the changes in FF were negatively correlated with DAS28-ESR. However, the FF could not accurately reflect the changes in RF, ESR, CRP, and PLT.The HISTO sequence can measure the bone marrow FF of the wrist joint in RA patients. The HISTO sequence may help quantify BME in RA and help monitor the effectiveness of RA treatment.Acknowledgements
Acknowledgments: This research study did not receive any specific grant from funding agencies in the public, commercial, or not-for-profit sectors.We would like to thank Medjaden Bioscience Limited for scientific editing of this manuscript.References
1. Scott DL, Symmons DP, Coulton BL, Popert AJ (1987) Long-term outcome of treating rheumatoid arthritis: results after 20 years. Lancet 1 (8542):1108-1111. doi:10.1016/s0140-6736(87)91672-2
2.Nakashima Y, Tamai M, Kita J, Michitsuji T, Shimizu T, Fukui S, Umeda M, Nishino A, Suzuki T, Horai Y, Okada A, Nishimura T, Koga T, Kawashiri SY, Iwamoto N, Ichinose K, Hirai Y, Arima K, Yamasaki S, Nakamura H, Origuchi T, Takao S, Uetani M, Aoyagi K, Eguchi K, Kawakami A (2016) Magnetic Resonance Imaging Bone Edema at Enrollment Predicts Rapid Radiographic Progression in Patients with Early RA: Results from the Nagasaki University Early Arthritis Cohort. J Rheumatol 43 (7):1278-1284. doi:10.3899/jrheum.150988
3.Nieuwenhuis WP, van Steenbergen HW, Stomp W, Stijnen T, Huizinga TW, Bloem JL, van der Heijde D, Reijnierse M, van der Helm-van Mil AH (2016) The Course of Bone Marrow Edema in Early Undifferentiated Arthritis and Rheumatoid Arthritis: A Longitudinal Magnetic Resonance Imaging Study at Bone Level. Arthritis & rheumatology (Hoboken, NJ) 68 (5):1080-1088. doi:10.1002/art.39550
4.McQueen FM, Stewart N, Crabbe J, Robinson E, Yeoman S, Tan PL, McLean L (1999) Magnetic resonance imaging of the wrist in early rheumatoid arthritis reveals progression of erosions despite clinical improvement. Ann Rheum Dis 58 (3):156-163. doi:10.1136/ard.58.3.156
5.Hetland ML, Ejbjerg B, Hørslev-Petersen K, Jacobsen S, Vestergaard A, Jurik AG, Stengaard-Pedersen K, Junker P, Lottenburger T, Hansen I, Andersen LS, Tarp U, Skjødt H, Pedersen JK, Majgaard O, Svendsen AJ, Ellingsen T, Lindegaard H, Christensen AF, Vallø J, Torfing T, Narvestad E, Thomsen HS, Ostergaard M (2009) MRI bone oedema is the strongest predictor of subsequent radiographic progression in early rheumatoid arthritis. Results from a 2-year randomised controlled trial (CIMESTRA). Ann Rheum Dis 68 (3):384-390. doi:10.1136/ard.2008.088245.
6. Bøyesen P, Haavardsholm EA, Ostergaard M, van der Heijde D, Sesseng S, Kvien TK (2011) MRI in early rheumatoid arthritis: synovitis and bone marrow oedema are independent predictors of subsequent radiographic progression. Ann Rheum Dis 70 (3):428-433. doi:10.1136/ard.2009.123950
7. Woodworth TG, Morgacheva O, Pimienta OL, Troum OM, Ranganath VK, Furst DE (2017) Examining the validity of the rheumatoid arthritis magnetic resonance imaging score according to the OMERACT filter-a systematic literature review. Rheumatology (Oxford) 56 (7):1177-1188. doi:10.1093/rheumatology/kew445
8. McQueen FM, Benton N, Perry D, Crabbe J, Robinson E, Yeoman S, McLean L, Stewart N (2003) Bone edema scored on magnetic resonance imaging scans of the dominant carpus at presentation predicts radiographic joint damage of the hands and feet six years later in patients with rheumatoid arthritis. Arthritis Rheum 48 (7):1814-1827. doi:10.1002/art.11162
9. Jimenez-Boj E, Nöbauer-Huhmann I, Hanslik-Schnabel B, Dorotka R, Wanivenhaus AH, Kainberger F, Trattnig S, Axmann R, Tsuji W, Hermann S, Smolen J, Schett G (2007) Bone erosions and bone marrow edema as defined by magnetic resonance imaging reflect true bone marrow inflammation in rheumatoid arthritis. Arthritis Rheum 56 (4):1118-1124. doi:10.1002/art.22496
10. McQueen FM, Gao A, Ostergaard M, King A, Shalley G, Robinson E, Doyle A, Clark B, Dalbeth N (2007) High-grade MRI bone oedema is common within the surgical field in rheumatoid arthritis patients undergoing joint replacement and is associated with osteitis in subchondral bone. Ann Rheum Dis 66 (12):1581-1587. doi:10.1136/ard.2007.070326
11. Lim W, Saifuddin A (2019) Review article: the differential diagnosis of bone marrow edema on wrist MRI. Skeletal Radiol 48 (10):1525-1539. doi:10.1007/s00256-019-03204-1
12. Pineda N, Sharma P, Xu Q, Hu X, Vos M, Martin DR (2009) Measurement of hepatic lipid: high-speed T2-corrected multiecho acquisition at 1H MR spectroscopy--a rapid and accurate technique. Radiology 252 (2):568-576. doi:10.1148/radiol.2523082084
13. Lin H, Fu C, Kannengiesser S, Cheng S, Shen J, Dong H, Yan F (2018) Quantitative analysis of hepatic iron in patients suspected of coexisting iron overload and steatosis using multi-echo single-voxel magnetic resonance spectroscopy: Comparison with fat-saturated multi-echo gradient echo sequence. J Magn Reson Imaging 48 (1):205-213. doi:10.1002/jmri.25967
14. Yoshimura Y, Suzuki D, Miyahara K (2018) [Measurement Accuracy of Fat and Iron Deposits in the Liver Using (1)H-MRS (HISTO)]. Nihon Hoshasen Gijutsu Gakkai zasshi 74 (2):148-153. doi:10.6009/jjrt.2018_JSRT_74.2.148
15. Li Z, Zeng H, Han C, Sun L, Fang D, Yu H, Quan X (2019) Effectiveness of High-Speed T2-Corrected Multiecho MR Spectroscopic Method for Quantifying Thigh Muscle Fat Content in Boys With Duchenne Muscular Dystrophy. AJR Am J Roentgenol:1-7. doi:10.2214/ajr.18.20354
16. Aletaha D, Neogi T, Silman AJ, Funovits J, Felson DT, Bingham CO, 3rd, Birnbaum NS, Burmester GR, Bykerk VP, Cohen MD, Combe B, Costenbader KH, Dougados M, Emery P, Ferraccioli G, Hazes JM, Hobbs K, Huizinga TW, Kavanaugh A, Kay J, Kvien TK, Laing T, Mease P, Ménard HA, Moreland LW, Naden RL, Pincus T, Smolen JS, Stanislawska-Biernat E, Symmons D, Tak PP, Upchurch KS, Vencovský J, Wolfe F, Hawker G (2010) 2010 Rheumatoid arthritis classification criteria: an American College of Rheumatology/European League Against Rheumatism collaborative initiative. Arthritis Rheum 62 (9):2569-2581. doi:10.1002/art.27584
Figures