0527
Simultaneous assessment of vertebral fractures and edema of the thoracolumbar spine on water-fat and SW images derived from a single-TE UTE scan
Sophia Kronthaler1, Christof Boehm1, Peter Börnert2, Ulrich Katscher2, Kilian Weiss3, Marcus R. Makowski1, Benedikt J. Schwaiger1, Alexandra S. Gersing1, and Dimitrios C. Karampinos1
1Department of Diagnostic and Interventional Radiology, School of Medicine, Technical University of Munich, Munich, Germany, 2Philips Research Laboratory, Hamburg, Germany, 3Philips Healthcare, Hamburg, Germany
1Department of Diagnostic and Interventional Radiology, School of Medicine, Technical University of Munich, Munich, Germany, 2Philips Research Laboratory, Hamburg, Germany, 3Philips Healthcare, Hamburg, Germany
Synopsis
CT and MR imaging are often both performed in patients with vertebral fractures or degenerative changes, with CT aiming at the characterization of osseous changes and the MR focusing on bone marrow edema. CT is associated with radiation exposure and therefore it is desirable to assess both soft-tissue and osseous components in one MR examination. The present work develops a methodology for simultaneously extracting susceptibility weighted imaging (SWI) and single point Dixon imaging based on a single-TE ultrashort echo time (UTE) scan to simultaneously assess vertebral fractures and degenerative bone changes in the thoracolumbar spine with a single MR sequence.
Introduction/Purpose
In patients with vertebral fractures or degenerative changes often CT and MR imaging are performed1. A CT is performed to assess the fracture lines of the vertebra for potential surgery planning in acute cases. Acute vertebral fractures are often associated with bone marrow edema. To differentiate acute from chronic fractures MR imaging is the ‘gold standard’ for the investigation of bone marrow edema2. Degenerative changes of the spine comprise soft-tissue as well as osseous tissue components2,3. CT examinations of the spine are associated with radiation exposure, additional examination time and costs. To assess the soft-tissue and the osseous components it would be desirable to acquire all information in one examination. Ultrashort-echo time (UTE) imaging enables signal detection from tissues with short T2* components, such as cortical bone(4). The purpose of this work was to develop a methodology for simultaneously extracting susceptibility-weighted imaging (SWI) and single point Dixon imaging (spDixon) based on a single-TE UTE scan in order to assess vertebral fractures and degenerative bone changes in the thoracolumbar spine.Methods
The complex UTE S(x) data at TE=0.14ms was processed in the following manner:SWI-processing
A phase mask f(x) was defined to enhance negative phase values as follows5:
$$S_{n}^{\prime}(x)=f(x)^{n}|S(x)|\;\;\;\;\text{with}\;\;f(x)=\left\{\begin{array}{cc}\frac{\pi+\phi(x)}{\pi}\text{for.}&-\pi<\phi(x)<0\\1&\text{otherwise}\end{array}\right.\;\;\;\;\text{[1]}$$
The phase mask was then n-times multiplied into the magnitude of the original UTE image |S(x)|.
spDixon-processing
spDixon approaches were previously proposed for rapid water-fat separation from a single TE6,7. The water–fat separation is sensitive to unwanted phase components $$$\phi$$$. To remove unwanted components, previous methods either used calibration scans or implemented a region-growing algorithm. Unwanted phase components arise due to B0 inhomogeneities, eddy currents, signal delays in the receiver chains, and the B1 transmit/receive phase6. In UTE imaging the phase contribution due to B0 inhomogeneities was expected to be small with respect to the short TE (0.14ms). Eddy currents and signal delays were corrected by means of a gradient impulse response function8. We observed a strong contribution of the B1 phase which varied slowly and smoothly in the x-y plane (Figure 1A)9,10. To demodulate unwanted phase components and separate water and fat, we propose to solve the following smoothness-constrained non-linear inverse problem:
$$\phi^{*}=\underset{\phi}{\operatorname{argmin}}\psi(\phi)=\underset{\phi}{\operatorname{argmin}} \frac{1}{2}\left\|\left(|W|+|F| e^{i\theta}\right)e^{i \phi}-S_{exp}\right\|_{2}^{2}+\lambda\|\nabla\phi\|_{2}^{2}\;\;\;\;\text{[2]}$$
where W: water image, F: fat image, $$$\theta=\angle\left(\sum_{i}\alpha_{i}e^{2\pi\,i\Delta\,f_{i}}\right)$$$: phase difference between water and fat due to the chemical shift, Sexp measured signal, $$$\lambda$$$ : regularization parameter and $$$\phi^*$$$: optimal solution which contains all unwanted phase components. $$$\psi$$$ was linearized as follows:
$$\psi(\phi+d \phi)=\frac{1}{2}\left\|\left(|W|+|F|e^{i \theta}\right)e^{i \phi}(1+id\phi)-S_{exp}\right\|_{2}^{2}+\lambda\|\nabla\phi+\nabla\,d\phi\|_{2}^{2}\;\;\;\;\text {[3]}$$
The update $$$d \phi$$$ was found by solving:
$$0=\nabla_{d\phi}\psi(\phi+d\phi)\;\;\;\;\text {[4]}$$
$$\left[\left(|W|^{2}+|F|^{2}+2|W||F|\cos(\theta)\right)+2\lambda\nabla^{H}\nabla\right]d\phi=-\operatorname{Im}\left(\left(|W|+|F|e^{i\theta}\right)e^{i\phi}S_{exp}^{H}\right)-2\lambda\nabla^{H} \nabla\phi\;\;\;\;\text{[5]}$$
Finally, equation [5] was solved using the conjugate gradient method (Figure 1B). The Gauss-Newton method is terminated when the relative update $$$\frac{\left\|d \phi_{n}\right\|_{2}}{\left\|\phi_{n}\right\|_{2}}$$$ was smaller than 0.01 with $$$\phi_{n}$$$ being the solution after the n-th iteration step.
UTE
UTE images were acquired with a 3D stack-of-stars sequence8 using a 3T-MRI (Ingenia Elition X, Philips Healthcare, Best, Netherlands) and following parameters: TR/TE=6.3/0.14ms, FA=5°, in‐plane resolution 0.45×0.45mm2, slice thickness=3mm, FOV=250×250×279mm3, ramp length=0.08ms, maximum gradient strength 15.04mT/m, dwell time=3.12μs, acquisition window=1.77ms, 945 spokes, 568 samples, radial percentage 85%, half‐scan factor 0.6 in slice-direction, and scan time of 6.3min.
mDixon and STIR
A six-echo 3D monopolar time-interleaved multi-echo gradient-echo sequence was used11 with following parameters: 2 interleaves with 3 echoes per TR and TR/TE1/ΔTE=8.2/1.3/1.1ms, FA=3°, voxel size=1.8×1.8×1.8mm3, FOV=626×511×102mm3, receiver bandwidth=1504 Hz/pixel, frequency direction A/P, scan time=3.7min. Water–fat maps were calculated using chemical shift encoding-based water-fat separation assuming a common T2* for water and fat and a multi-peak fat model, tuned specifically to bone marrow12,13. Further, a sagittal short-tau inversion recovery (STIR) was acquired which is used in the standard clinical routine to detect bone marrow edema.
Results
Figure 1 shows the observed smoothly varying B1 phase and the resulting $$$\phi_{n}$$$ after n iteration steps. The demodulated phase showed no notable unwanted phase components or influences of the B1 phase (Figure 1C).Figure 2 shows the spDixon result for different regularization parameters. The best result was obtained for a $$$\lambda$$$ of 105, where the water-fat contrast was high and subcutaneous fat was correctly identified as fat.
Figure 3 shows the spDixon results from a single UTE acquisition in comparison with water-fat images from a Cartesian 6-echo multi-echo scan (mDixon) and a STIR acquisition. The quality of the water–fat images from the spDixon was comparable with the mDixon maps. The red arrow highlights edema of an acute fracture, which was elevated in the STIR and was detectable in the spDixon maps.
Figure 4 shows that the SWI processing increased the contrast of osseous structures and the depiction of disc herniation into the vertebra.
Figure 5 shows an example of how the derived water-spDixon, SWI-UTE images can replace STIR and CT images in assessing edema and fracture lines, respectively.
Discussion & Conclusion
The proposed methodology allows the removal of the low-frequency background phase enabling water-fat separation and SWI from a single-echo complex UTE image. The water-fat separation can be challenging in anterior fat regions affected by respiratory motion and the UTE images are affected by fat blurring due to the radial k-space trajectory. The presented results showed that the proposed methodology enables the simultaneous assessment of vertebral fractures and edema of the thoracolumbar spine from a single MR sequence.Acknowledgements
The present work was supported by the European Research Council (grant agreement No 677661, ProFatMRI). This work reflects only the authors view and the EU is not responsible for any use that may be made of the information it contains. The authors also acknowledge research support from DAAD (Project number: 57514573) and Philips Healthcare.References
- Shanechi AM, Kiczek M, Khan M, Jindal G. Spine Anatomy Imaging: An Update. Neuroimaging Clin N Am 2019;29(4):461-480.
- Piazzolla A, Solarino G, Lamartina C, De Giorgi S, Bizzoca D, Berjano P, Garofalo N, Setti S, Dicuonzo F, Moretti B. Vertebral Bone Marrow Edema (VBME) in Conservatively Treated Acute Vertebral Compression Fractures (VCFs): Evolution and Clinical Correlations. Spine (Phila Pa 1976) 2015;40(14):E842-848.
- Mandalia V, Henson JH. Traumatic bone bruising--a review article. Eur J Radiol 2008;67(1):54-61.
- Weiger M, Pruessmann KP. Short-T2 MRI: Principles and recent advances. Prog Nucl Magn Reson Spectrosc 2019;114-115:237-270.
- Haacke EM, Xu Y, Cheng YC, Reichenbach JR. Susceptibility weighted imaging (SWI). Magn Reson Med 2004;52(3):612-618.
- Ma J. A single-point Dixon technique for fat-suppressed fast 3D gradient-echo imaging with a flexible echo time. J Magn Reson Imaging 2008;27(4):881-890.
- Jang H, Carl M, Ma Y, Jerban S, Guo T, Zhao W, Chang EY, Du J. Fat suppression for ultrashort echo time imaging using a single-point Dixon method. NMR Biomed 2019;32(5):e4069.
- Kronthaler S, Rahmer J, Bornert P, Makowski MR, Schwaiger BJ, Gersing AS, Karampinos DC. Trajectory correction based on the gradient impulse response function improves high-resolution UTE imaging of the musculoskeletal system. Magn Reson Med 2020.
- Katscher U, van den Berg CAT. Electric properties tomography: Biochemical, physical and technical background, evaluation and clinical applications. NMR Biomed 2017;30(8).
- Kim DH, Choi N, Gho SM, Shin J, Liu C. Simultaneous imaging of in vivo conductivity and susceptibility. Magn Reson Med 2014;71(3):1144-1150.
- Ruschke S, Eggers H, Kooijman H, Diefenbach MN, Baum T, Haase A, Rummeny EJ, Hu HH, Karampinos DC. Correction of phase errors in quantitative water-fat imaging using a monopolar time-interleaved multi-echo gradient echo sequence. Magn Reson Med 2017;78(3):984-996.
- Diefenbach MN, Liu C, Karampinos DC. Generalized parameter estimation in multi-echo gradient-echo-based chemical species separation. Quant Imaging Med Surg 2020;10(3):554-567.
- Ren J, Dimitrov I, Sherry AD, Malloy CR. Composition of adipose tissue and marrow fat in humans by 1H NMR at 7 Tesla. J Lipid Res 2008;49(9):2055-2062.
Figures
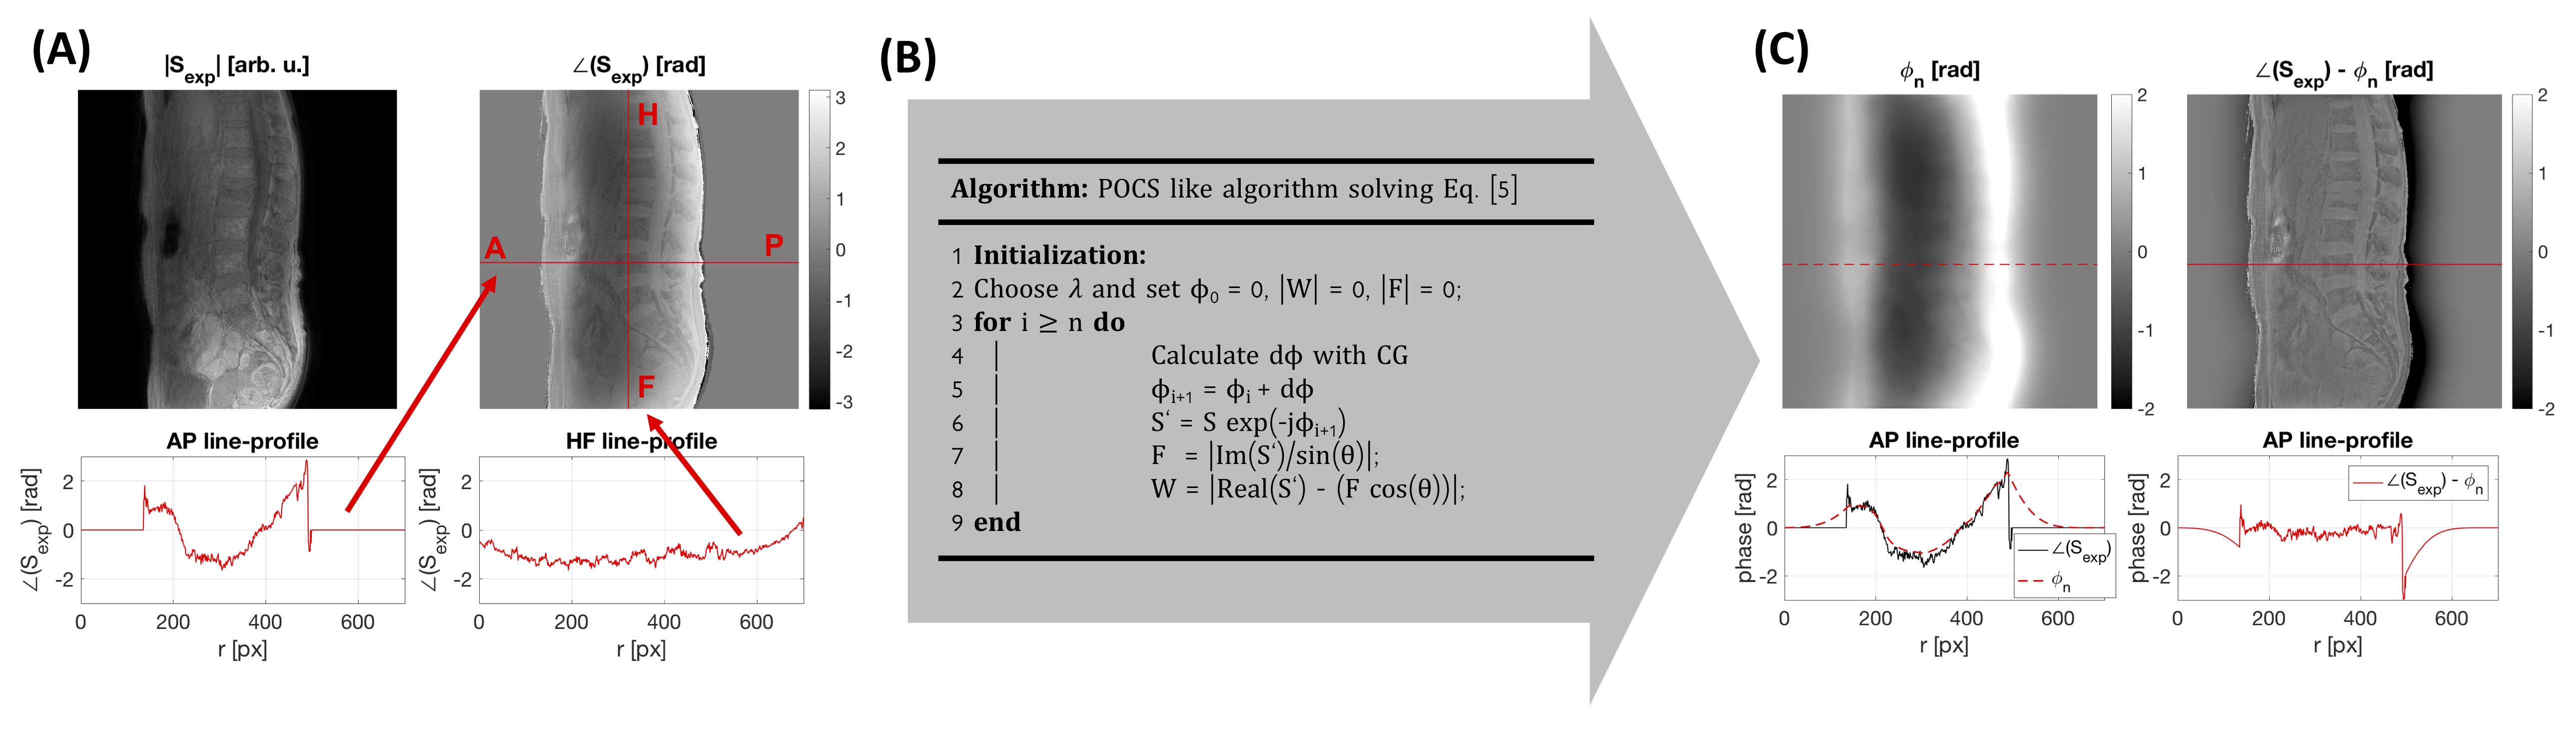
Figure 1: spDixon processing pipeline: A) The UTE phase $$$\angle\left(S_{\text{exp}}\right)$$$ contained contributions from the B1 phase which varied along AP and RL (x-y-plane). B) A POCS-like algorithm was used to solve Equation [4]. The update dϕ was calculated using conjugate gradients (CG). C) After n-update steps the phase error ϕn was estimated. In the corrected UTE phase ϕ0 – ϕn unwanted phase components and the B1 phase contribution were removed.
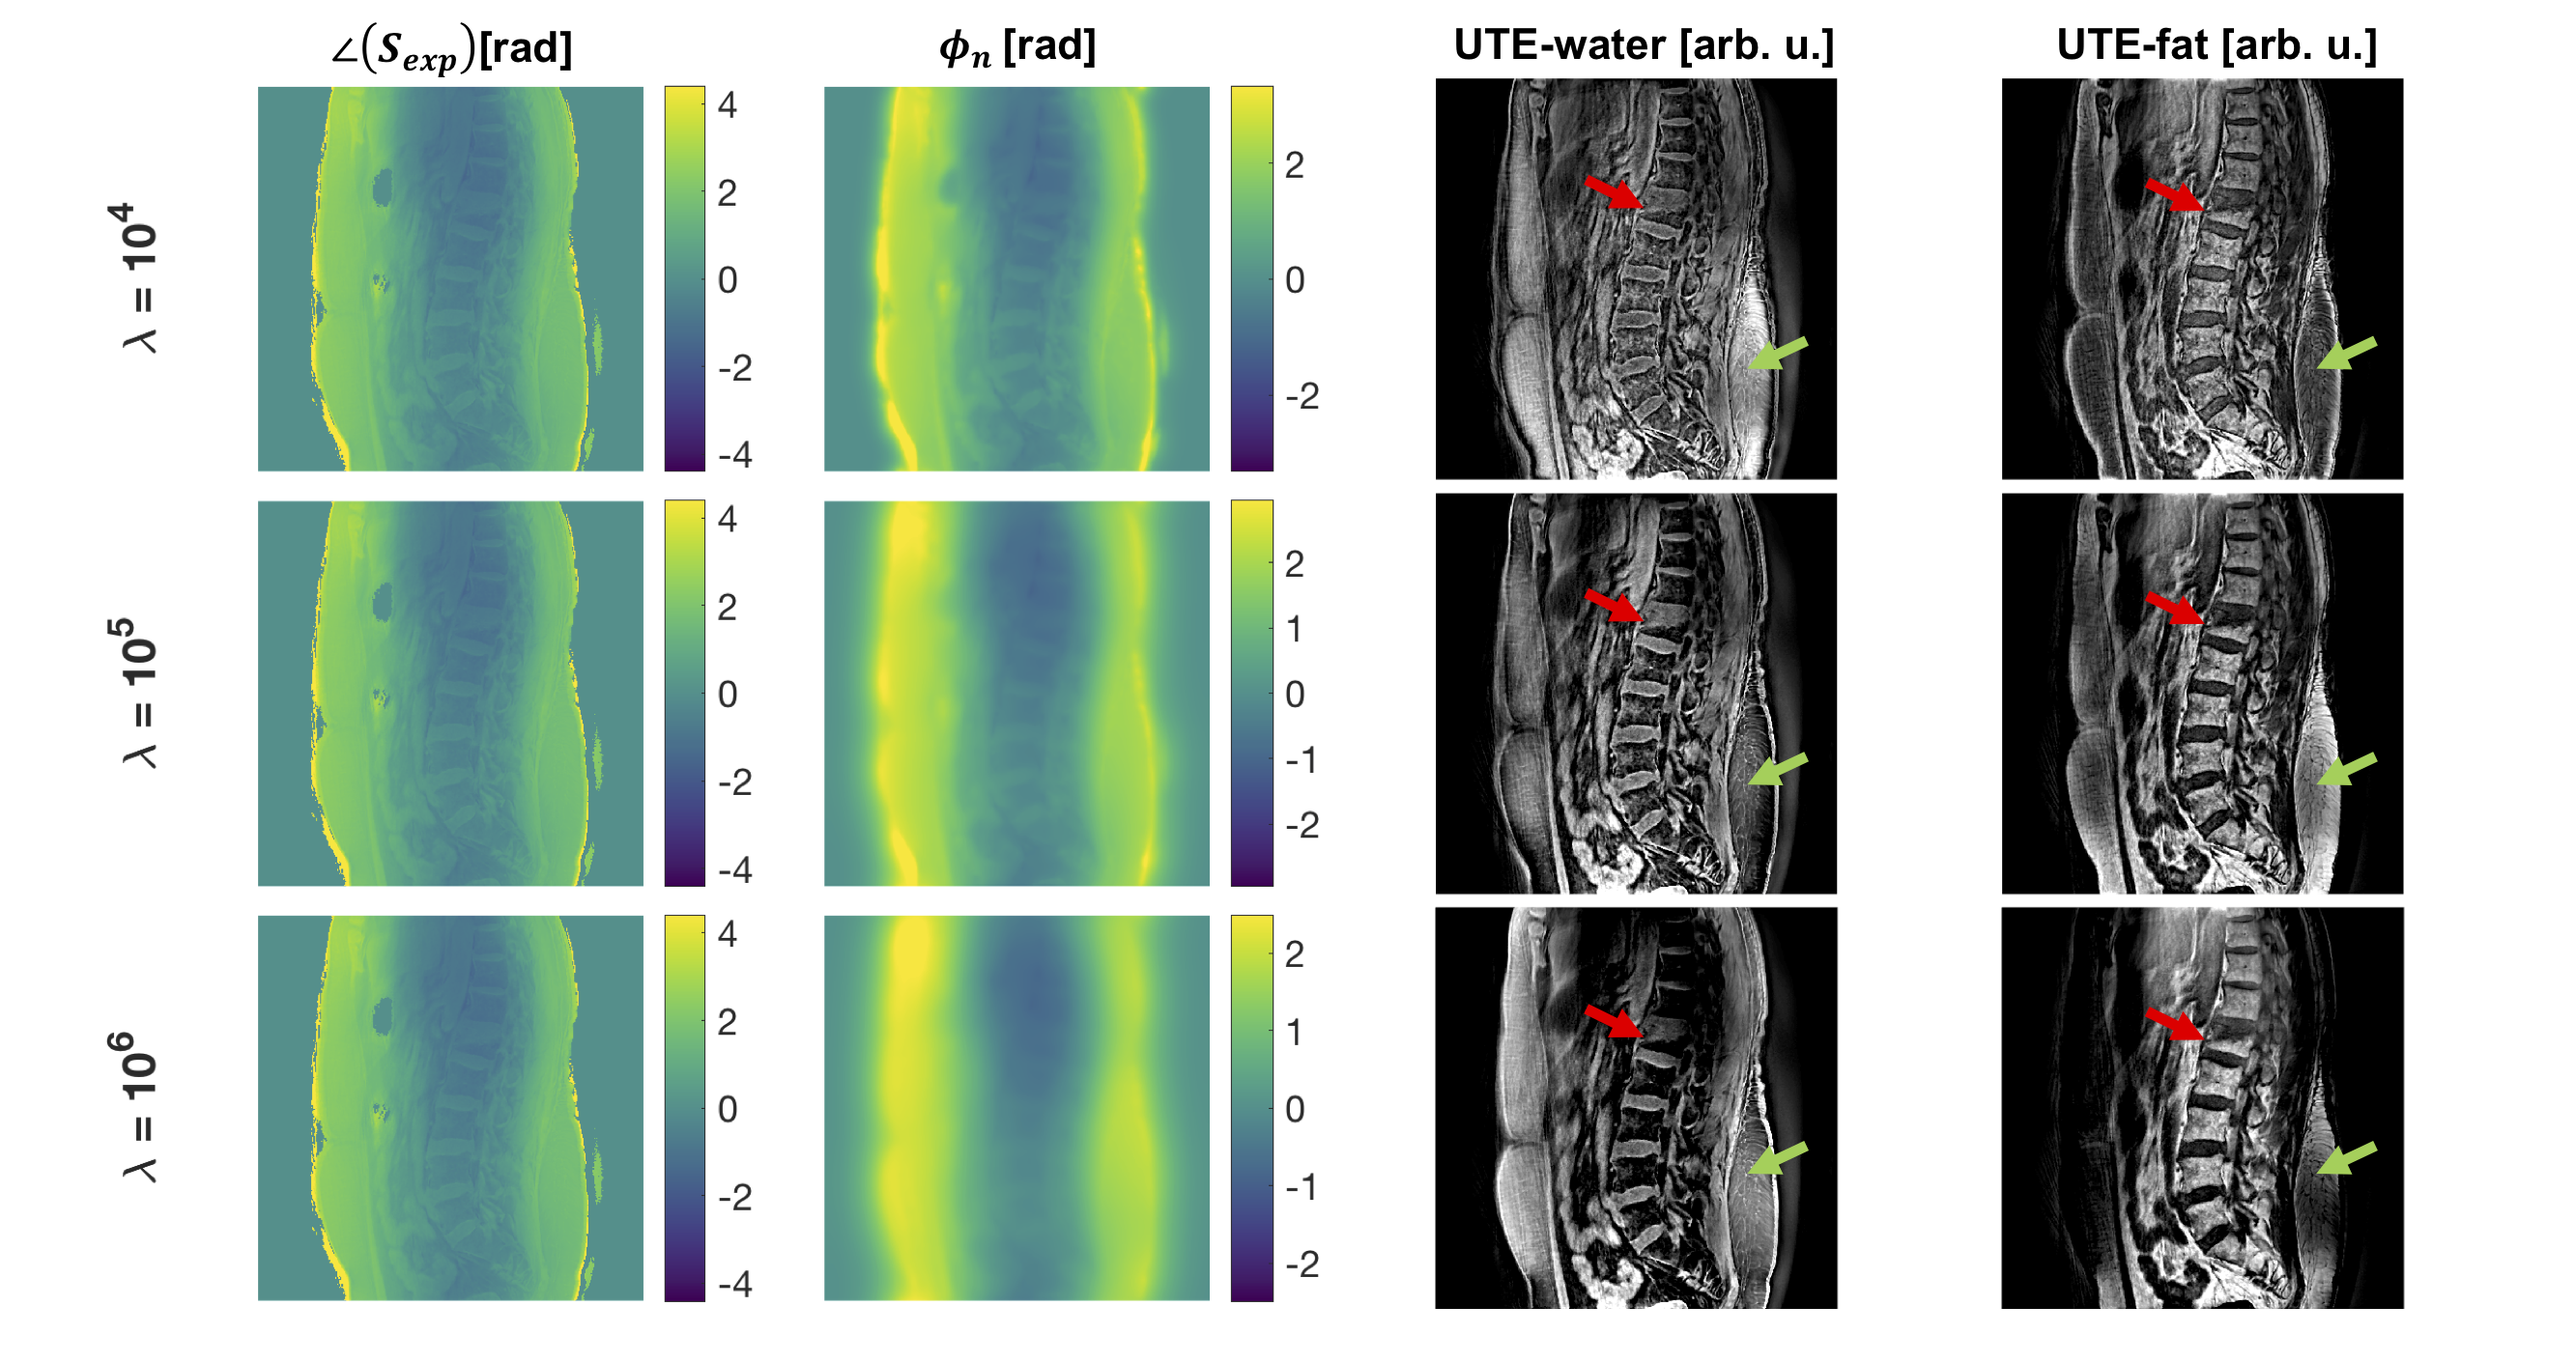
Figure 2: Comparison of different regularization parameters λ: For a λ of 104 the phase error was not entirely smooth, useful phase information was demodulated and the contrast in the W/F images was low. An increasing λ value increased the contrast of the water and fat images since the unwanted phase component was demodulated but no phase information was lost. In the overregularized maps the subcutaneous fat was falsely identified as water (green arrow). A λ of 105 gave the best water–fat separation and the visibility of an acute fracture with bone marrow edema (red arrow) was increased.
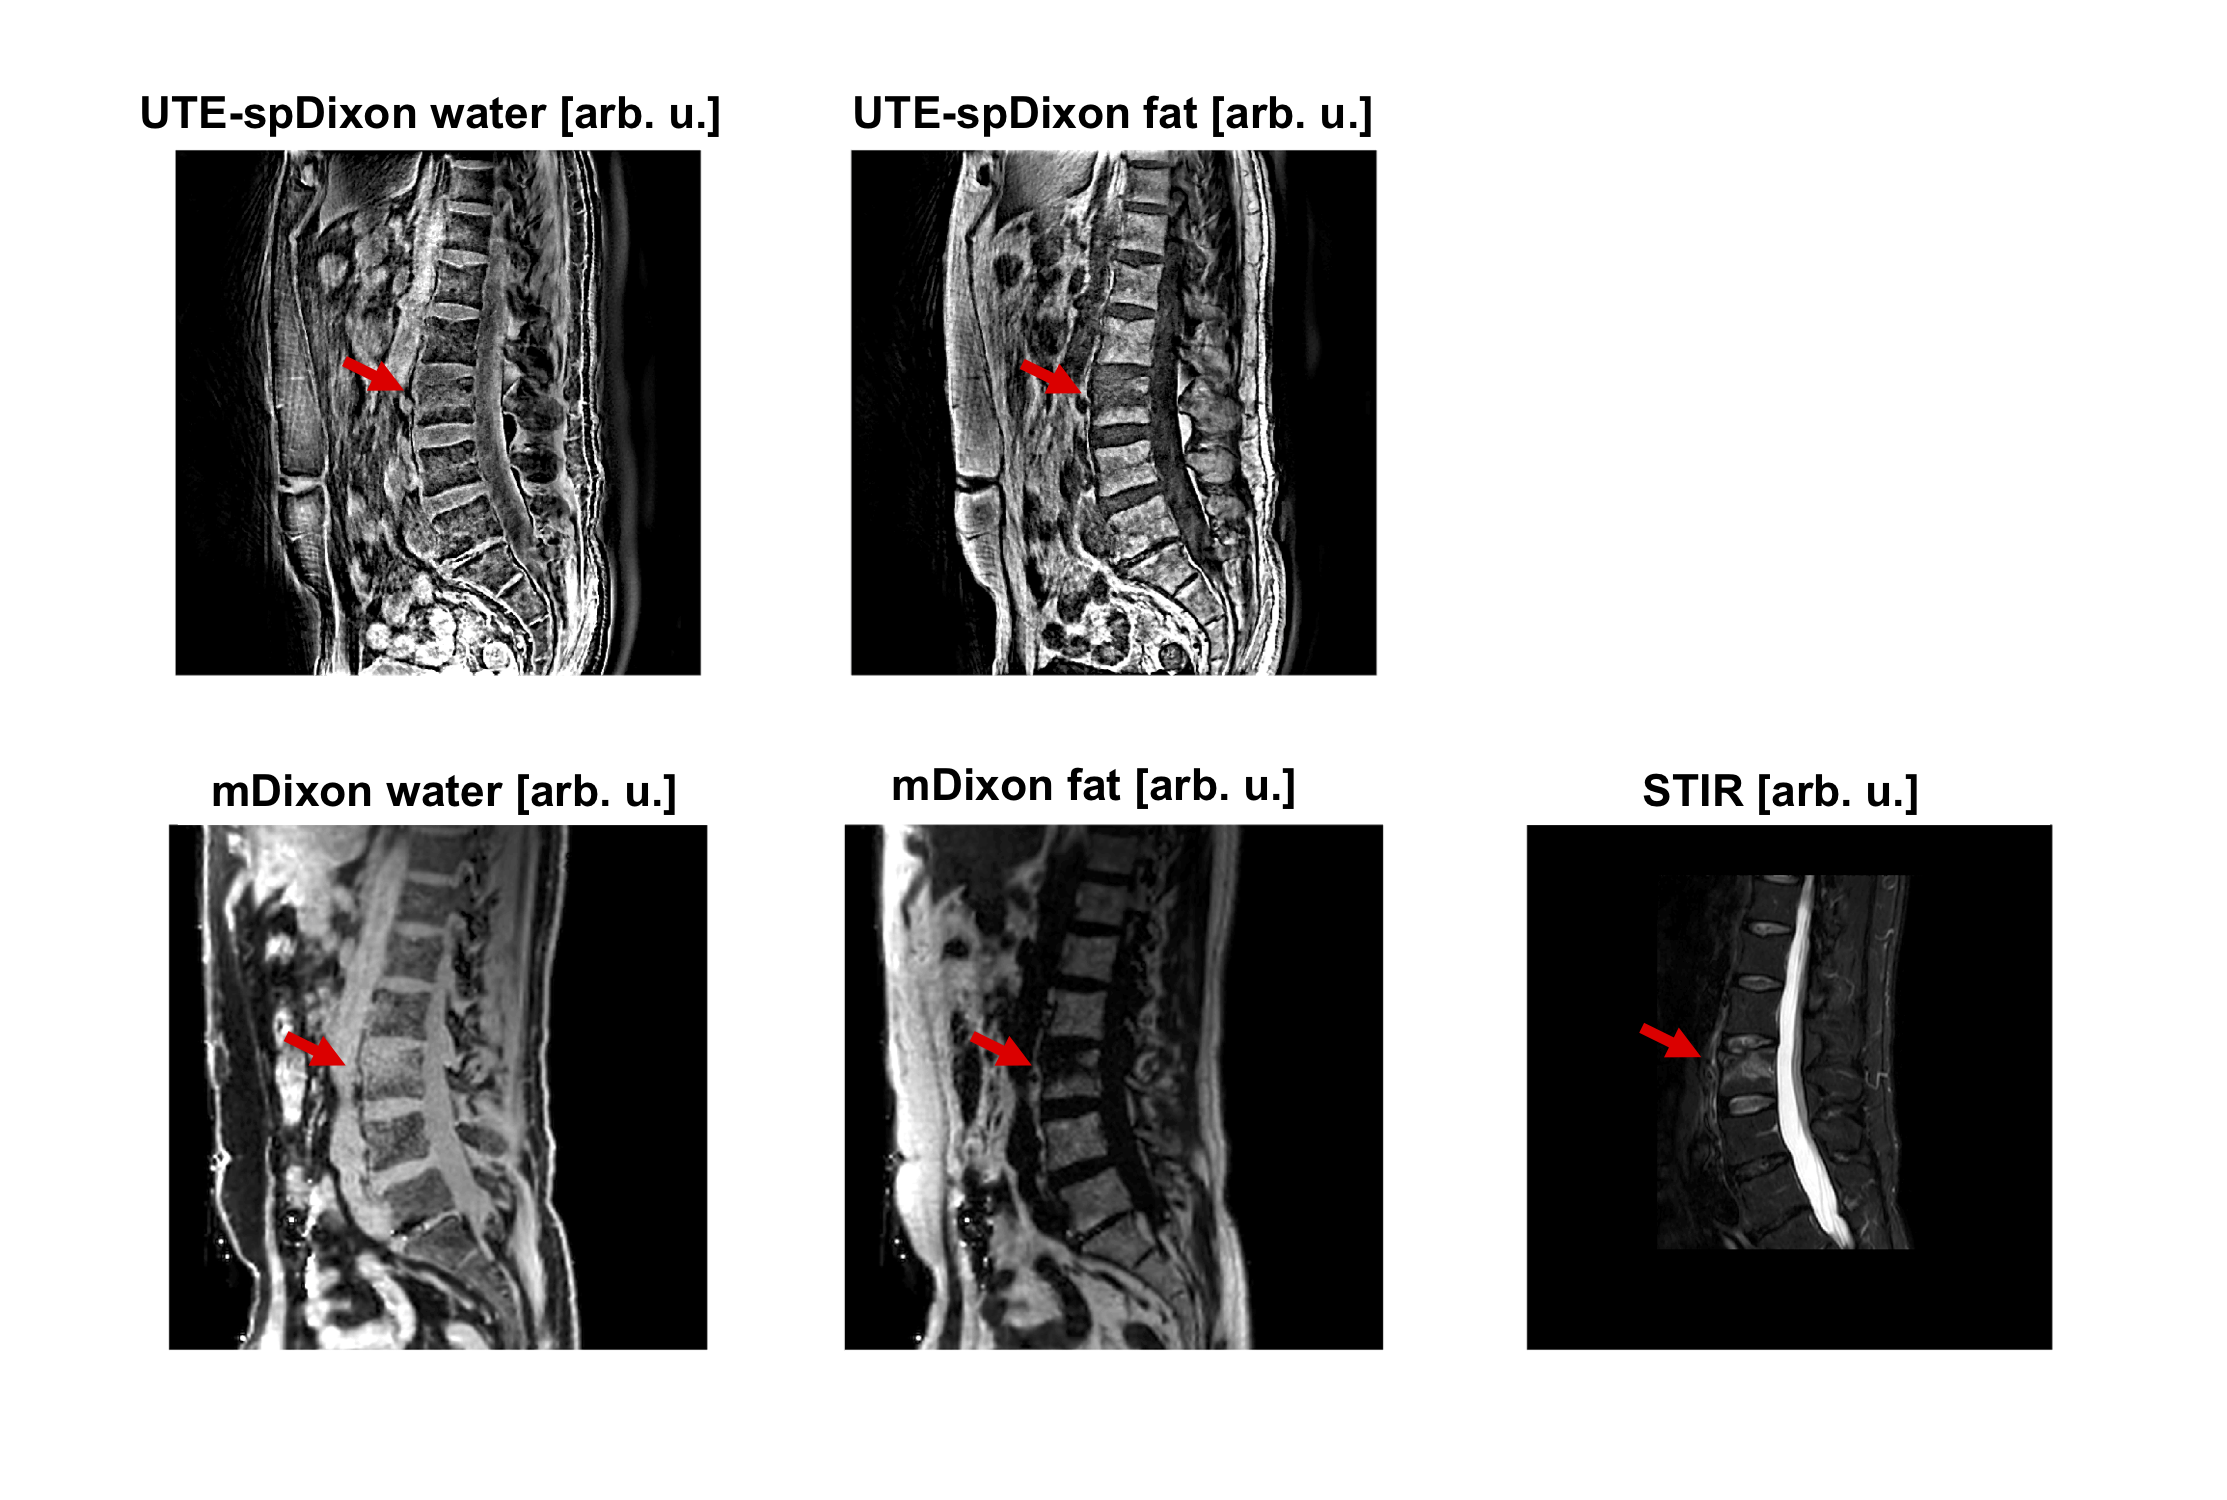
Figure 3: Comparison of a UTE spDixon, Cartesian mDixon and STIR of a patient with an acute wedge compression fracture of L3 with bone marrow edema: The STIR shows an edema-equivalent signal alteration (red arrow). The UTE scan had a higher in-plane resolution and thicker slices compared to the STIR and the mDixon scans. The bone marrow edema was visible in the spDixon maps and the contrast between water and fat comparable with the mDixon maps. In the UTE spDixon water images, there was signal within the anterior subcutaneous fat region, which is prone to artifacts due to abdominal breathing.
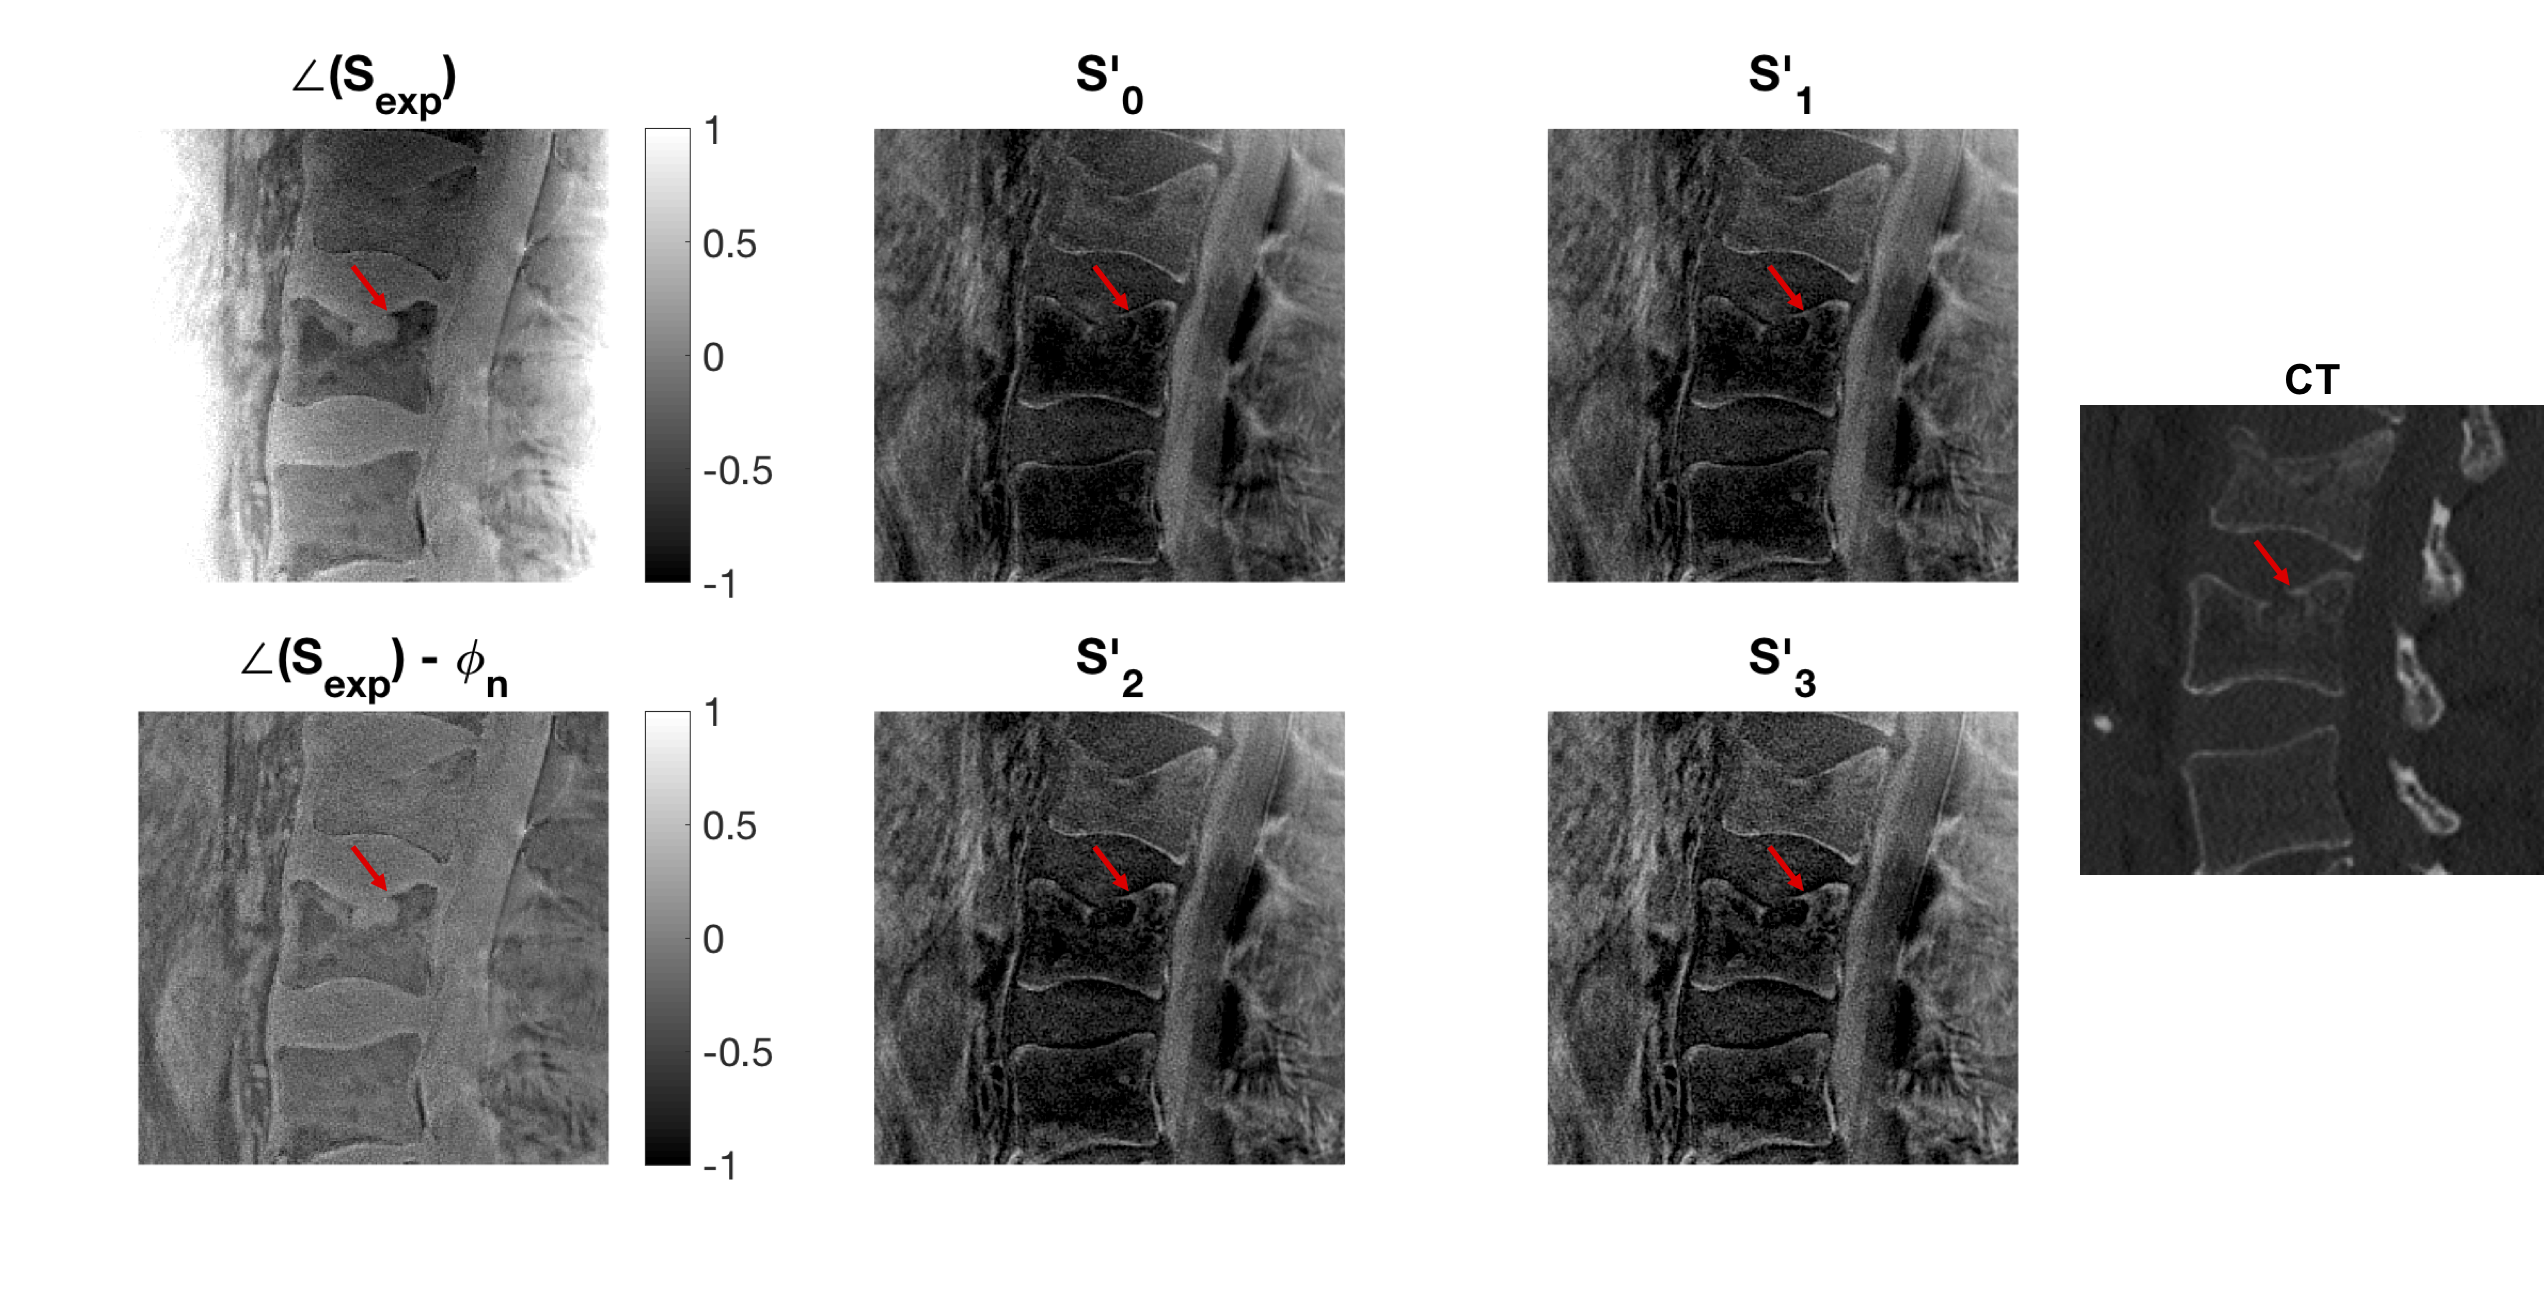
Figure 4: Comparison of UTE-SWI and conventional CT in a patient showing a prominent intravertebral disc herniation in L2. The phase of the UTE was demodulated to remove unwanted phase components. A phase mask was applied to the UTE magnitude image (S'0) to weight areas with negative phase. Applying the phase mask multiple times increased the contrast of osseous structures (red arrow) as well as tissue containing fat. Further, small amounts of noise were added to the SWI images resulting from noise in the phase images and phase masks.
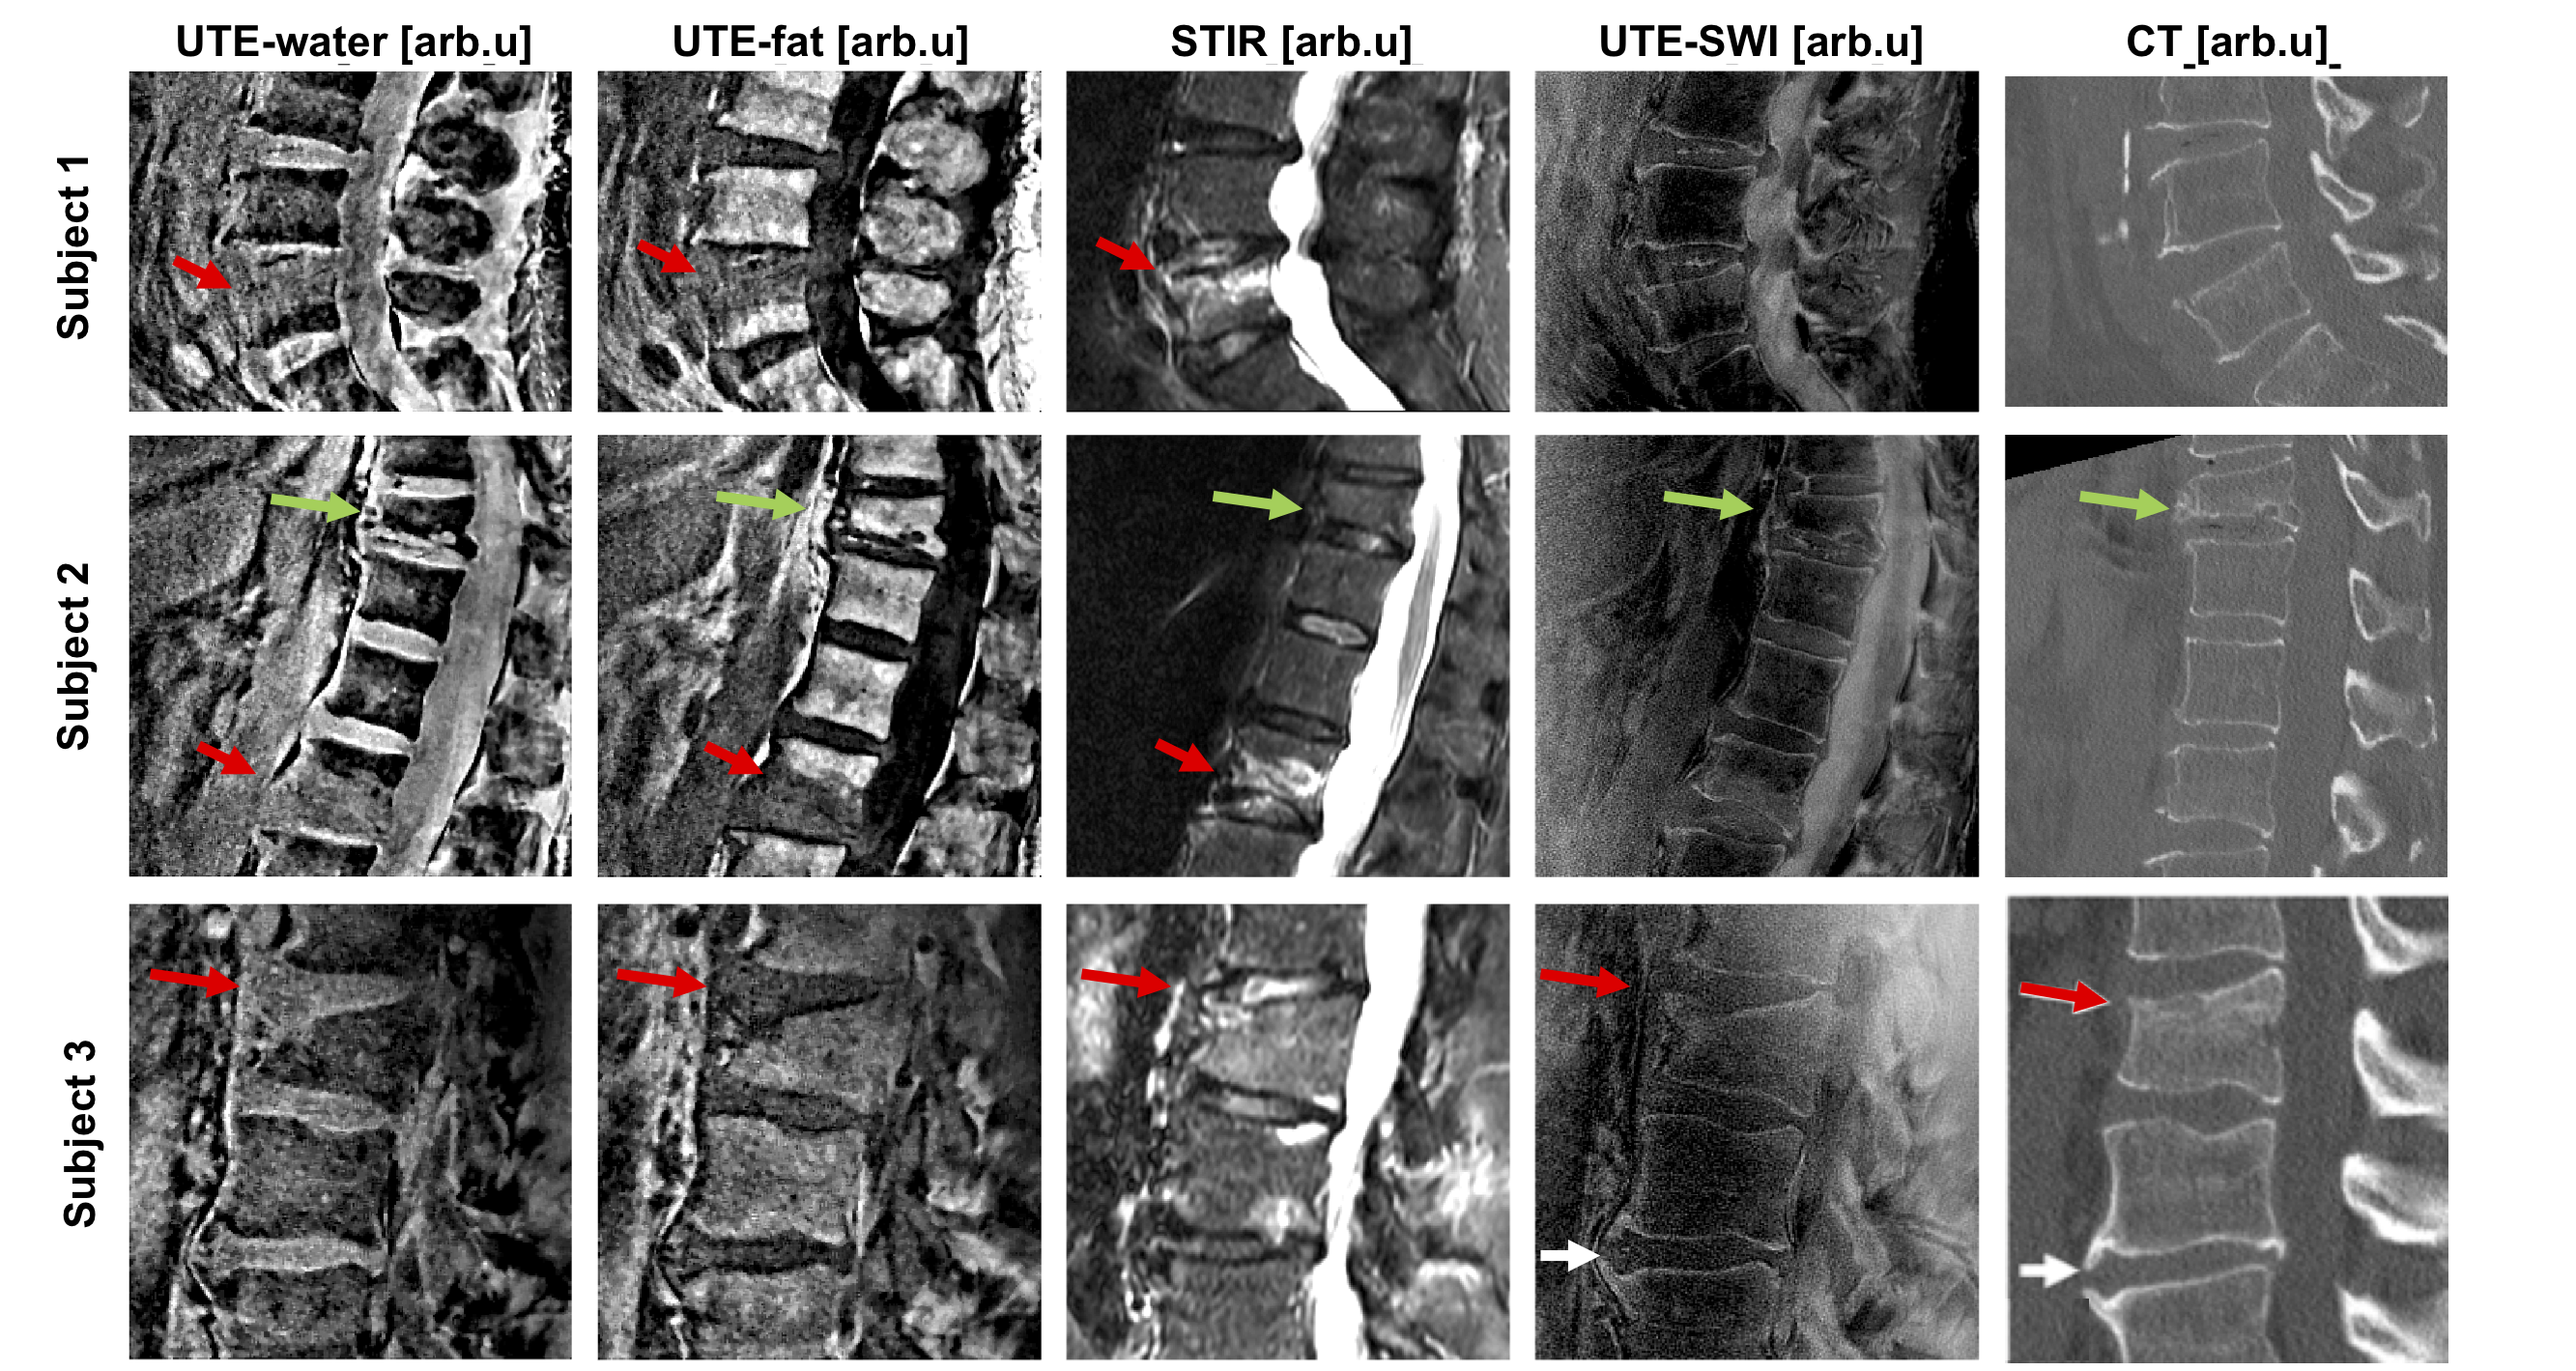
Figure 5: Comparison of spDixon, STIR, UTE-SWI and CT in three patients with acute vertebral fractures (red arrows) and bone marrow edema (S1 and S2). The edema and fracture line were visible in the spDixon Water–fat images and the SWI images. The second subject showed signs of a chronic vertebral fracture (green arrow), without signal alterations neither in the STIR nor the UTE image. The third subject showed signs of an acute vertebral fracture such as a compaction zone (red arrows) as well as ventral and a small dorsal spondylophytes (white arrows) one level lower.