0525
Transverse Relaxation Anisotropy of Tendons Studied by MR Microscopy1Department of Biomedical Imaging and Image-guided Therapy, High Field MR Centre, Medical University of Vienna, Vienna, Austria, 2CD Laboratory for Clinical Molecular MR Imaging, Vienna, Austria, 3Austrian Cluster for Tissue Regeneration, Ludwig Boltzmann Institute for Experimental and Clinical Traumatology, Vienna, Austria, 4Department of Orthopedics and Trauma-Surgery, Medical University of Vienna, Vienna, Austria, 5Center for Anatomy and Cell Biology, Division of Anatomy, Medical University of Vienna, Vienna, Austria, 6Center for Medical Physics and Biomedical Engineering, Medical University of Vienna, Vienna, Austria, 7Division of Radiological Physics, Department of Radiology, University of Basel Hospital, Basel, Switzerland, 8Department of Biomedical Engineering, University of Basel, Allschwil, Switzerland
Synopsis
In this study, we analyzed the T2* anisotropy and mono- vs. bi-exponentiality of T2* decay of Achilles and patellar tendons in vitro with a variable echo time sequence, ultrashort echo times and microscopic resolution and compared the results with histological findings. A total of four human Achilles tendons and four patellar tendons were measured at their maximum and minimum dipolar interaction (0°, 55°). In addition, one Achilles tendon and one patellar tendon were measured at 11 fiber-to-field angles (0,10,20,30,40,50,60,70,80,90°) each in order to study the change in T2* values at these angles.
Introduction
T2*-mapping can be considered a promising technique for the detection of pathological changes in tissue. A well-known property in the measurement of highly oriented collagen-rich tissues is that their T2 and T2* values are orientation dependent. This property is due to the structural composition of collagen in which the water molecules surrounding the collagen fibers move slowly and have a preferred orientation (the ensemble-averaged intramolecular 1H-1H vector is parallel to the fiber) and translational motion [1-3]. In MRI this causes a residual dipolar coupling of protons leading to orientation dependent T2/T2* decay, often simply referred to as 'magic angle effect'. In morphological MRI the tendon appears with hyperintense signal only in the region at which the bulk of the collagen fibers of the tendon are positioned close to the magic angle (~55°), but otherwise dark. The magic angle effect can lead to misinterpretation with regard to degenerations and tears, as those are visualized by a similar hyperintense signal.Another interesting feature is the often observed multiexponential character of the transverse relaxation decay (T2 /T2*), which is found in non-localized MR measurements [4, 5] and in MRI experiments with a resolution typical for whole-body MRI [6].
The objectives are:
-To investigate the T2* anisotropy of Achilles- and patellar tendons in their maximum and minimum of dipolar interaction and additionally for one Achilles- and patellar tendon each, in 10° steps from 0° to 90° using 7T MRI with an MR microscopy system together with a 3D-vTE-T2*-mapping sequence [7] using ultrashort TEs and microscopic resolution .
-Akaike information criterion (AICC) [8] and F-test [9] where used to determine which model, i.e. mono- vs. bi- exponential decay model, is the preferred one for each voxel. All MR results were compared to histology.
Methods
Four Achilles- and four Patellar tendons from four body donors (mean age: 87, 2m, 2f) were obtained from the Center for Anatomy and Cell Biology (LH) in accord with the terms of the local ethics committee.MR-microscopy was performed on a 7T scanner (Siemens Healthineers, Germany) using a microimaging system (RRI, USA) and a 39 mm diameter volume resonator (Rapid Biomedical, Germany). All Achilles- and patellar tendons were measured in their maximum and minimum dipolar interaction, i.e. angles of 0 and 55° respectively. Additionally, one Achilles tendon and one patellar tendon each were measured at a total of 11 fiber-to-field angles: 0,10,20,30,40,50,55,60,70, 80,90°.
For vTE T2* mapping the protocol was: 40 TEs: 0.66-51.62ms; TR = 32ms; in-plane pixel size = 98x98µm2; slice thickness = 400µm; FOV = 30x30mm2 and matrix size = 320x320.
For each voxel the mono and biexponential T2* decay was calculated in accordance with our previous study [10].
Results
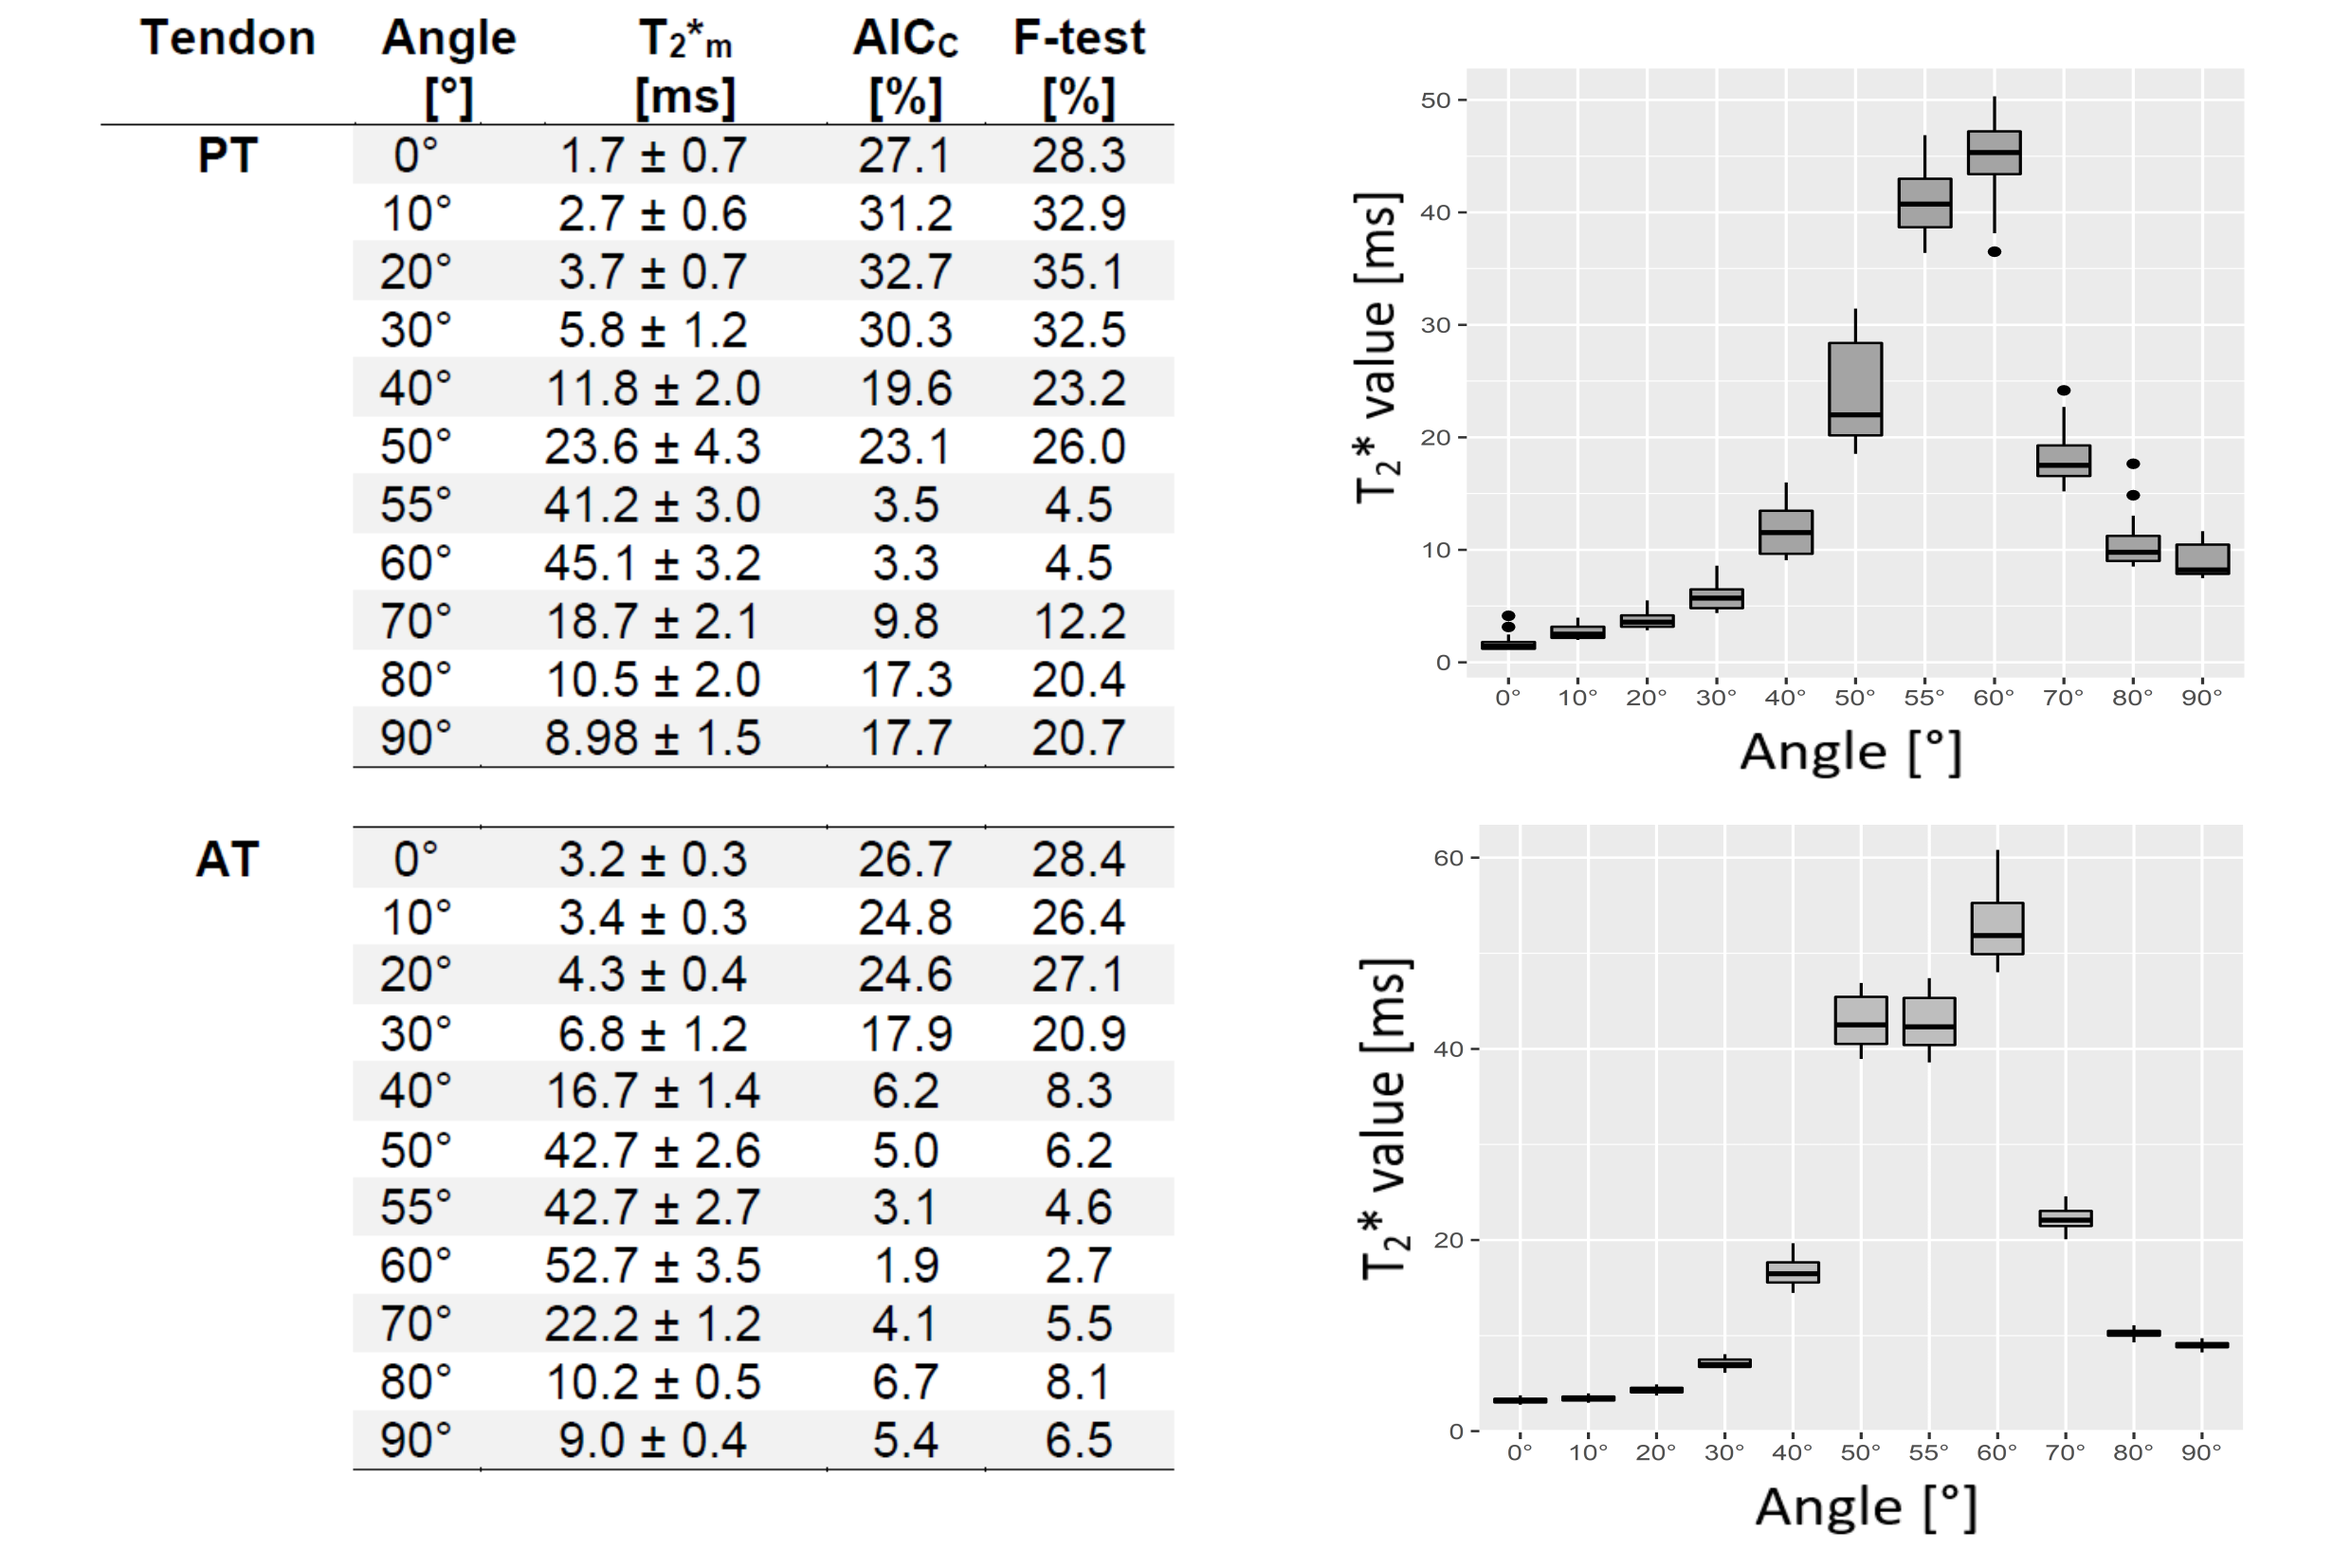
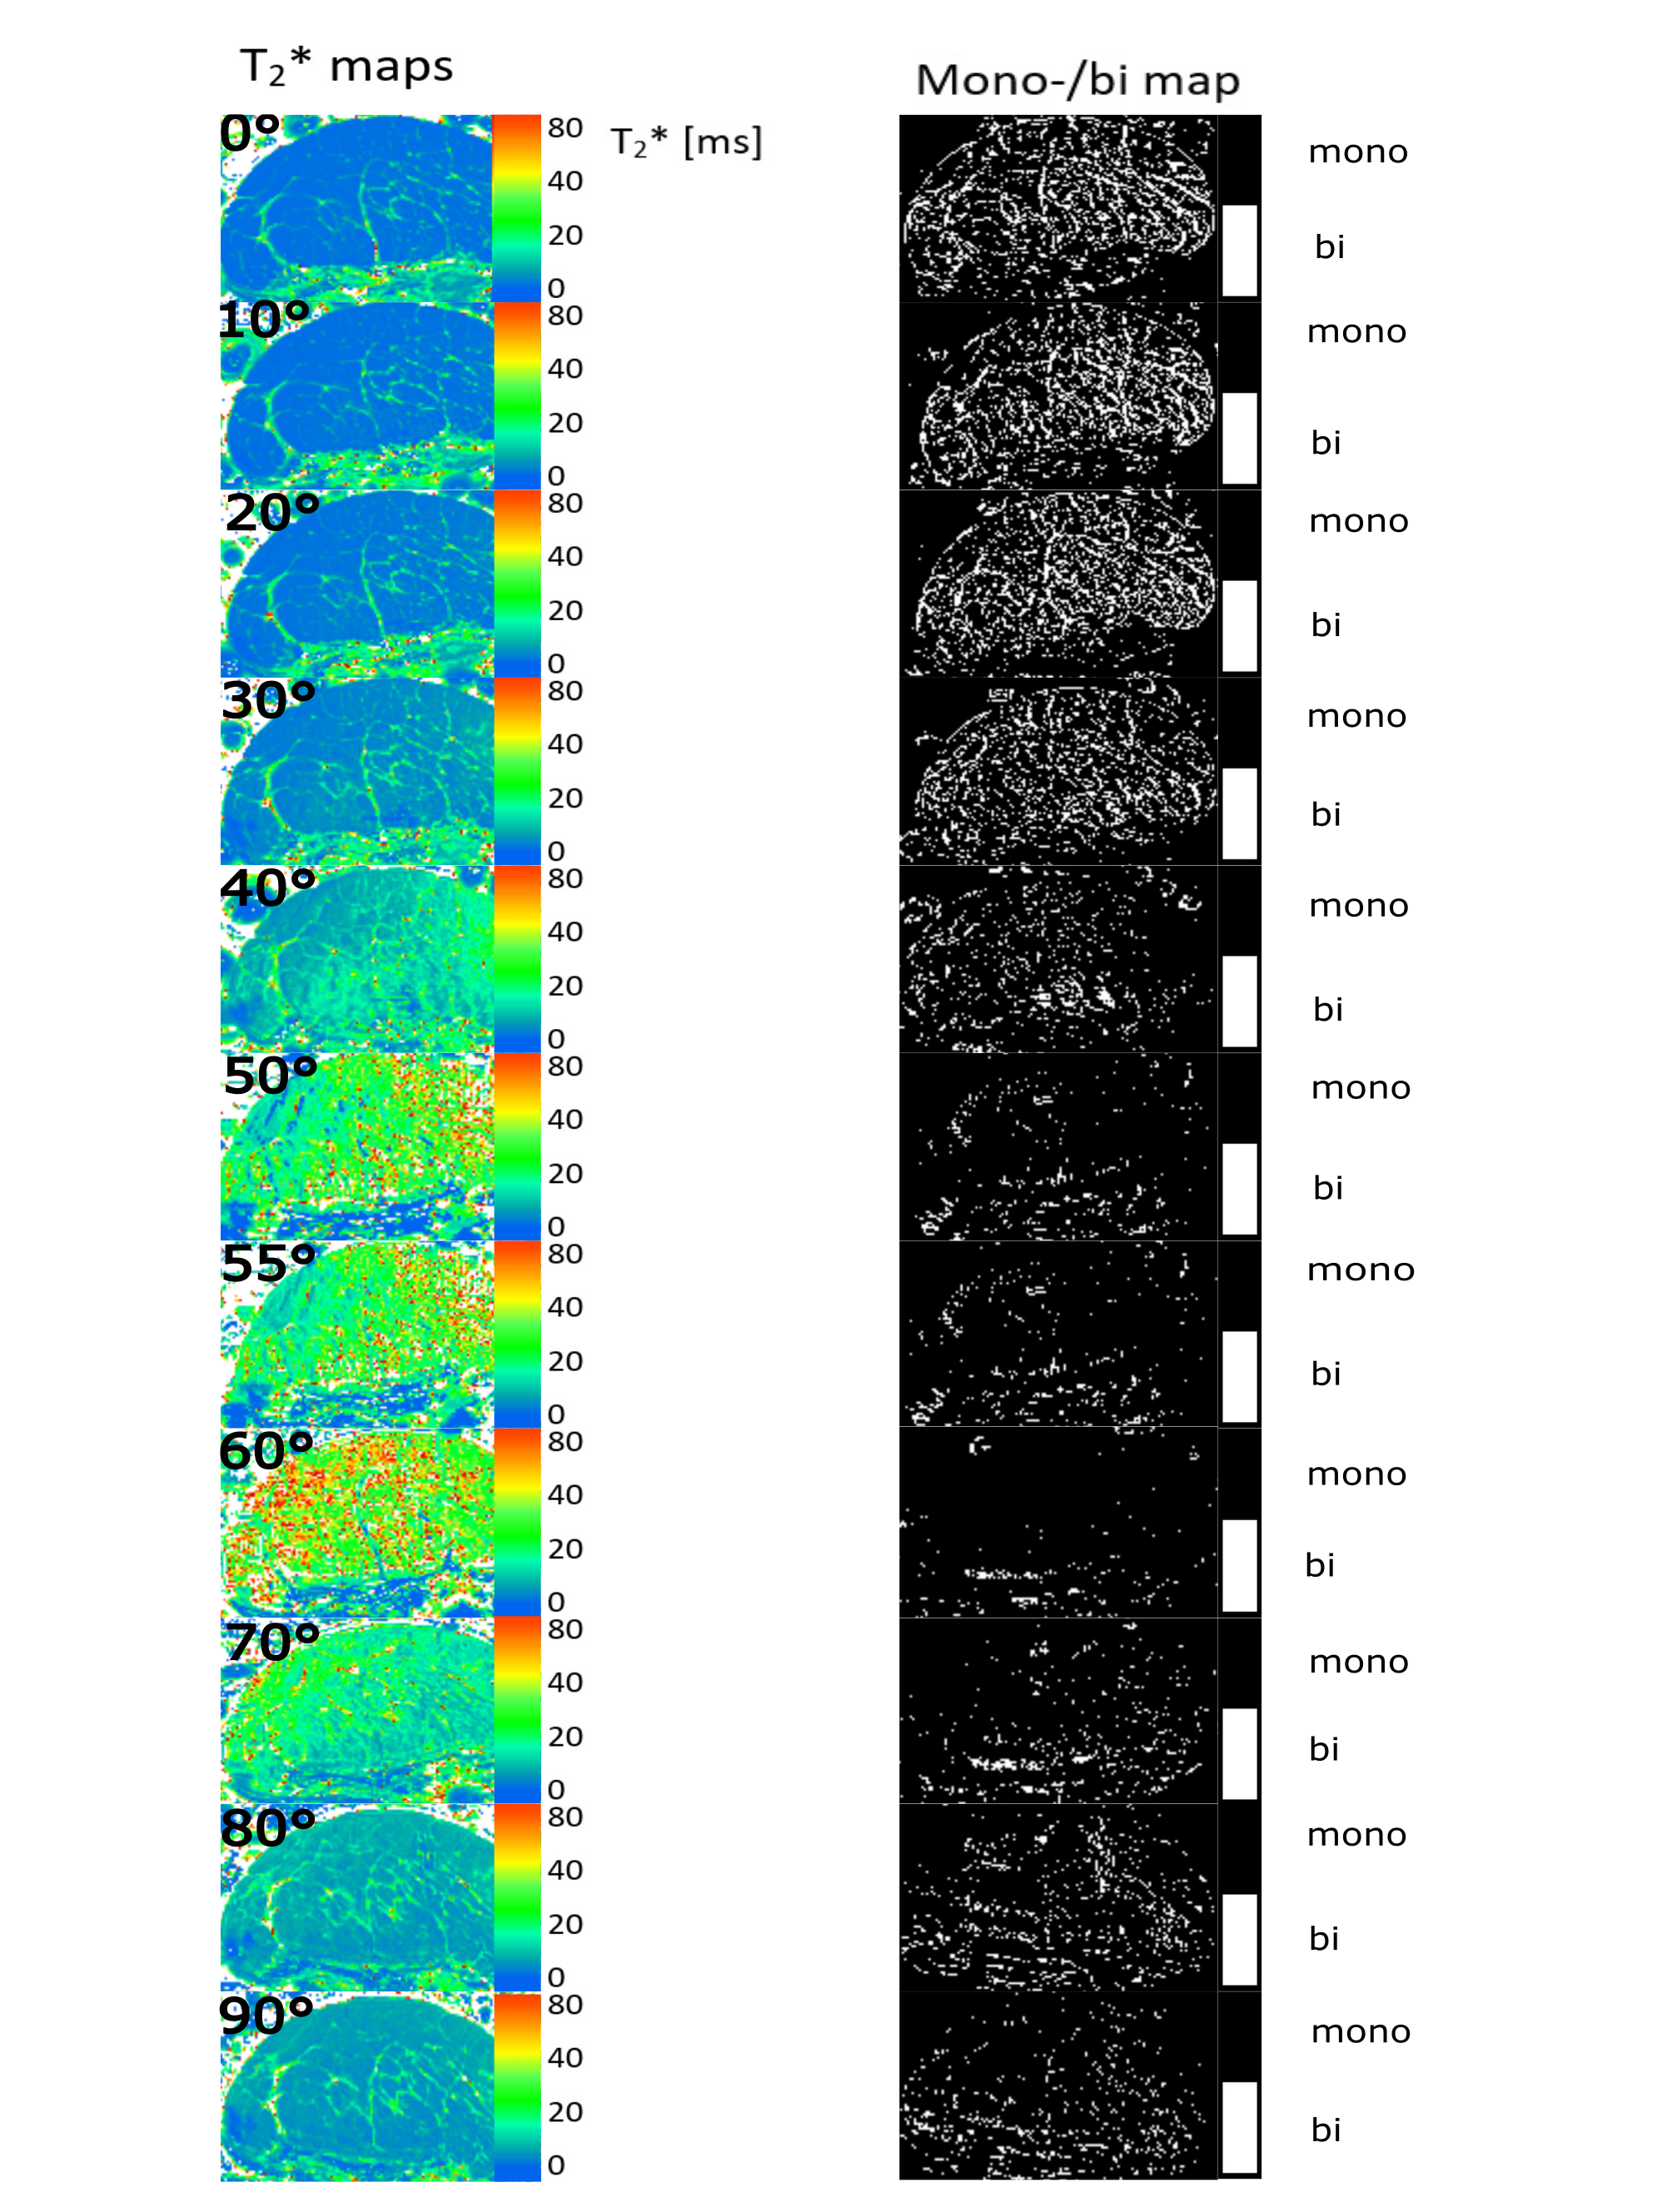
The monoexponentially calculated T2* values (T2*m) of the Achilles- and patellar tendons were 9-23-fold increased when comparing 0° with 55° (Fig.1). In regions identified as fascicle bundles, the increase was found to be even 50-fold when comparing 0 and 55° , while in regions of the interfascicular matrix (especially the endotenon) no particular orientation dependence of T2*m was found. They are approximately 10ms at 0° and also at 55° (Fig.2,4).The results of the two tendons measured at 11 angles are shown in Figure 3. The T2* maps and the maps showing which voxels are preferentially bi-exponential of the Achilles tendon measured at 11 angles are shown in Figure 4.
Discussion and Conclusion
The T2* values differ considerable between 0° and 55°, but also when T2* values in 10° steps are compared, which strongly illustrates the problem of T2* mapping of tendons. With only a 10° difference, the values can already increase by approximately 100% (see angles 30 and 40°) which makes the use of T2* for the detection of degenerations difficult, as these degenerative changes usually have much less impact on T2* values.The results also show that the regional differences in the T2* values are due to the heterogeneous structure of the tissues and that these regional differences have a dominant influence on the resulting fiber-to-field dependence and the respective mono vs. biexponential decay of the T2*.
The tendon consists of a dominant fascicle part and a non-fascicle part (i.a. endotenon and paratenon), which mainly consists of water and proteoglycan. These non-collagenous components have previously not been taken into consideration in T2* mapping studies mainly because the resolution with which these studies were conducted was either insufficient or non-existent (non-localized MR experiments) in order to visualize them. However, their possible influence on multicomponent T2* decay has been suggested previously [5].
In the fascicle regions, the T2* anisotropy is much stronger, while the T2* values of the endotenon seem to be unaffected by the angle, which is to be expected since the water in such sub-tissues is quite free. Almost no voxels at angles close to the magic angle can be considered bi-exponential, since there the T2* values of the fascicles tend to reach those of the endotenon. Our results show that T2*-mapping of tendons is much more complex than previously thought, especially when analyzed using bi-exponential T2* fitting, and that tissue heterogeneity and voxel size play a major role in this context.
Acknowledgements
The financial support by the Austrian
Federal Ministry for Digital and Economic Affairs and the National Foundation
for Research, Technology and Development is gratefully acknowledged.
References
[1] Tourell, M.C. and K.I. Momot, Molecular dynamics of a hydrated collagen peptide: insights into rotational motion and residence times of single-water bridges in collagen. The Journal of Physical Chemistry B, 2016. 120(49): p. 12432-12443.
[2] Fullerton, G.D. and A. Rahal, Collagen structure: the molecular source of the tendon magic angle effect. J Magn Reson Imaging, 2007. 25(2): p. 345-61.
[3] Momot, K.I., J.M. Pope, and R.M. Wellard, Anisotropy of spin relaxation of water protons in cartilage and tendon. NMR in Biomedicine, 2010. 23(3): p. 313-324.
[4] Peto, S. and P. Gillis, Fiber-to-field angle dependence of proton nuclear magnetic relaxation in collagen. Magn Reson Imaging, 1990. 8(6): p. 705-12.
[5] Henkelman, R.M., et al., Anisotropy of NMR properties of tissues. Magn Reson Med, 1994. 32(5): p. 592-601.
[6] Du, J., et al., Magic angle effect in magnetic resonance imaging of the Achilles tendon and enthesis. Magn Reson Imaging, 2009. 27(4): p. 557-64.
[7] Deligianni, X., et al., High-resolution Fourier-encoded sub-millisecond echo time musculoskeletal imaging at 3 Tesla and 7 Tesla. Magn Reson Med, 2013. 70(5): p. 1434-9.
[8] Akaike, H., Information theory and an extension of the maximum likelihood principle. in Petrov, B.N.; Csáki, F., 2nd International Symposium on Information Theory, Tsahkadsor, Armenia, USSR, September 2-8, 1971, Budapest: Akadémiai Kiadó, 1973: p. 267-281. 26.
[9] Yuan, J., et al., Statistical assessment of bi-exponential diffusion weighted imaging signal characteristics induced by intravoxel incoherent motion in malignant breast tumors. Quant Imaging Med Surg, 2016. 6(4): p. 418-429.
[10] Hager, B., et al., Orientation dependence and decay characteristics of T2* relaxation in the human meniscus studied with 7 Tesla MR microscopy and compared to histology. Magnetic resonance in medicine, 2019. 81(2): p. 921-933.
Figures
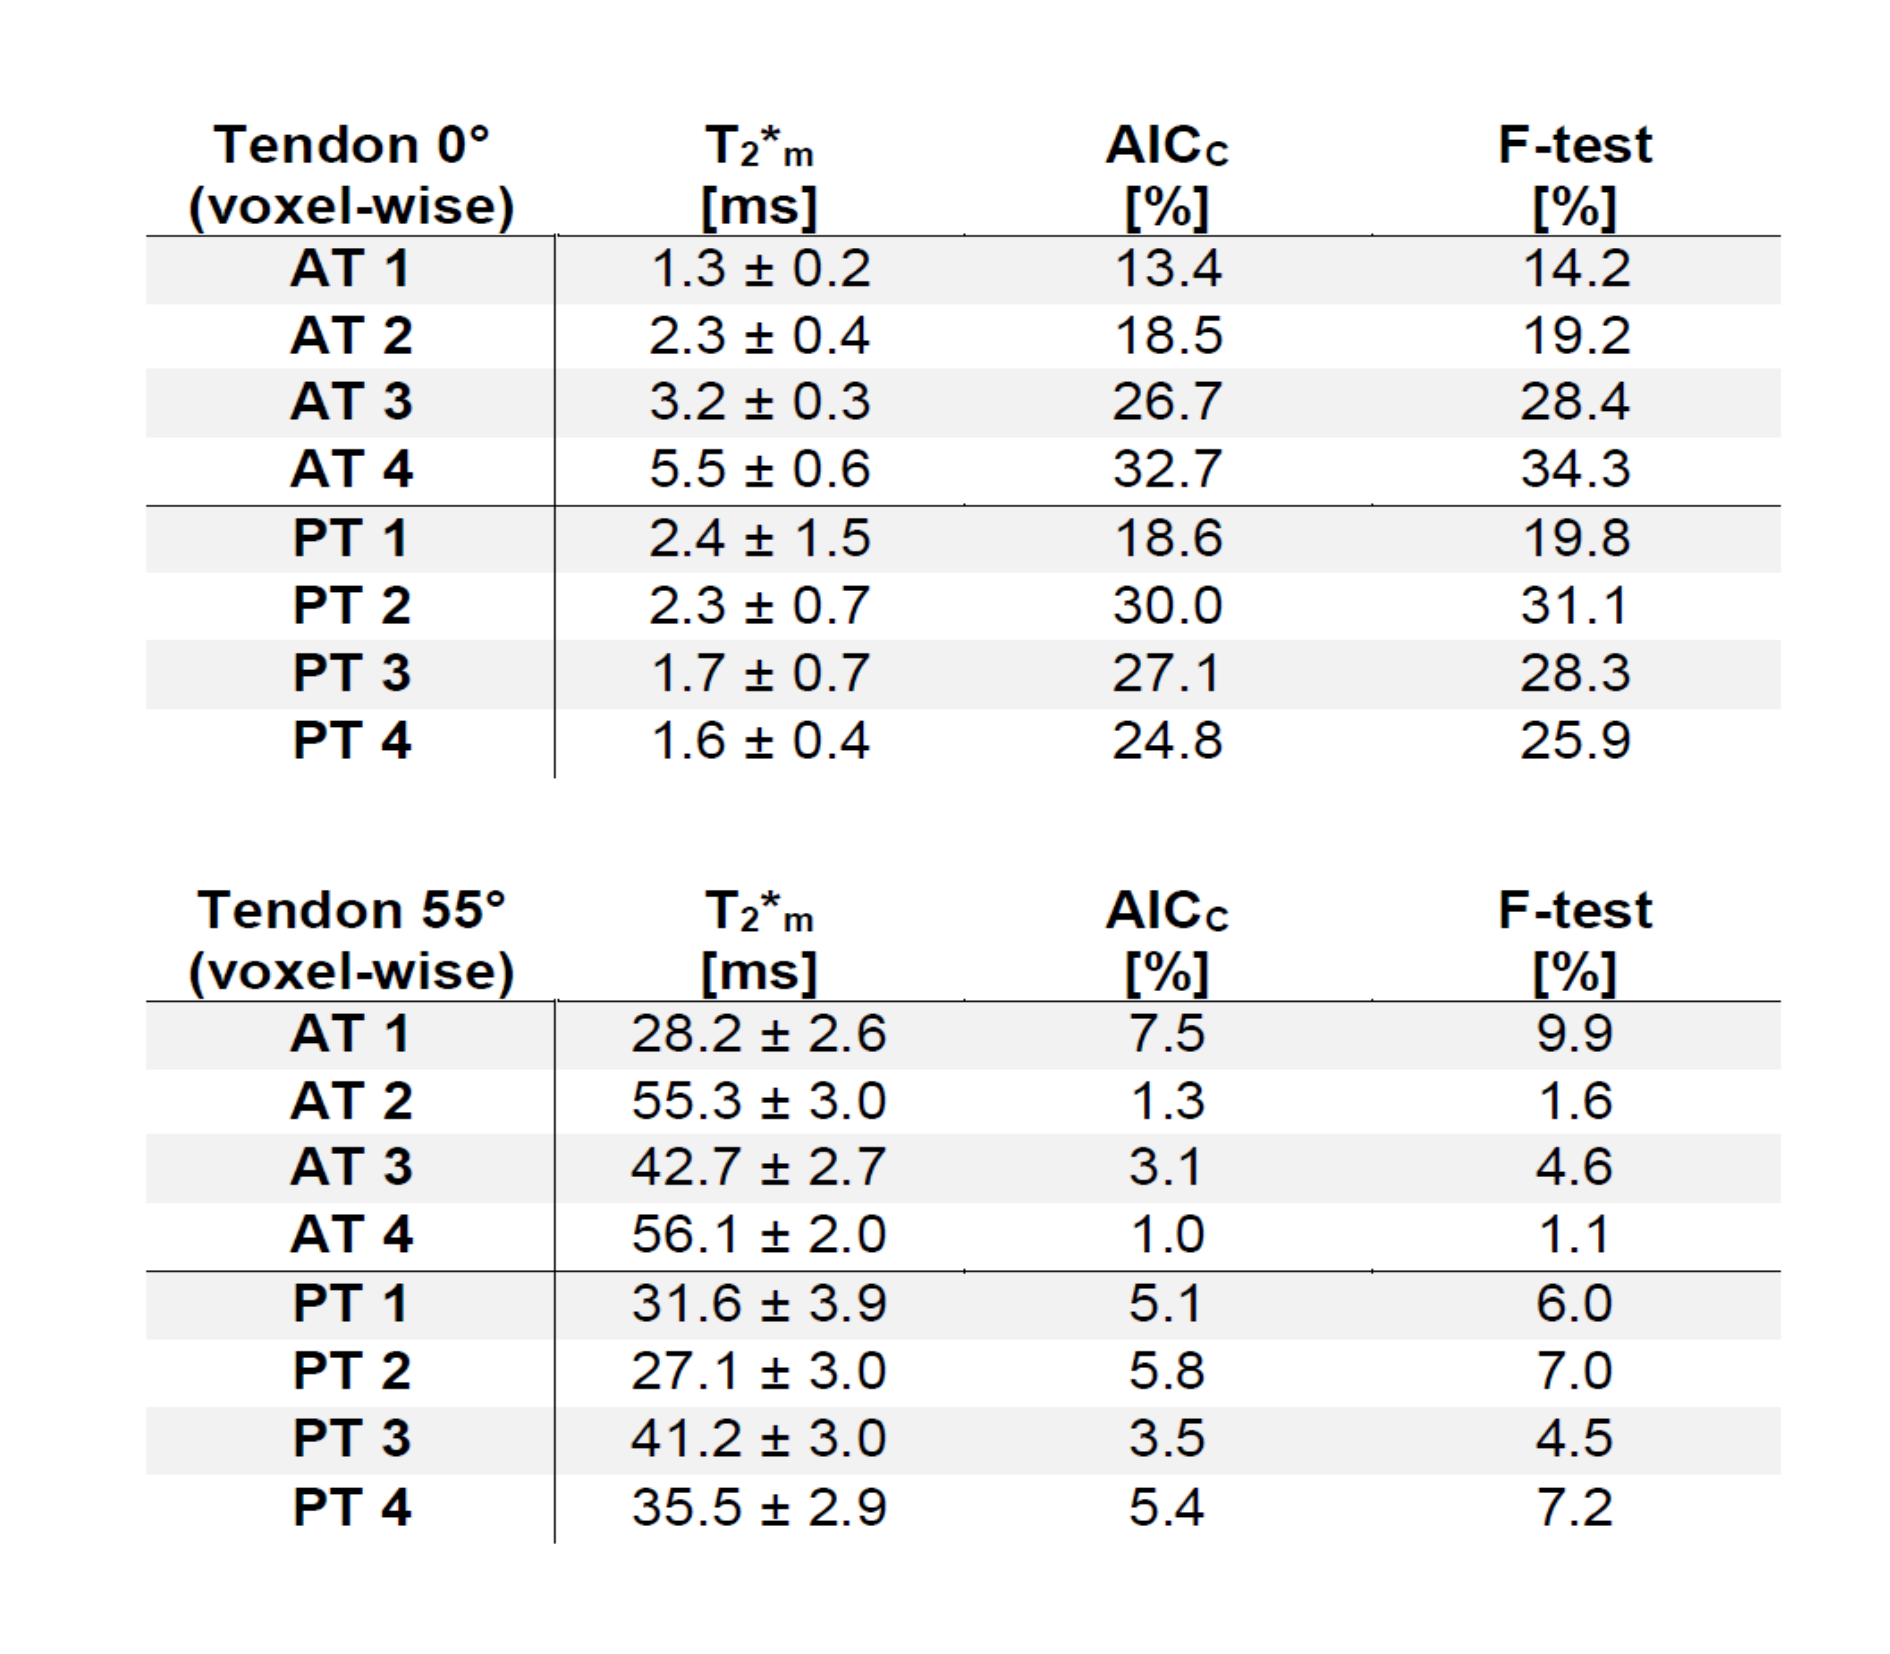
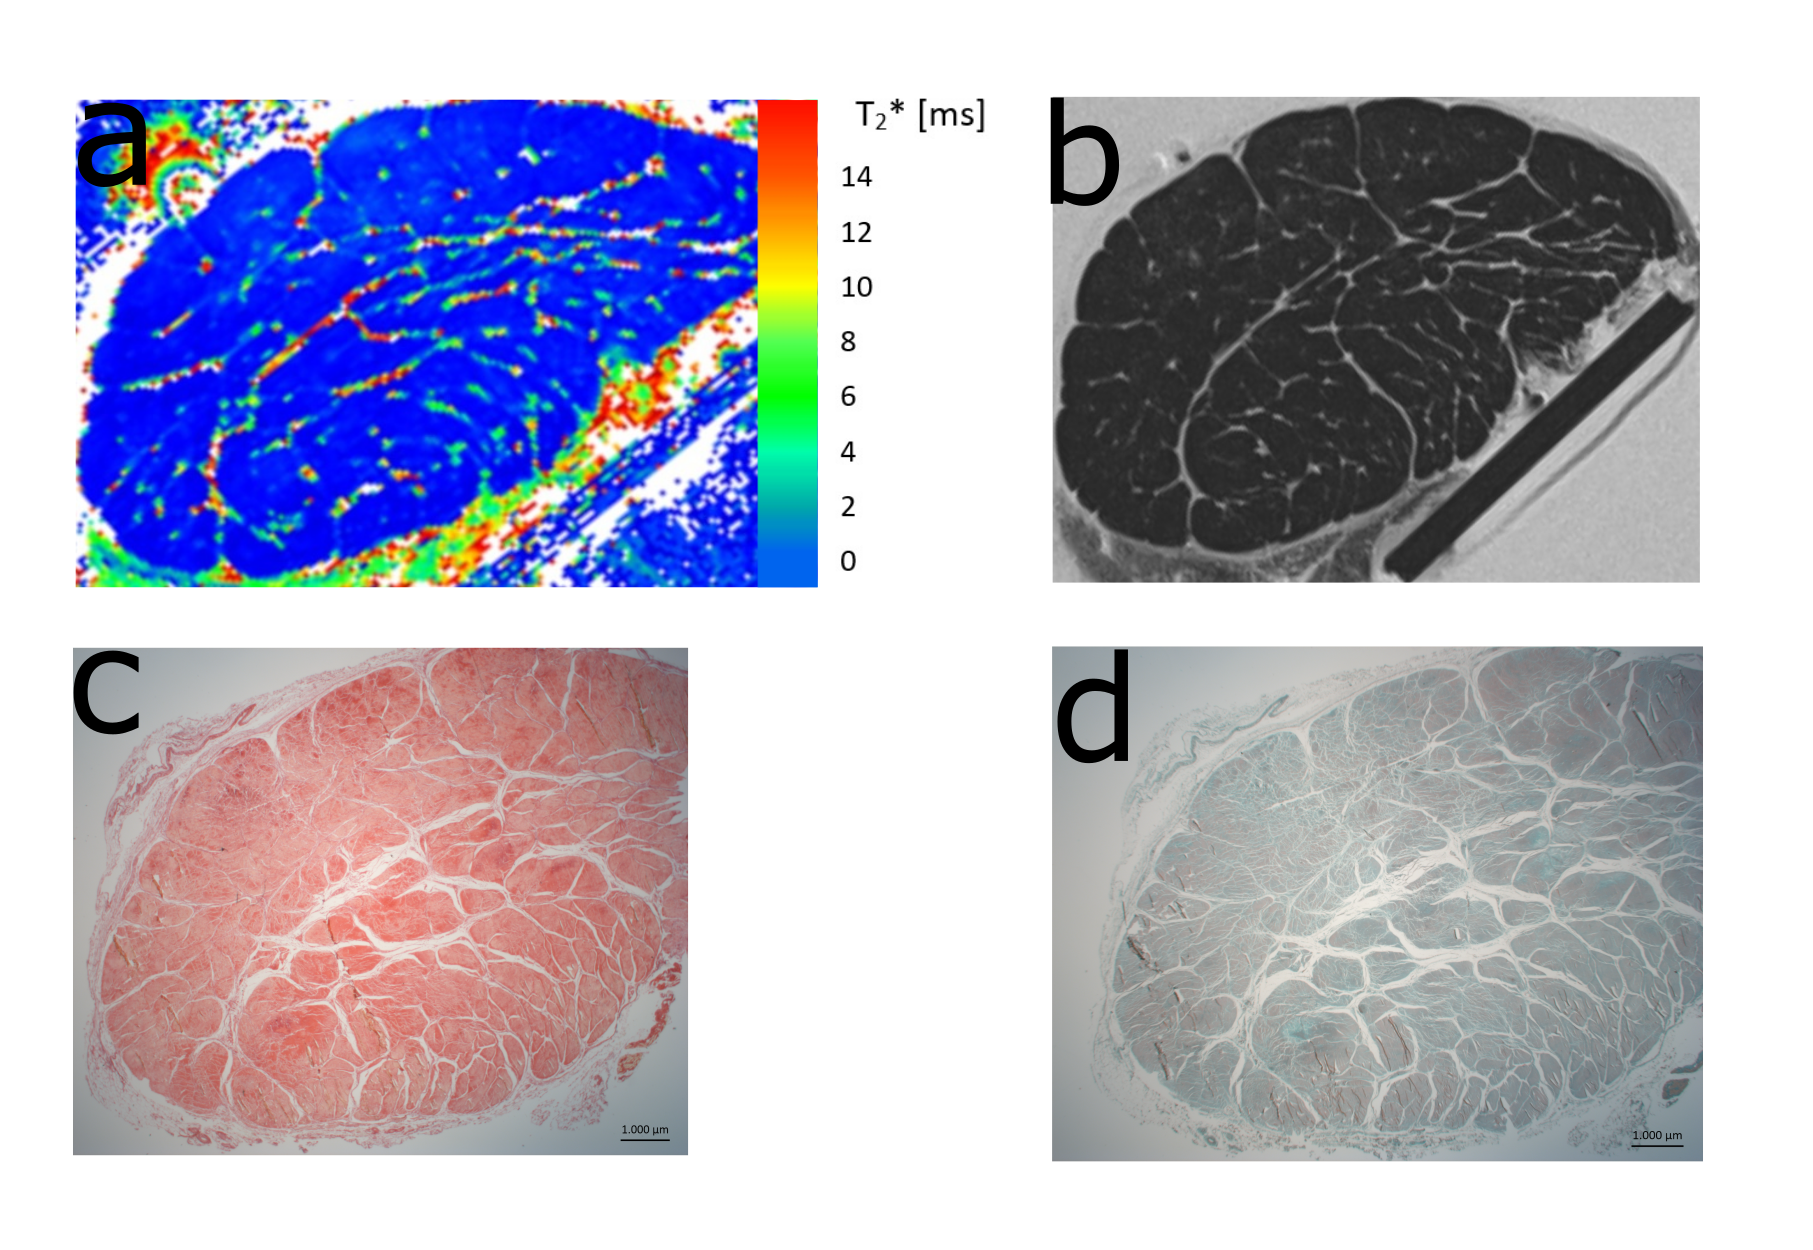
Figure 2 a) Representative T2* map of one tendon measured at 0° shows the difference between T2* values of fascicle bundles and non-fasicle connective tissue (endotendon, epitenon). This difference is also visible in a morphological T2 weighted image (TE= 6.6ms) (b).
c,d) Histological assessment was performed with Picrosirius red staining and polarized light microscopy as well as Safranin-O staining. The shape of the fiber bundles and the connective tissue between them are clearly visible.