0524
2D Texture Analysis based approach for detection of Osteoporosis on 1.5T on T1-weighted MR images1Stavya Spine Research Institute, Ahmedabad, India, 2MR, Philips Innovation Campus, Bangalore, India, 3Philips India Limited, Gurgaon, India
Synopsis
Given the prevalence and disease burden of osteoporosis, it is critical to detect it as early as possible. This is challenging not only because the disease is typically asymptomatic but also due to known limitations of the gold standard method of DEXA. The aim of this study was to determine if alternative approach of 2D texture analysis in L1-L5 lumbar spine on T1W images can be used to detect osteoporosis. It is demonstrated that such an approach can indeed be used to clinically detect osteoporosis with an AUC of 0.8.
Background
Osteoporosis is a systemic skeletal disease that causes loss of bone strength due to low bone mass and deterioration of bone microarchitecture1 leading to increased risk of bone fractures. Therefore, early detection of osteoporosis is critical for early intervention to reduce the fracture risk, better disease management and improved patient quality of life. Bone mineral density (BMD) measurement is a critical step in diagnosis of osteoporosis with dual energy x-ray absorptiometry (DEXA) being the gold standard technique and femoral neck being the gold standard site1. However, there are several drawbacks with this methodology of BMD measurement including exposure to ionizing radiation and vulnerability to biased results1. MRI, on the other hand, is a non-ionizing imaging modality that provides better soft tissue contrast and can be repeatedly used without any known side effects to patients. In a clinical scenario, patient typically walks in with symptoms unrelated to osteoporosis, such as back pain, for which a MRI exam is often performed2. Also, studies have shown that bone marrow signal intensity on T1W images is correlated to osteoporosis3. Texture analysis/Radiomics has been used on MR images for tumor characterization and grading4. Recent study has shown that combining MR images of Spine with texture analysis enables detection of osteoporosis5. In this study, we investigate the use of a single slice approach on the five lumbar vertebrae, at different anatomical sites on T1W images for detecting osteoporosis.Methods
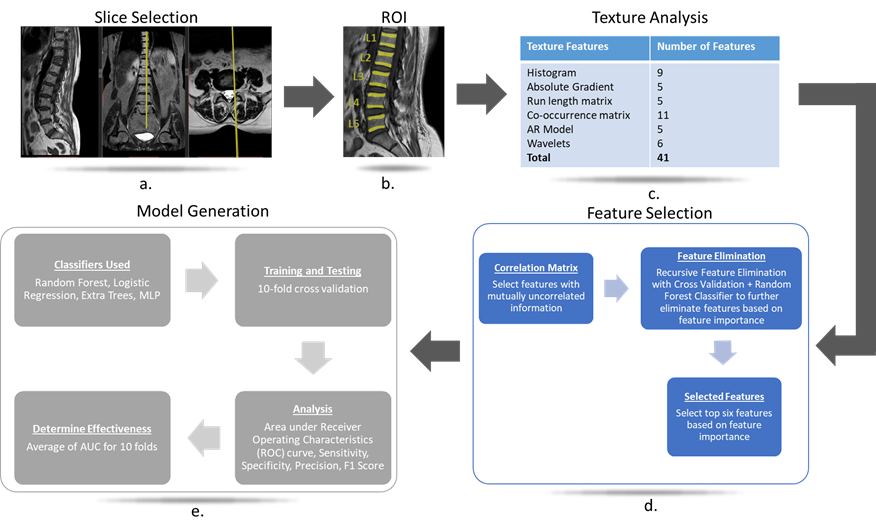
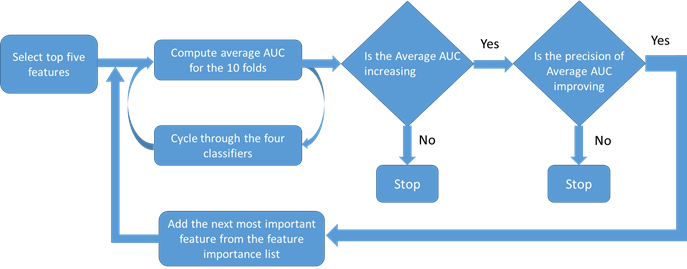
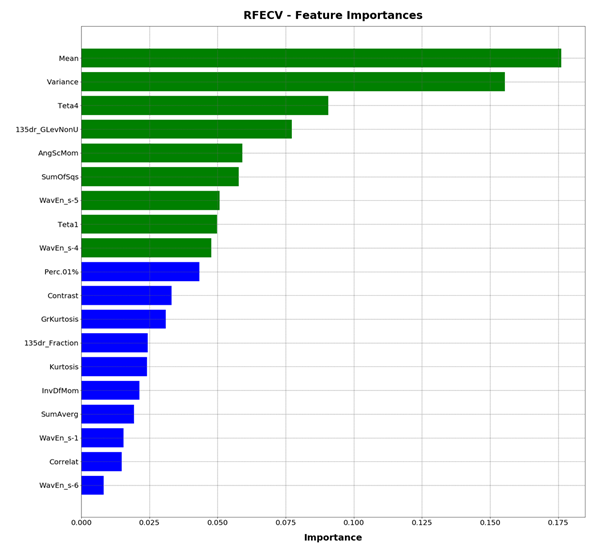
In this EC approved study, 91 subjects were evaluated, who underwent routine spine MRI at a 1.5T MRI scanner (Multiva, Philips Healthcare, Best, The Netherlands) using product whole spine coil and DEXA scans for BMD measurements. T1W images were acquired using a TSE protocol with the following parameters ETL: 7, TE/TR 8ms/55.3ms, Voxel size: 0.68 mm/0.93mm/4mm, and a matrix of 339/247/15 in frequency/phase/slice direction. 15 patients with considerable scoliosis and/or spine implants were excluded. Patients were diagnosed with osteoporosis based on DEXA t-scores and their medical history. The classification process is shown in Figure 1. L1-L5 vertebrae were chosen on Sagittal T1W images as shown in Figure 1.a. ROIs were drawn manually on L1-L5 vertebrae as shown in Figure 1. b except in cases where one or multiple lumbar vertebra/e had collapsed. Texture features were computed using MaZda software (MaZda 4.6, The Technical University of Lodz, Institute of Electronics)6. The categories of features that were extracted are shown in Figure 1.c. The Wavelet features were averaged Eg. WaveEn-S1 = Mean(Wave HH S-1, Wave HL S-1, Wave LH S-1, Wave LL S-1). Similarly, the GLCM features were averaged eg. AngScMom = Average of all AngScMoms computed for neighboring pixels. Feature selection and model generation for classification was done on Python programming software, version 3.6. The methodology for feature selection and classification is shown in Figure 1.d and Figure 1.d respectively. For feature selection, a correlation matrix was generated for all the texture features of which, features with a score of >0.9 were discarded. Subsequently, Recursive Feature Elimination with Cross Validation (RFECV) approach was used select features that provided highest accuracy. For this approach, the entire dataset was used with ten splits using StratifiedkFold approach and random forest classifier. Feature importance graph was generated as shown in Figure 3. ROC analysis was then done for four classifier algorithms Extra Trees, Logistic Regression, MLP and Random Forest. Performance parameters Area under the curve (AUC), sensitivity, specificity, precision, accuracy and f1 score were computed using a 10-fold StratifiedKFold cross validation approach. Model development approach is shown in Figure 2 during which the number of texture features, used for model generation, are optimized to provide higher precision and average AUC.Results
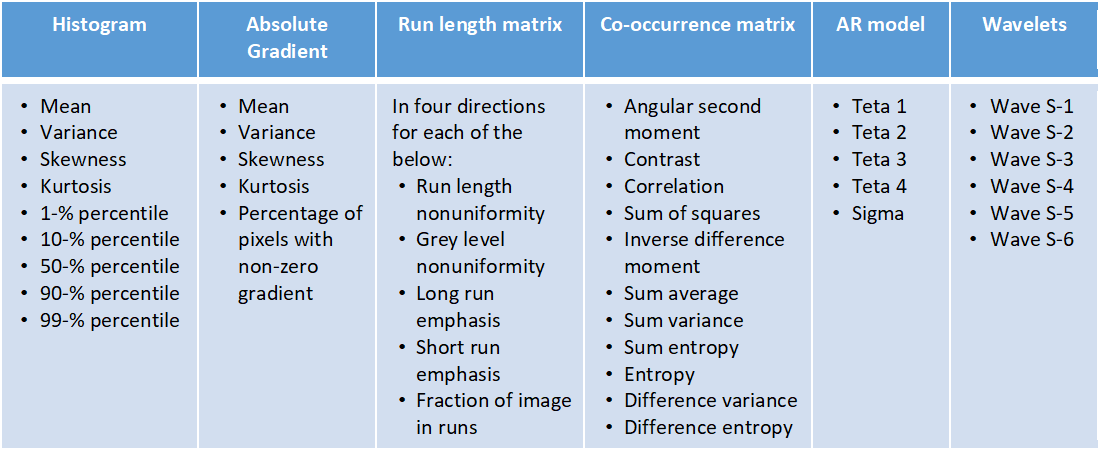
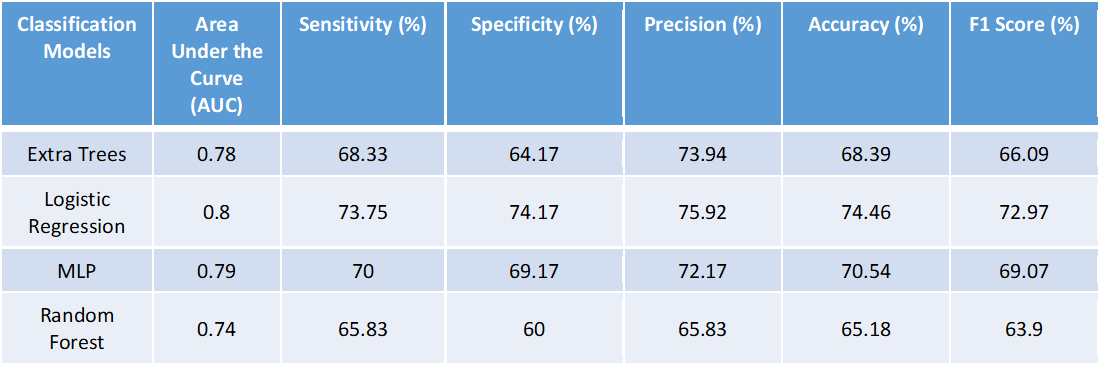
76 patients were included for this study; 38 without osteoporosis and 38 with osteoporosis. A total of 151 texture features were computed using MaZda software. Haralick and Wavelet features were averaged which reduced the number of features to 56 are shown in Table 1. 35 features with mutually correlated information were excluded through correlation matrix. Subsequently, 2 more features were excluded through RFECV. The final 19 features are listed in Figure 2. The classifier models were then generated for each of the four classifiers. The model was generated using 9 features shown in green in Figure 3. The final performance parameters for each of the classifiers are shown in Table 2.Discussion
Optimal model performance was achieved using 9 texture features. Results show that Logistic Regression model has the best performance. The precision of average AUC for the four models suggests that the 9 texture features, chosen for generation of the classifier model, are robust and effective irrespective of the classifier chosen. The performance of the model is improved in comparison to what has been reported previously. Thus, it is demonstrated that the proposed methodology can be used in a clinical setting on 1.5T systems on T1-weighted images to detect osteoporosis.Acknowledgements
No acknowledgement found.References
(1) Kanis, J. A. Diagnosis of Osteoporosis and Assessment of Fracture Risk. The Lancet 2002, 359 (9321), 1929–1936. https://doi.org/10.1016/S0140-6736(02)08761-5.
(2) Patel, N. D.; Broderick, D. F.; Burns, J.; Deshmukh, T. K.; Fries, I. B.; Harvey, H. B.; Holly, L.; Hunt, C. H.; Jagadeesan, B. D.; Kennedy, T. A.; O’Toole, J. E.; Perlmutter, J. S.; Policeni, B.; Rosenow, J. M.; Schroeder, J. W.; Whitehead, M. T.; Cornelius, R. S.; Corey, A. S. ACR Appropriateness Criteria Low Back Pain. J. Am. Coll. Radiol. JACR 2016, 13 (9), 1069–1078. https://doi.org/10.1016/j.jacr.2016.06.008.
(3) Shen, W.; Scherzer, R.; Gantz, M.; Chen, J.; Punyanitya, M.; Lewis, C. E.; Grunfeld, C. Relationship between MRI-Measured Bone Marrow Adipose Tissue and Hip and Spine Bone Mineral Density in African-American and Caucasian Participants: The CARDIA Study. J. Clin. Endocrinol. Metab. 2012, 97 (4), 1337–1346. https://doi.org/10.1210/jc.2011-2605.
(4) Jethanandani, A.; Lin, T. A.; Volpe, S.; Elhalawani, H.; Mohamed, A. S. R.; Yang, P.; Fuller, C. D. Exploring Applications of Radiomics in Magnetic Resonance Imaging of Head and Neck Cancer: A Systematic Review. Front. Oncol. 2018, 8, 131. https://doi.org/10.3389/fonc.2018.00131.
(5) He, L.; Liu, Z.; Liu, C.; Gao, Z.; Ren, Q.; Lei, L.; Ren, J. Radiomics Based on Lumbar Spine Magnetic Resonance Imaging to Detect Osteoporosis. Acad. Radiol. 2020, S1076633220301926. https://doi.org/10.1016/j.acra.2020.03.046.
(6) Szczypiński, P. M.; Strzelecki, M.; Materka, A.; Klepaczko, A. MaZda--a Software Package for Image Texture Analysis. Comput. Methods Programs Biomed. 2009, 94 (1), 66–76. https://doi.org/10.1016/j.cmpb.2008.08.005.
Figures