0523
Assessing the Viability of Carpal Bone Kinematic Profiles Extracted from 4D MRI1Medical College of Wisconsin, Milwaukee, WI, United States, 2Radiology, Medical College of Wisconsin, Milwaukee, WI, United States, 3Neurosurgery, Medical College of Wisconsin, Milwaukee, WI, United States, 4University of Wisconsin, Milwaukee, Milwaukee, WI, United States
Synopsis
A unique approach to analysis of wrist mechanics is analyzed. In this approach, 4D dynamic MRI is utilized to track unconstrained movement of individual wrist carpal bones. Through a boundary-based slab-to-volume registration approach, fiducial points identified or computed on high resolution static images are tracked using the dynamic time series to generate time-domain signals indicative of independent and relative carpal bone movement. After rudimentary processing of 12 derived signals, each computed on 3 asymptomatic control subjects, correlation analysis is utilized to elucidate the utility of these metrics in establishing a normative kinematic profile of the healthy wrist.
Introduction
Imaging of the moving joint (kinematic imaging) can provide crucial differentiating information in orthopedic assessments and longitudinal management1-5. Connective tissue injuries, certain structural deformities, and structural integrity losses can be difficult to characterize in single-frame static diagnostic images.In the present feasibility study, advanced 4D MRI of the wrist is used to perform kinematic tracking of individual carpal bones during unconstrained wrist movement. This data is used to derive kinematic profiles by registering the moving slab frames to a high-resolution complete static volume that is further used to define reference coordinates for kinematic tracking.
Within the context of this study, a kinematic profile is a cumulative collection of quantified parameters tracked during the course of joint movements.
In a test cohort of 3 subjects performing unconstrained radial-ulnar deviation movements, kinematic profiles constructed with the described methodology are analyzed for consistency and potential viability in ongoing and future studies. The overarching hypothesis behind the study supporting this project is that analytics derived from such kinematic profiles can provide sensitive and specific classifications of joint dysfunction. This hypothesis is supported by recent quasi-static MRI-based analyses of wrist dynamics6.
Methods
A GE Premier 3T MRI scanner using a 16-channel large flex coil was used to capture dynamic and static images of the wrist of 3 healthy asymptomatic subjects that provided written consent into a locally approved IRB protocol. The subject’s arm was fixed with padding to give necessary range of motion for the ulnar-deviation movement analyzed in this study. No physical motion constraints were utilized to guide subject motion.Static fixed images were acquired using a 3D SPGR sequence with 0.6mm isotropic voxel with acquisition matrix size of 300x240x80, TE=1.8ms, TR=5.8ms, FA=10 degrees, NEX=2, BW/Pixel=417Hz. Dynamic volumes with temporal resolution of 2.3s were acquired using 3D SPGR series with 1.6x1.6x2.5 mm voxel size with 128x128x12 acquisition matrix size, TE=1.1ms, TR=3.9ms, FA=10 degrees, NEX=1, BW/Pixel=977Hz. Visual guidance assisted subjects in performing 3 cycles of motion during a 40 frame acquisition (roughly 1.5 minutes). Empirical analysis found that this rate of motion resulted in minimal motion artifacts in the described dynamic 3D acquisition.
A novel approach to register sparse moving frames of carpal bones with the high-resolution MRI fixed volumes was deployed in this study. Briefly, this approach operates on the boundary point cloud of segmented carpal bones, applies a rigid transformation, and minimizes a cost function matching the points at the boundaries. This method is described and validated in further detail in another abstract submitted to this conference.
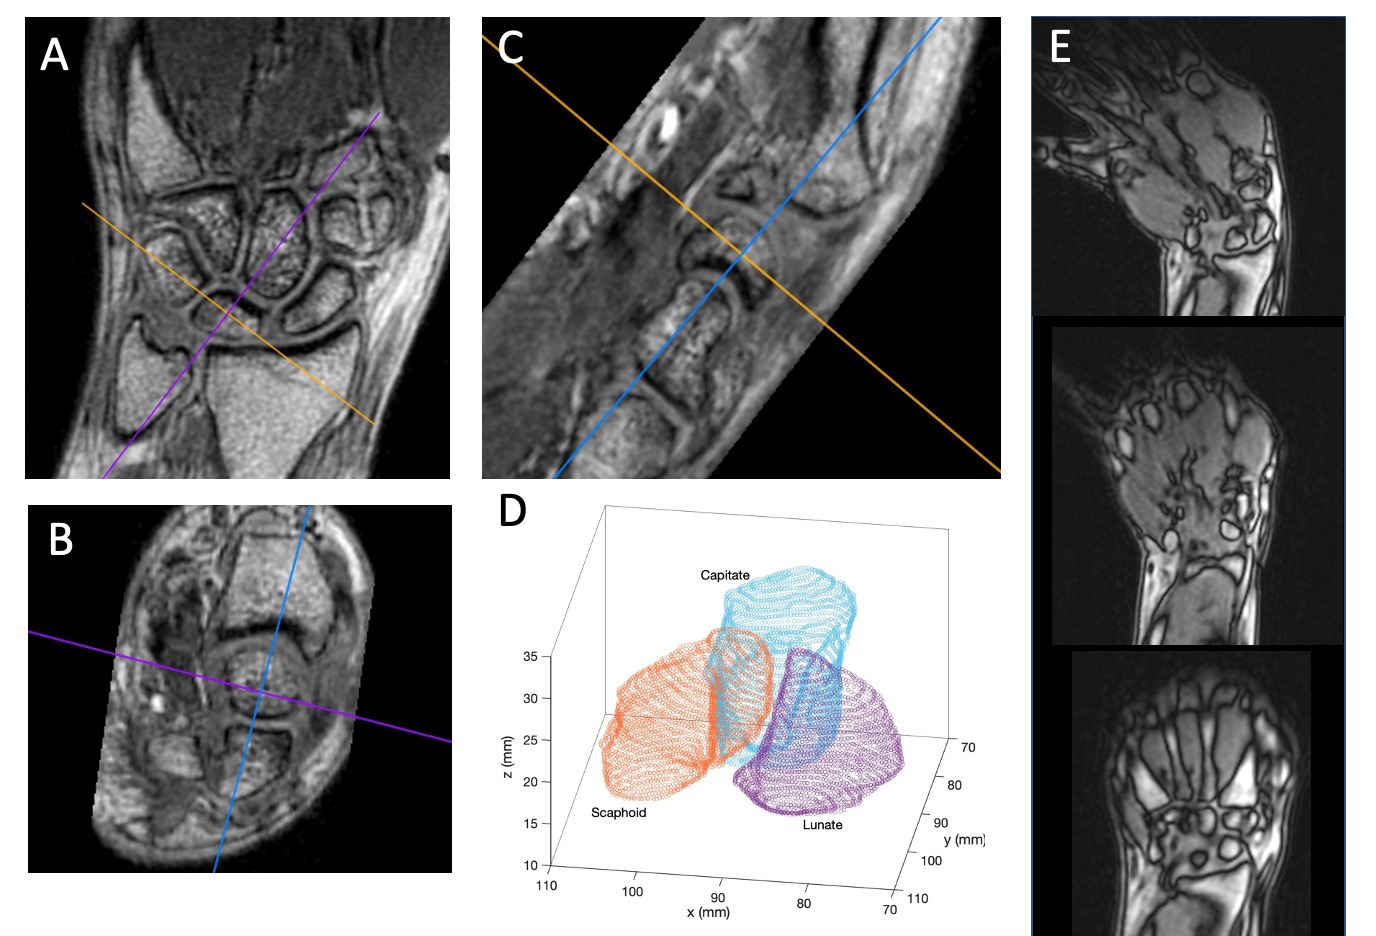
Figure 1 provides demonstrative images from one subject in the cohort. High resolution isotropic static SPGR MRI (A-C), segmented renderings of 3 carpal bones, and 3 sample images from the 3D dynamic SPGR series are shown.
In the present study, the scaphoid, lunate, and capitate carpal bones were analyzed. 12 specific kinematic metrics were tracked to and analyzed in this study: (1-3) the intervals (gaps) between the scaphoid, lunate and capitate bones, (4-6) the centers of mass of these bones, (7-9) the angles between the centers of masses of these bones, and (10-12) the angular axes of rotation of each bone.
The only manually-derived metric from this set were the bone-gap intervals, which were chosen on a 3-dimensional volumetric rendering of the static (rest) bone positions and sought to best capture the midline interval between the bones at rest.
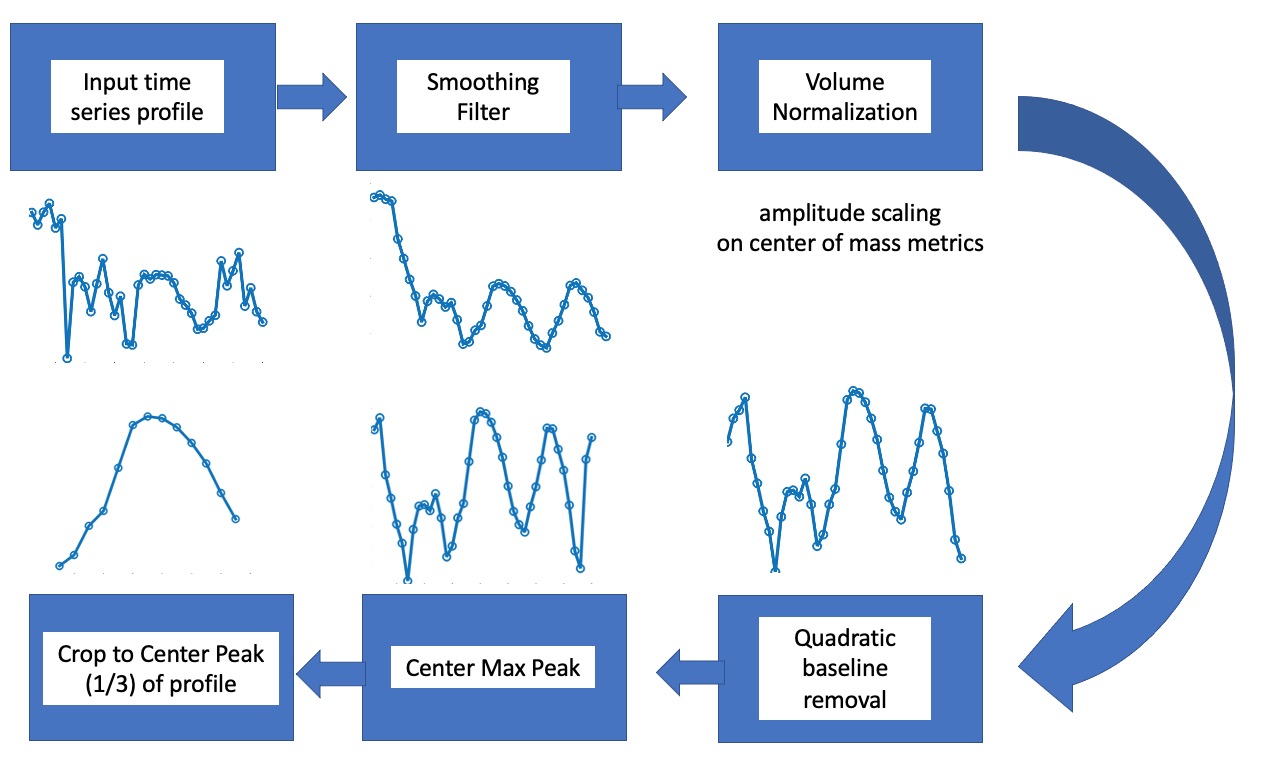
Figure 2 provides a flow chart of the processing utilized on each derived kinematic metric profile.
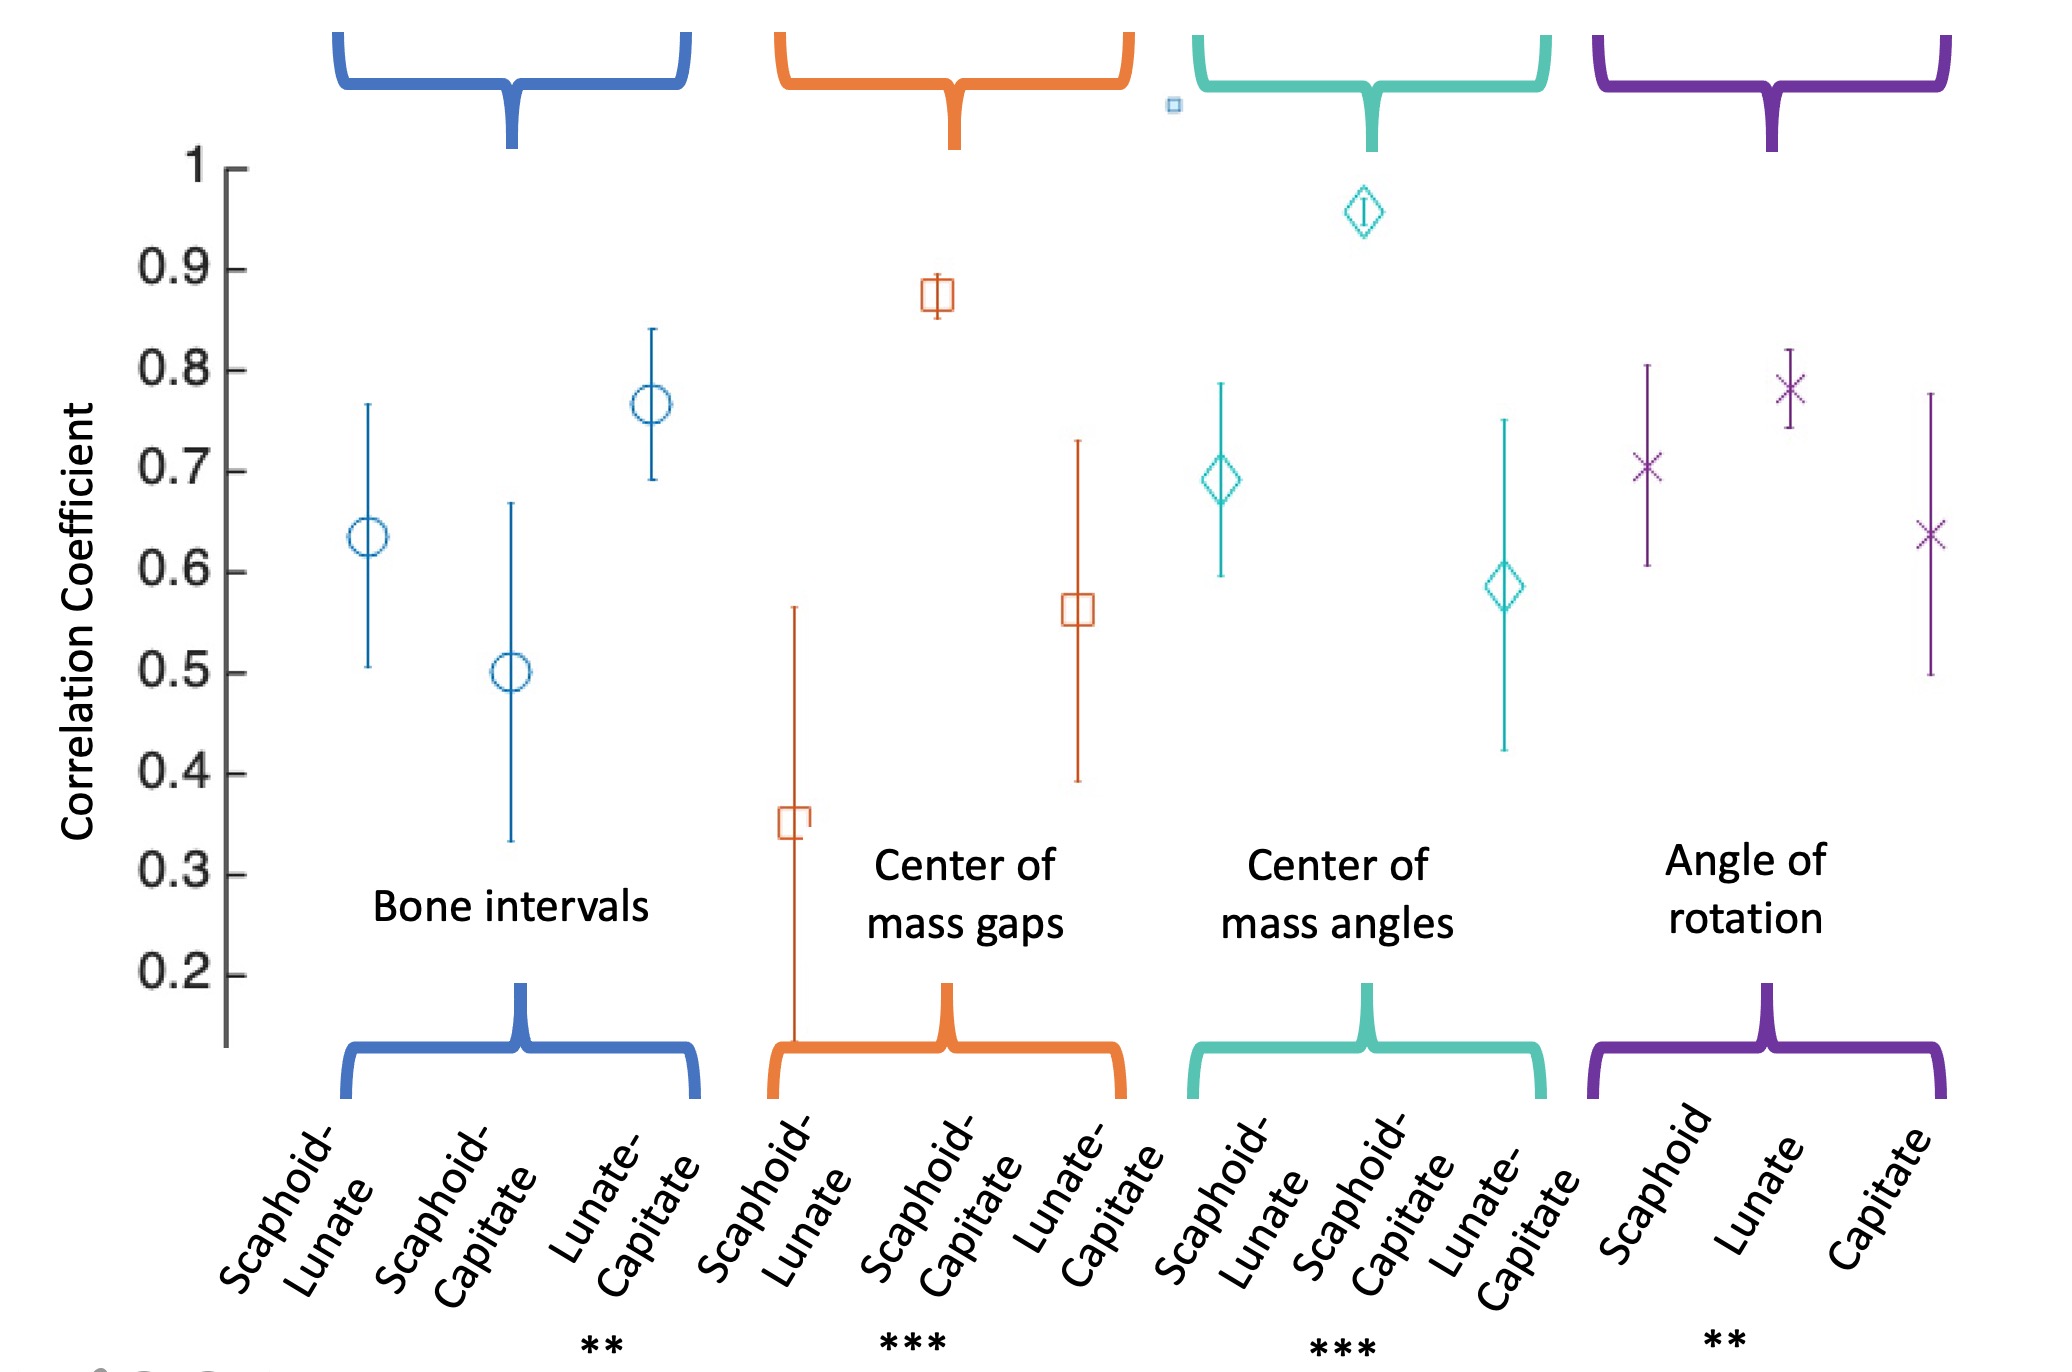
After deriving the final single-cycle motion profile for each metric, the time profiles for the 3 test subjects were cross correlated with one another. The mean and standard deviation of this cross correlation coefficient was recorded, along with the p-value associated with each correlation.
Results
Figure 3 provides the results of the kinematic profile cross correlation analysis. For each metric, the mean subject-group cross correlation and standard deviation of the correlations are shown.From this preliminary analysis, 4 particular metrics showed statistically significant time domain correlations, indicated with * by significance level.
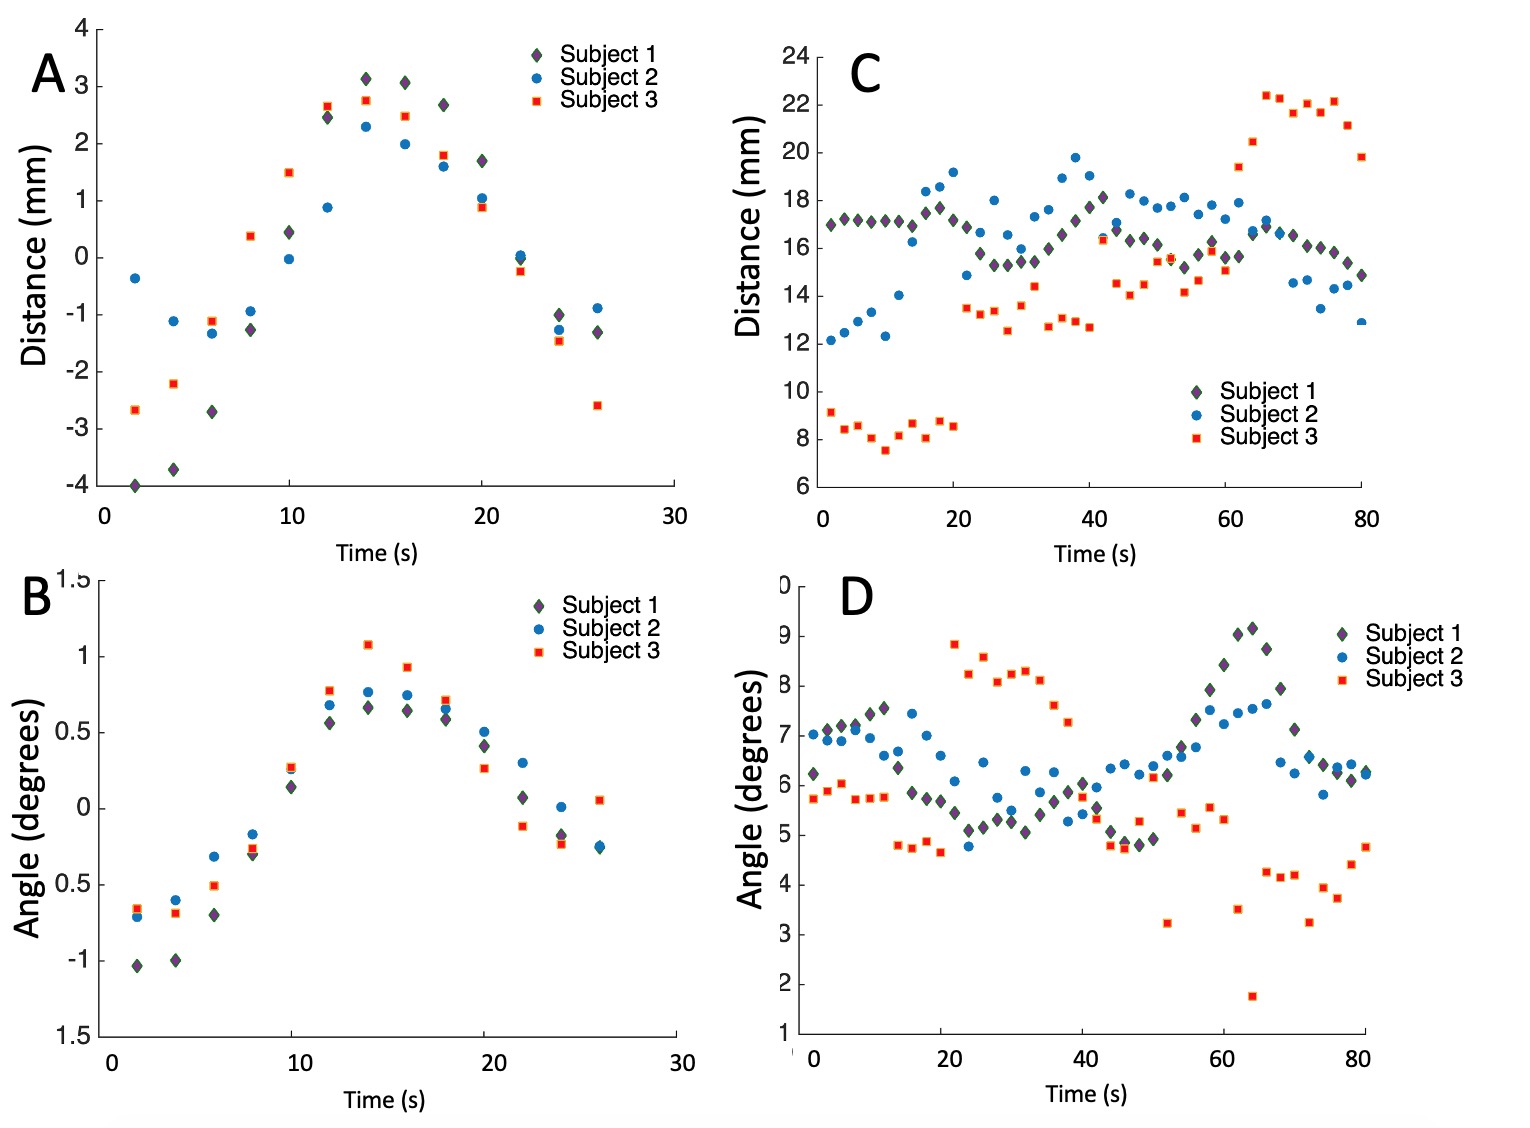
Figure 4 provides exemplary metric profiles from the subject cohort, showing two that had significant correlations (scaphoid capitate center of mass [A] distance and angle [B]). For reference, the original raw profiles for these respective metrics are shown in (C) and (D). It is clear that the simple processing introduced in this work has substantial impact on the visibility and clarity of the displayed profiles.
Discussion
The results of this feasibility study are promising. The ability to extract repeatable kinematic metric profiles of carpal bones from 4D MRI of unconstrained wrist motion has been established. In this study, only a small subset of 12 basic metrics have been analyzed. Of these 12 metrics, four have immediately shown promise, and several others may show improved repeatability with further analysis of the time domain signals. Subject recruitment to test the broader aims of this project, which seeks to test the viability of a normative MRI-derived kinematic wrist profile, are ongoing. In addition, more advanced metric development and time domain processing will be explored.Acknowledgements
This study was supported by NIH R21AR075327. The content is solely the responsibility of the authors and does not necessarily represent the official views of the NIH.References
1. A. J. Schnorenberg, B. A. Slavens, M. Wang, L. C. Vogel, P. A. Smith, and G. F. Harris. Biomechanical model for evaluation of pediatric upper extremity joint dynamics during wheelchair mobility. Journal of Biomechanics, 47(1):269–276, January 2014.
2. G. Wu, F. C. T. van der Helm, H. E. J. DirkJan Veeger, M. Makhsous, P. Van Roy, C. Anglin, J. Nagels, A. R. Karduna, K. McQuade, X. Wang, F. W. Werner, and B. Buchholz. ISB recommendation on definitions of joint coordinate systems of various joints for the reporting of human joint motion—Part II: shoulder, elbow, wrist and hand. Journal of Biomechanics, 38(5):981–992, May 2005.
3. C. Muhle, J. Brossmann, and M. Heller. Kinematic CT and MR imaging of the patellofemoral joint. European Radiology, 9(3):508–518, 1999.
4. J. E. Johnson, P. Lee, T. E. McIff, E. B. Toby, and K. J. Fischer. Scapholunate ligament injury adversely alters in vivo wrist joint mechanics: An MRI-based modeling study. Journal of Orthopaedic Research, 31(9):1455–1460, April 2013.
5. G. Li, T. H. Wuerz, and L. E. DeFrate. Feasibility of using orthogonal fluoroscopic images to measure in vivo joint kinematics. Journal of biomechanical engineering, 126(2):313–318, 2004.
6. Foster B H, Shaw C B, et al. A principal component analysis-based framework for statistical modeling of bone displacement during wrist maneuvers. Journal of Biomechanics 2019; pages 1–9.
Figures