0520
Quantification of Synovial Fluid using Magnetic Resonance Fingerprinting Multicomponent Imaging in Articular Cartilage of Knee1Seoul St. Mary’s Hospital, Seoul, Korea, Republic of, 2Siemens Healthineers, Seoul, Korea, Republic of
Synopsis
The morphologic MR imaging is limited in identifying sub-voxel sized cartilage defect due to partial volume averaging. We assessed the feasibility of synovial fluid fraction (SFF) map generated by multicomponent approach using MRF-derived relaxation maps to characterize sub-voxel sized cartilage defect. In ex vivo experiment, we proved that SFF map can quantify synovial fluid fraction in sub-voxel sized cartilage defects. In clinical study, we demonstrated that SFF map can complement morphologic imaging in cartilage segmentation and volumetric assessment.
Introduction
Morphologic MR imaging cannot delineate cartilage defect smaller than a signal voxel due to partial volume averaging. T2 mapping of cartilage is one of the most commonly used compositional MR technique to complement morphologic MR in detecting early cartilage degeneration. However, direct interpretation of the T2 map is challenging because many biologic factors affects T2 values.1,2 MRF simultaneously generates different relaxation maps by dictionary generation and pattern matching3, and has shown promise to be used in multicomponent imaging. In this study, we aim to assess synovial fluid fraction (SFF) map generated from multicomponent approach using MRF-derived T1 and T2 maps can quantify SFF in sub-voxel sized cartilage defects, and add precision on cartilage evaluation.Methods
MRF scans3D MRF-FISP with hybrid radial-EPI acquisition was used.4 This method allows to acquire 3D high resolution MRF within clinically acceptable scan time.
Multicomponent MRF for synovial fluid map generation
Three components were assumed for multicomponent imaging, 1) damaged cartilage (DC) : T1=900ms, T2=55ms, 2) normal cartilage (NC) : T1=900ms, T2=30ms, and 3) synovial fluid (SF) : T1=3000ms, T2=300ms. This can be described as the equation, $$$\\S\upsilon=\sum_{i=1}^3wiDi$$$, $$$\\S\upsilon$$$: MRF signal from a single voxel, $$$\\wi$$$: fraction value of each component, $$$\\Di$$$: MRF signal evolution (generated by Bloch equation) of each component with given T1 and T2 values. The fraction was decomposed by pre-calculated dictionary with 1% fraction step size for each component. DC, NC, and SF fraction maps were generated.
Ex vivo experiments
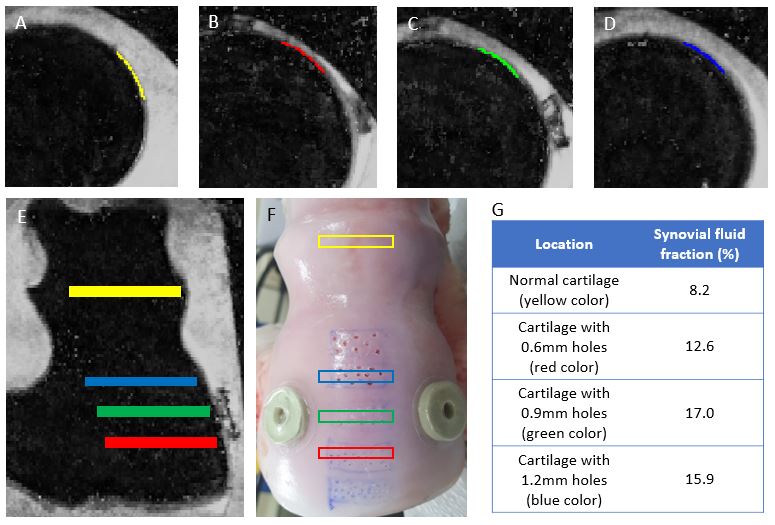
The front upper leg bone of bovine was obtained and extraneous tissue was cut away. Holes with 3 different sizes (0.6, 0.9, 1.2mm) were drilled separately on the articular surface. The leg specimen was put in a saline bag and the bag was placed in a cylinder container filled with agarose gel. For the ex vivo experiment, longer 3D MRF with high SNR than the MRF for the clinical study was performed to validate the feasibility of SFF map. The 3D MRF was scanned at 3T clinical MRI (Vida, Siemens) : resolution 0.4x0.4x1mm3, FOV 220x220x60 mm3, TR=15ms, 512 sinusoidal flip angles, 8 radial spokes/measurement, acceleration factor in slice direction=3, total scan time=25m 49s.
The fraction of water content in bovine cartilage was measured on SFF map in normal and drilled areas with 0.6mm, 0.9mm and 1.2mm holes, respectively (Fig.1).
Clinical study
MRI including sagittal fat suppressed 3D fast spin-echo (FSE) sequence (resolution 0.5x0.5x1mm3, TR/TE=1000/35ms, ETL=26) and sagittal 3D MRF (resolution 0.5x0.5x1mm3, FOV 256x256x120mm3, TR=18ms, 512 sinusoidal flip angles, 8 radial spokes/measurement, acceleration factor in slice direction=3, EPI factor in slice direction=4, total scan time=8m 58s) were acquired in 16 osteoarthritis patients with IRB approval.
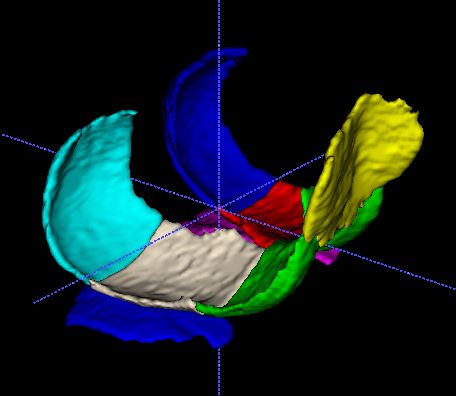
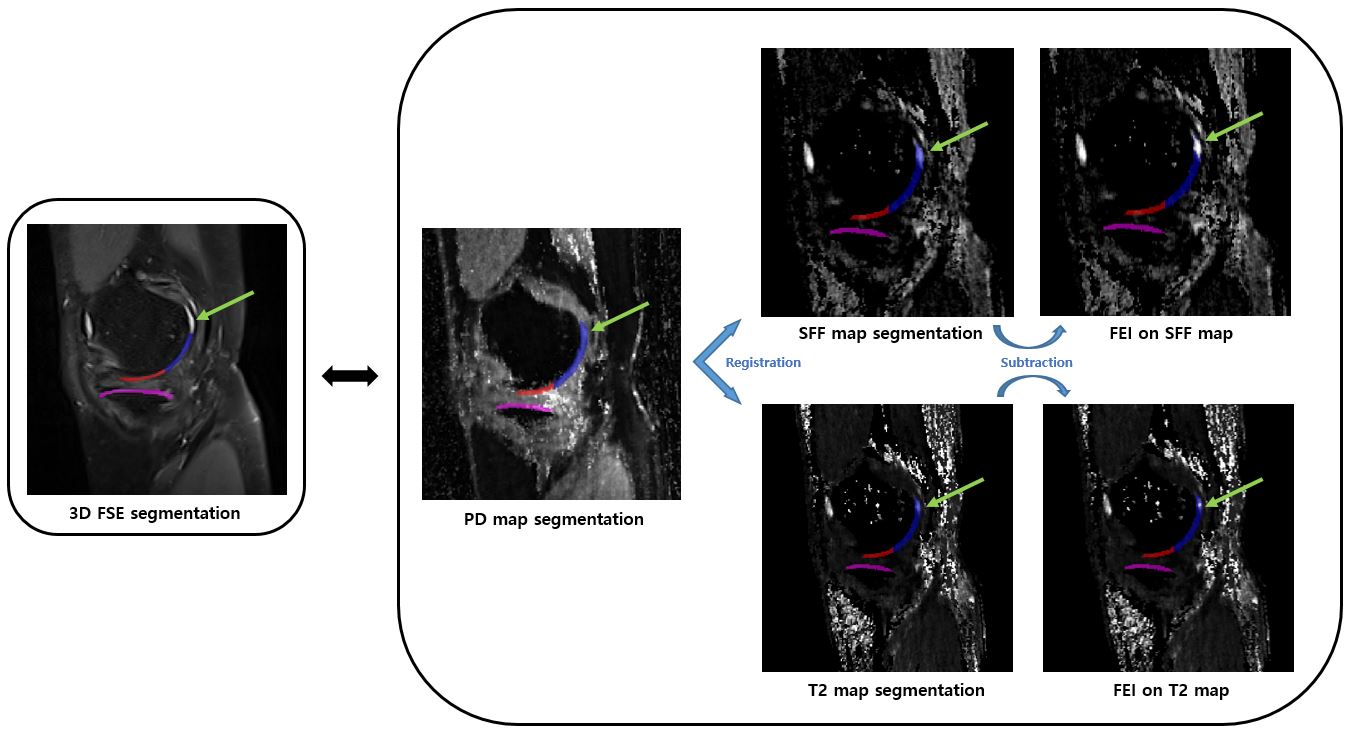
Cartilage on 3D FSE images was manually segmented to delineate cartilage defects precisely. Whereas, cartilage on MRF-generated PD images were segmented along the expected normal cartilage contour without consideration of cartilage defects. Knee cartilages divided into 8 subregions (Fig.2)
For visual analysis, the segmentation of PD images were compensated by subtracting fluid volume, using binarization method5 with threshold of 0.5 in SFF map (FEISFF) and 300ms in T2 map (FEIT2) (Fig.3). Each subregion on 3D FSE, FEISFF and FEIT2 was graded with WORMS system6 by a radiologist, and Cohen’s kappa coefficients were calculated between 3D FSE and compensated segmentations (FEISFF and FEIT2).
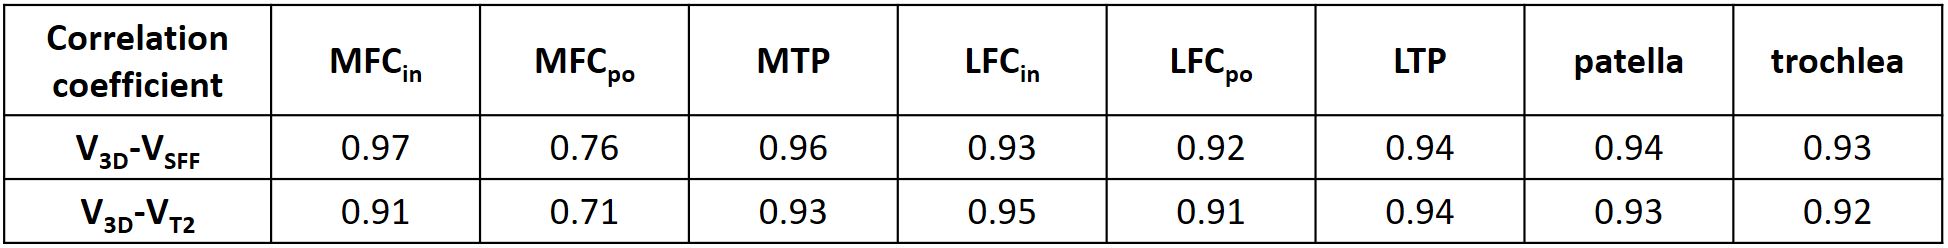
For quantitative analysis, the segmented volume of PD images were compensated by multiplying cartilage fraction (1-fluid fraction) in SFF map and by including voxels less than 300ms in T2map. Correlation coefficient were calculated between cartilage volume on 3D FSE images (V3D) and the compensated volumes using SFF map (VSFF) and T2map (VT2).
Result
SFF in bovine cartilage was 8.2%, 12.6%, 17.0% and 15.9% in normal cartilage, cartilages with 0.6mm holes, 0.9mm holes and 1.2mm holes, respectively (Fig.1). Kappa coefficients of WORMS scores were 0.797 in FEISFF and 0.637 in FEIT2 with the reference of 3D FSE. The correlation coefficients of V3D-VSFF and V3D-VT2 were 0.97, 0.91 in inferior medial femoral condyles, 0.76, 0.71 in posterior medial femoral condyle and 0.96, 0.93 in medial tibial plateau, respectively (p<0.001). In other subregions, the differences of correlation coefficients between VSFF and VT2 were less than 0.03 (Table 1).Discussion
As compared to T2 mapping, SFF mapping provide a direct estimate on fluid fraction in cartilage. In osteoarthritic knee, SFF map showed high correlation with high resolution 3D FSE images in visual and quantitative analysis compared to T2 map. Although multicomponent approach has been investigated for partial volume correction7, MRF has not been used in multicomponent imaging of articular cartilage. MRF generates a set of images with complete registration. It is a strength in assessment of thin cartilages where misregistration of a single voxel distance yields incorrect values. In this study, we only used the synovial fluid component among three fraction maps. The validation and application in clinical study should ensue for the cartilage fraction maps in our future work.Conclusion
Synovial fluid in small invisible cartilage defect can be quantified with MRF-based SFF map. The SFF map can add precision in delineating cartilage defects and correcting cartilage volume.Acknowledgements
NoneReferences
1. Roemer, F. W., Crema, M. D., Trattnig, S., Guermazi, A. Advances in Imaging of Osteoarthritis and Cartilage. Radiology 260, 332-354 (2011).
2. Fujioka, R., Aoyama, T., Takakuwa, T. The layered structure of the articular surface. Osteoarthritis and Cartilage 21, 1092-1098 (2013).
3. Poorman, M. E. et al. Magnetic resonance fingerprinting Part 1: Potential uses, current challenges, and recommendations. Journal of Magnetic Resonance Imaging 51, 675-692 (2020).
4. Han, D., Hong, T., Kim, D-H. High resolution 3D magnetic resonance fingerprinting with hybrid radial cartesian-EPI acquisition. ISMRM 2019 Montreal (2019).
5. Schindelin, J. et al. Fiji: an open-source platform for biological-image analysis. Nature Methods 9, 676-682 (2012).
6. Peterfy, C. G. et al. Whole-Organ Magnetic Resonance Imaging Score (WORMS) of the knee in osteoarthritis. Osteoarthritis and Cartilage 12, 177-190 (2004).
7. Liu, F., Chaudhary, R., Block, W. F., Samsonov, A., Kijowski, R. Multicomponent T2 analysis of articular cartilage with synovial fluid partial volume correction. Journal of Magnetic Resonance Imaging 43, 1140-1147 (2016).
Figures