0516
Dissecting the impact of cortical feedback and inhibitory tectotectal loops in negative BOLD responses along the rat visual pathway1Champalimaud Centre for the Unknown, Lisbon, Portugal
Synopsis
The underlying source of negative BOLD responses (NBRs) is still debated. Here, we show that binocular visual stimulation with short inter-stimulus-intervals (ISIs) lead to strong NBRs in the rat superior colliculus (SC). We perturbed cortical feedback loops with V1 ibotenic acid lesions and input to the ipsilateral SC via tectotectal projections through monocular stimulation. SC NBRs were upward regulated upon both V1 lesioning and monocular stimulation of non-lesioned animals. When combining reduced cortical feedback and tectotectal projections, NBRs in SC were abolished. Our results suggest an important role for corticotectal and commissural tectotectal projections in SC NBRs at short ISIs.
Introduction
The biological meaning of Negative BOLD responses (NBRs) remains unclear. Hypotheses such as neuronal inhibition1-3, blood stealing effects4, extension of the initial dip5 or neurovascular uncoupling6-7, have been suggested. Superior colliculus (SC) receives several inputs within the visual pathway: corticotectal feedback, nonGABAergic projections acting as a gain control of SC visual responses8-11 and commissural tectotectal projections which have an inhibitory effect11-13 and connect the two SCs. Here, we aimed to dissect the origins of NBRs using stimulus- and lesion-based14 manipulations in the rat. Our, results suggest that tectotectal projections and corticotectal feedback loops produce marked NBRs at short inter-stimulus intervals (ISIs), which could be important in interpreting fMRI data.Methods
Animal experiments were preapproved by the institutional and national authorities and were carried out according to European Directive 2010/63.Animal Preparation: Adult Long Evans rats were sedated with medetomidine while temperature and respiration rate were monitored and kept stable.
MRI experiments: A 9.4T BioSpec scanner (Bruker, Karlsruhe, Germany) with an 86mm quadrature resonator for transmittance and a 4-element array cryoprobe15-16 (Bruker, Fallanden, Switzerland) for signal reception was used. Functional data was acquired under hyperoxia (95%O2) with a SE-EPI sequence (TE/TR=40/1500ms, FOV=18x16.1mm2, in-plane resolution=268x268μm2, slice thickness=1.5mm, tacq=6min 45s).
Experimental Groups: Four different stimulation regimes were performed: binocular vs monocular stimulation, both with and without V1 lesion (Fig.1).
Visual Stimulation: A blue LED (𝜆=470nm and I=8.1×10⁻¹ W/m2) was used for visual stimulation. The stimulation paradigm consisted of six repetitions of 15s stimulation and 45s rest, with ISIs of 1000, 56 and 30ms (Fig.2A).
V1 Lesions: Bilateral injections of 1% ibotenic solution diluted in a 0.1M NaOH solution were performed along V1 and animals were imaged 1 week after surgery to ensure successful lesioning and reduced inflammation (Fig.2B).
Data analysis: Standard fMRI pre-processing included manual outlier correction; slice-timing correction; smoothing (3D Gaussian kernel, FWHM=0.268mm isotropic); mean volume realignment and co-registration to an anatomical reference. An HRF peaking at 1s was convolved with the paradigm. A minimum significance level of 0.001 (FDR corrected) with a minimum cluster size of 20 voxels were used in the GLM. Time-courses were calculated by manually drawing atlas-based17 ROIs (Fig. 2C) and detrending with a 5th polynomial fit to the resting periods.
Results
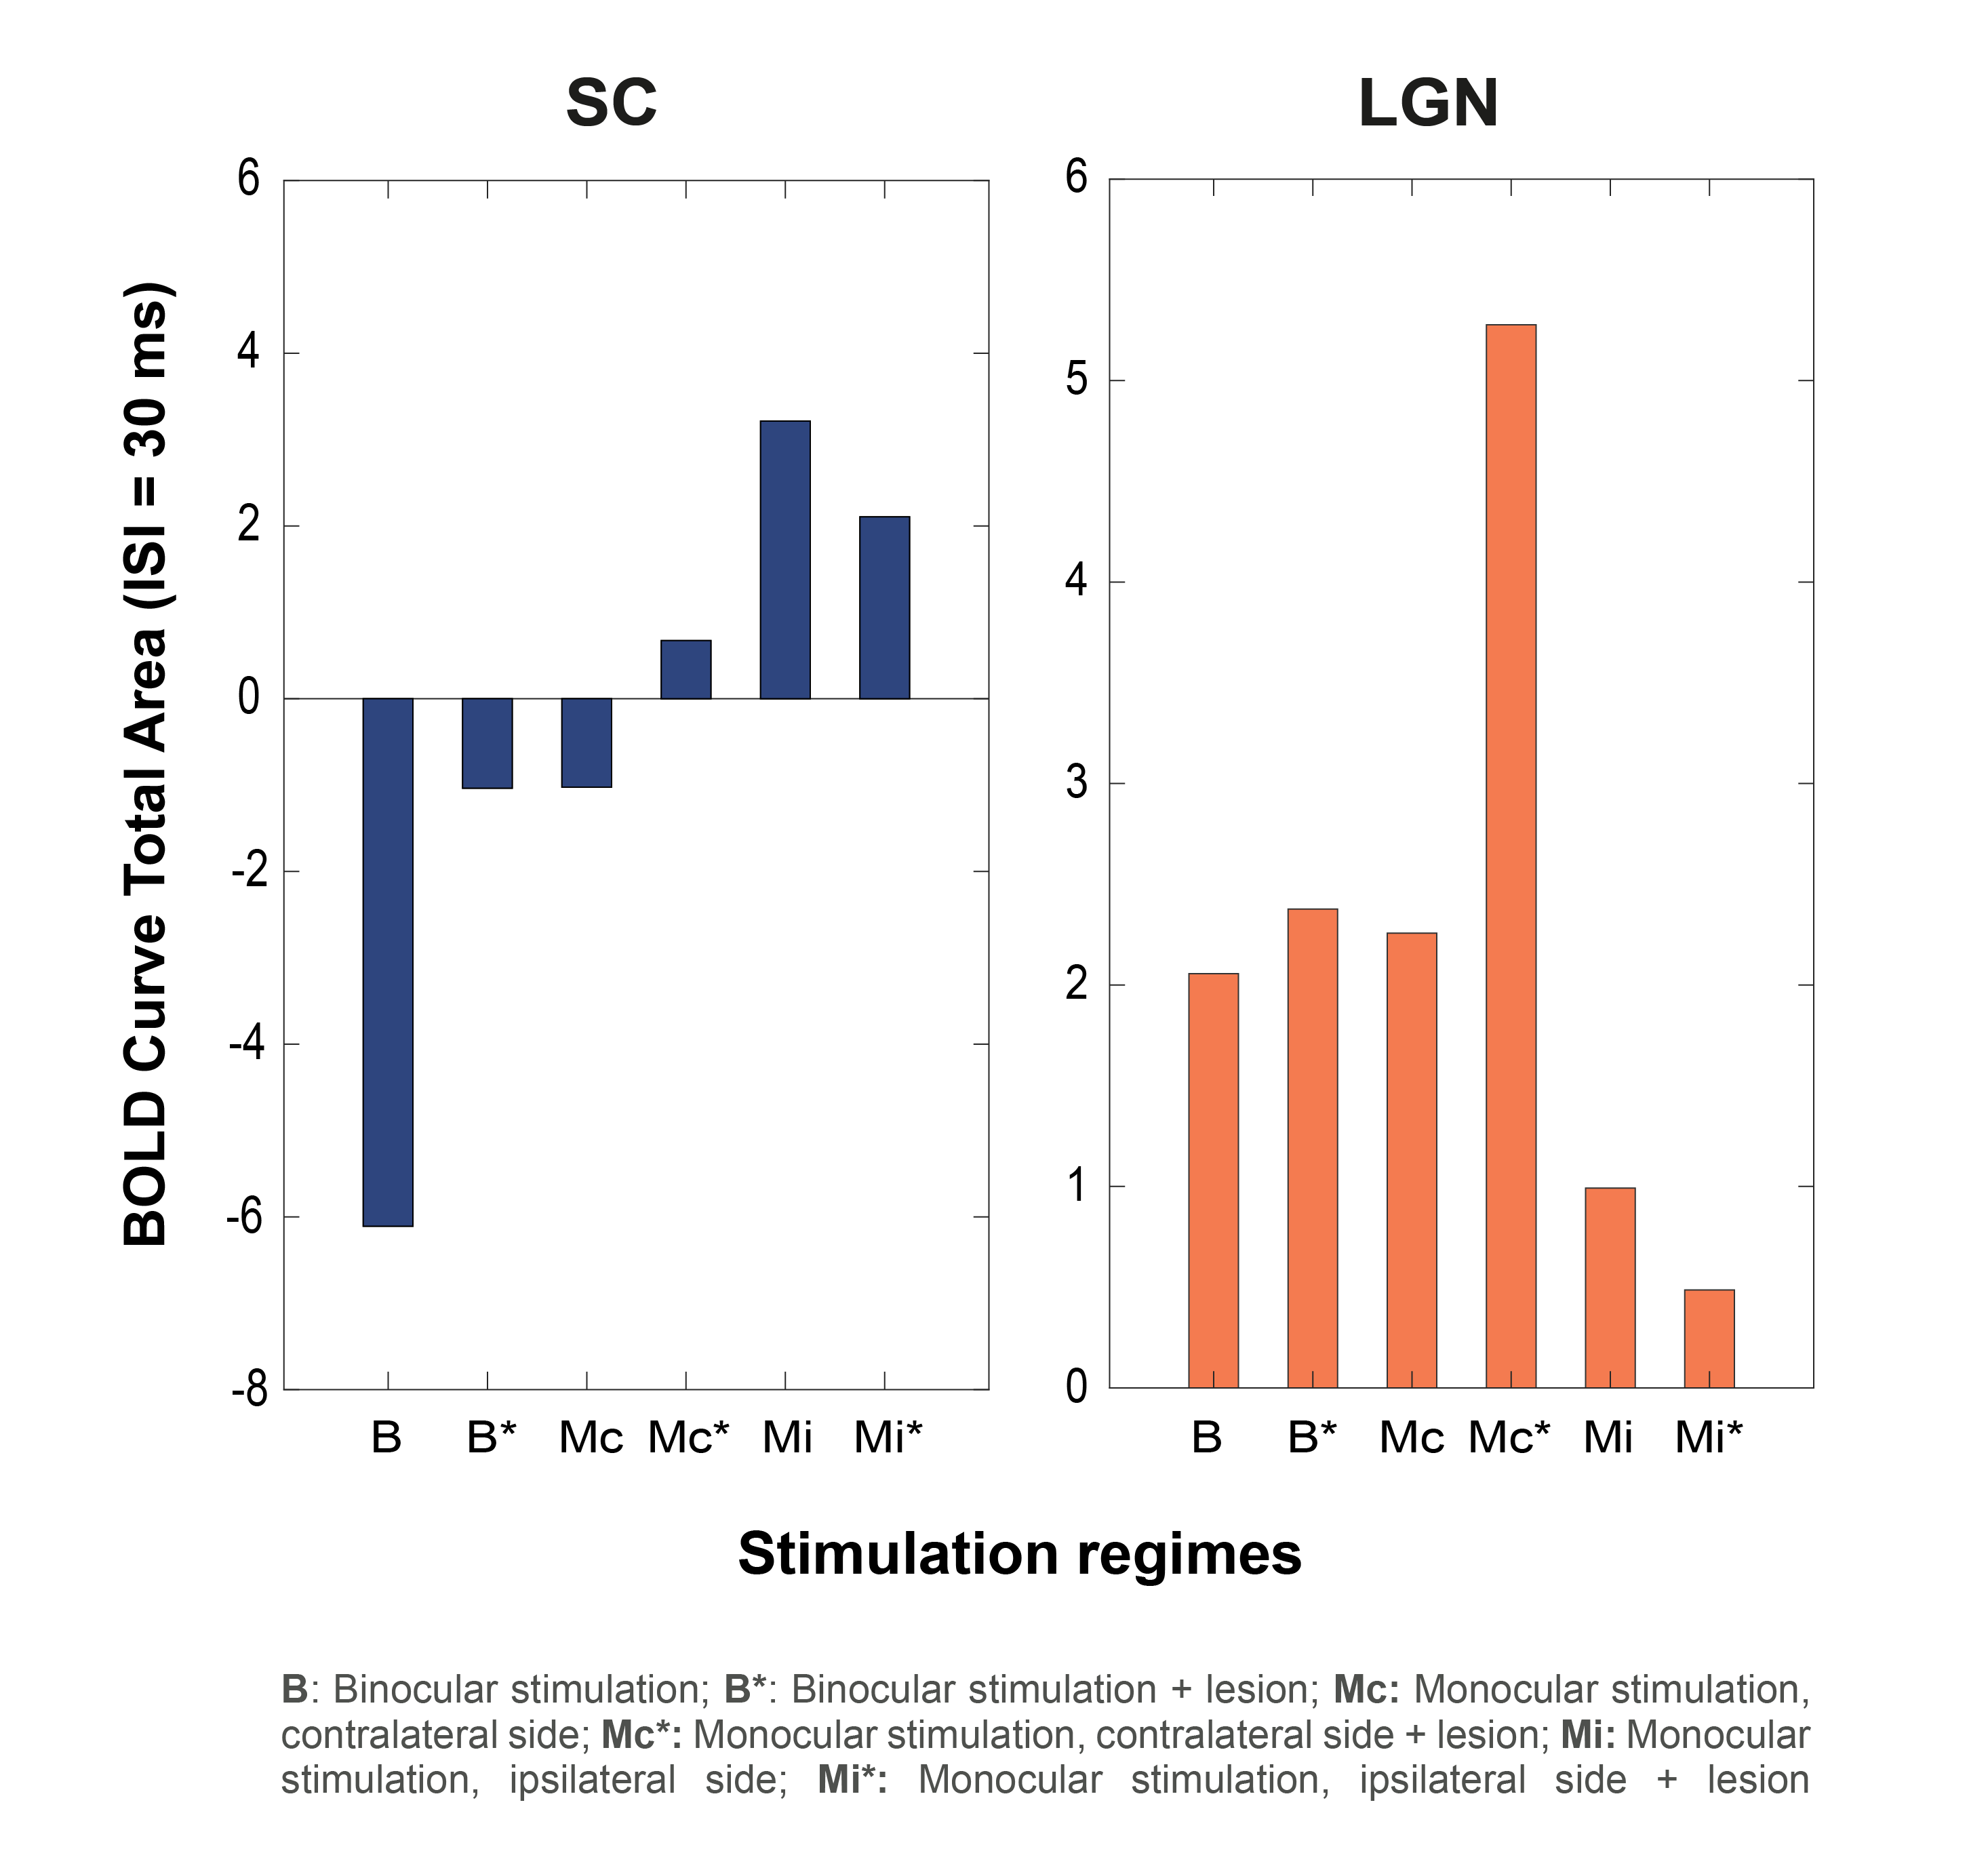
Bilateral SC NBRs appear at short ISIs with binocular stimulation of non-lesioned animals (Fig.3A) and, time-courses reveal the amplitude decrease of the first peak during stimulation and the appearance of a second post-stimulus peak. LGN responses appear also modulated with the shortening of ISIs, without however reaching NBRs. To check whether cortical feedback loops influence the SC observed BOLD modulation, V1 was lesioned and results (Fig.3B) show an upward regulation of SC NBRs amplitudes at short ISIs when compared with results from non-lesioned animals (Fig.3A). To reduce tectotectal inputs in the contralateral SC, we performed monocular stimulation and similar results as in Fig.3B can be observed for non-lesioned animals (Fig.4A). Ipsilateral SC BOLD responses, however, appear modulated in the oppposite way with stronger positive BOLD responses at shorter ISIs. Reducing tectotectal projections and cortical feedback in contralateral SC, through monocular stimulation in V1 lesioned animals (Fig.4B), resulted in a strong upward regulation of SC responses that did not reach negative values but kept the post-stimulus peak. Similar ipsilateral modulations as in Fig.4A can be observed. Interestingly, contralateral LGN responses at ISI=30ms become considerably stronger when compared with other regimes. Quantification of BOLD curve total area for the ISI=30ms (Fig.5) shows the upward regulation of SC NBRs in all regimes compared with the non-lesioned binocular stimulation. Monocular stimulation contralateral responses of lesioned animals do not show SC NBRs concurrent with a dramatic increase in the positive area of LGN.Discussion
We have observed ISI- and lesion-dependent NBRs in SC. It is interesting to consider the potential drivers of NBRs in the context of feedback loops. V1 feedback projections arrive to SC9 modulating neuronal responses depending on cortical input8-11. In awake rabbits11 postsynaptic corticotectal impulses strongly impacted SC depending on the preceding interspike interval duration, with longer intervals leading to more pronounced postsynaptic sinks. Other studies show that the effect of cortical input to SC is largely a gain control effect8-9. This points to SC NBRs at short ISIs possibly reflecting an overal SC net inhibition and, the observed upward regulations of NBRs upon V1 lesion, confirms the involvement of corticotectal projections in SC NBRs. On the other hand, comissural tectotectal connections, in-between SCs, are known to have an inhibitory effect12-13 and, weakening these connections unilaterally (through monocular stimulation) results as well in an upward regulation of contralateral SC NBRs. Combining the two perturbations, monocular stimulation and V1 lesioning, abolishes SC NBRs and LGN responses become dramatically more positive, suggesting an inhibitory effect of SC on LGN, probably through horizontal cells9, at short ISIs. Thus, our results suggest that inhibitory influences arising from corticotectal feedback and tectotectal projections contribute to SC NBRs.Conclusions
Corticotectal and comissural tectotectal projections influence SC BOLD modulations at different ISIs. As corticotectal projections work as a gain control of SC responses and tectotectal projections have an inhibitory effect in-between SCs, one may hypothesize that SC NBRs at short ISIs result from a net inhibitory effect.Acknowledgements
This study was funded in part by the European Research Council (ERC) (agreement No. 679058). The authors acknowledge the vivarium of the Champalimaud Centre for the Unknown, a facility of CONGENTO which is a research infrastructure co-financed by Lisboa Regional Operational Programme (Lisboa 2020), under the PORTUGAL 2020 Partnership Agreement through the European Regional Development Fund (ERDF) and Fundação para a Ciência e Tecnologia (Portugal), project LISBOA-01-0145-FEDER-022170. Finally, the authors would like to thank Francisca F. Fernandes for the assistance during fMRI data analysis.References
[1] Sten, Sebastian, et al. "Neural inhibition can explain negative BOLD responses: A mechanistic modelling and fMRI study." NeuroImage 158 (2017): 219-231;
[2] Northoff, Georg, et al. "GABA concentrations in the human anterior cingulate cortex predict negative BOLD responses in fMRI." Nature neuroscience 10.12 (2007): 1515;
[3] Shmuel, Amir, et al. "Negative functional MRI response correlates with decreases in neuronal activity in monkey visual area V1." Nature neuroscience 9.4 (2006): 569;
[4] Harel, Noam, et al. "Origin of negative blood oxygenation level—dependent fMRI signals." Journal of cerebral blood flow & metabolism 22.8 (2002): 908-917;
[5] Schridde, Ulrich, et al. "Negative BOLD with large increases in neuronal activity." Cerebral cortex 18.8 (2007): 1814-1827;
[6] Bailey, Christopher J., et al. "Analysis of time and space invariance of BOLD responses in the rat visual system." Cerebral cortex 23.1 (2013): 210-222;
[7] Goense, Jozien, Hellmut Merkle, and Nikos K. Logothetis. "High-resolution fMRI reveals laminar differences in neurovascular coupling between positive and negative BOLD responses." Neuron 76.3 (2012): 629-639;
[8] Xinyu, Mingna Liu, and Jianhua Cang. "Visual cortex modulates the magnitude but not the selectivity of looming-evoked responses in the superior colliculus of awake mice." Neuron 84.1 (2014): 202-213;
[9] Cang, Jianhua, et al. "Visual function, organization, and development of the mouse superior colliculus." Annual review of vision science 4 (2018): 239-262.
[10] Bereshpolova, Yulia, et al. "The impact of a corticotectal impulse on the awake superior colliculus." Journal of Neuroscience 26.8 (2006): 2250-2259;
[11] Goodale, M. A. "Cortico-tectal and intertectal modulation of visual responses in the rat's superior colliculus." Experimental Brain Research 17.1 (1973): 75-86;
[12] Olivier, Etienne, et al. "Evidence for glutamatergic tectotectal neurons in the cat superior colliculus: a comparison with GABAergic tectotectal neurons." European Journal of Neuroscience 12.7 (2000): 2354-2366;
[13] Appell, Peter P., and Mary Behan. "Sources of subcortical GABAergic projections to the superior colliculus in the cat." Journal of Comparative Neurology 302.1 (1990): 143-158
[14] Pai, Shraddha S., et al. "Minimal impairment in a rat model of duration discrimination following excitotoxic lesions of primary auditory and prefrontal cortices." Frontiers in systems neuroscience 5 (2011): 74;
[15] Niendorf, Thoralf, et al. "Advancing cardiovascular, neurovascular and renal magnetic resonance imaging in small rodents using cryogenic radiofrequency coil technology." Frontiers in pharmacology 6 (2015): 255;
[16] Baltes, Christof, et al. "Micro MRI of the mouse brain using a novel 400 MHz cryogenic quadrature RF probe." NMR in Biomedicine: An International Journal Devoted to the Development and Application of Magnetic Resonance In vivo22.8 (2009): 834-842;
[17] Paxinos, George, and Charles Watson. The rat brain in stereotaxic coordinates: hard cover edition. Elsevier, 2006.
Figures