0514
Characterize laminar-specific interhemispheric functional coherence in resting-state fMRI using bilateral line-scanning fMRI (BiLS)1Max Planck Institute for Biological Cybernetics, Tuebingen, Germany, 2Graduate Training Centre of Neuroscience, Tuebingen, Germany, 3MGH/MIT/HMS Athinoula A. Martinos Center for Biomedical Imaging, Department of Radiology, Harvard Medical School, Massachusetts General Hospital, Charlestown, MA, United States
Synopsis
We developed a bilateral line-scanning fMRI method to investigate interhemispheric slow fluctuations (< 0.1 Hz) with laminar specificity in resting-state fMRI in anesthetized rats. Based on the coherence analysis, two distinct slow fluctuation features in symmetric cortices were identified: ultra-slow fluctuation (0.01-0.02 Hz) was synchronized across all cortical laminae, and Layer 2/3 specific slow fluctuations (0.08-0.1 Hz). In contrast to the ultra-slow fluctuation related to global brain state changes, the Layer 2/3 specific slow fluctuation is more likely associated with intrinsic neuronal correlation driven by the callosal projection.
Introduction
Resting-state (rs-) fMRI provides an opportunity to investigate functional connectivity (FC) by measuring the neuronal activity correlated low frequency fMRI signal fluctuation1-5. In particular, based on the low frequency fluctuation at < 0.1 Hz, strong correlation or coherence between corresponding loci, e.g., symmetric cortices in two cerebral hemispheres, highlight homotopic FC6,7. Lately, BOLD-fMRI responses in a commissural system such as corpus callosum (CC) have been identified to be highly involved with synchronous slow fluctuations in rs-fMRI, connecting homologous cortical areas of the two hemispheres7,8. However, there are quite a few studies to show co-occurred low frequency fluctuation of fMRI signal in the homotopic hemispheric sites in acallosal humans9,10 and postcallosotomy animals11,12. The role of the CC in interhemispheric FC remains controversial. We developed a bilateral line-scanning fMRI method to reliably detect laminar fMRI responses in symmetric primary forepaw somatosensory cortices (FP-S1) with high spatial (100 μm) and temporal resolution (100 ms) in anesthetized rats13. Two distinct low-frequency fluctuation features in the symmetric cortices were identified based on laminar-specific coherence analysis between two hemispheres. An ultra-slow fluctuation (0.01-0.02 Hz) was detected across cortical layers corresponding to global brain state changes14,15. In contrast, a slow fluctuation at 0.08-0.1 Hz was specifically detected at Layer 2/3, which is heavily projected by callosal projection neurons16.Methods
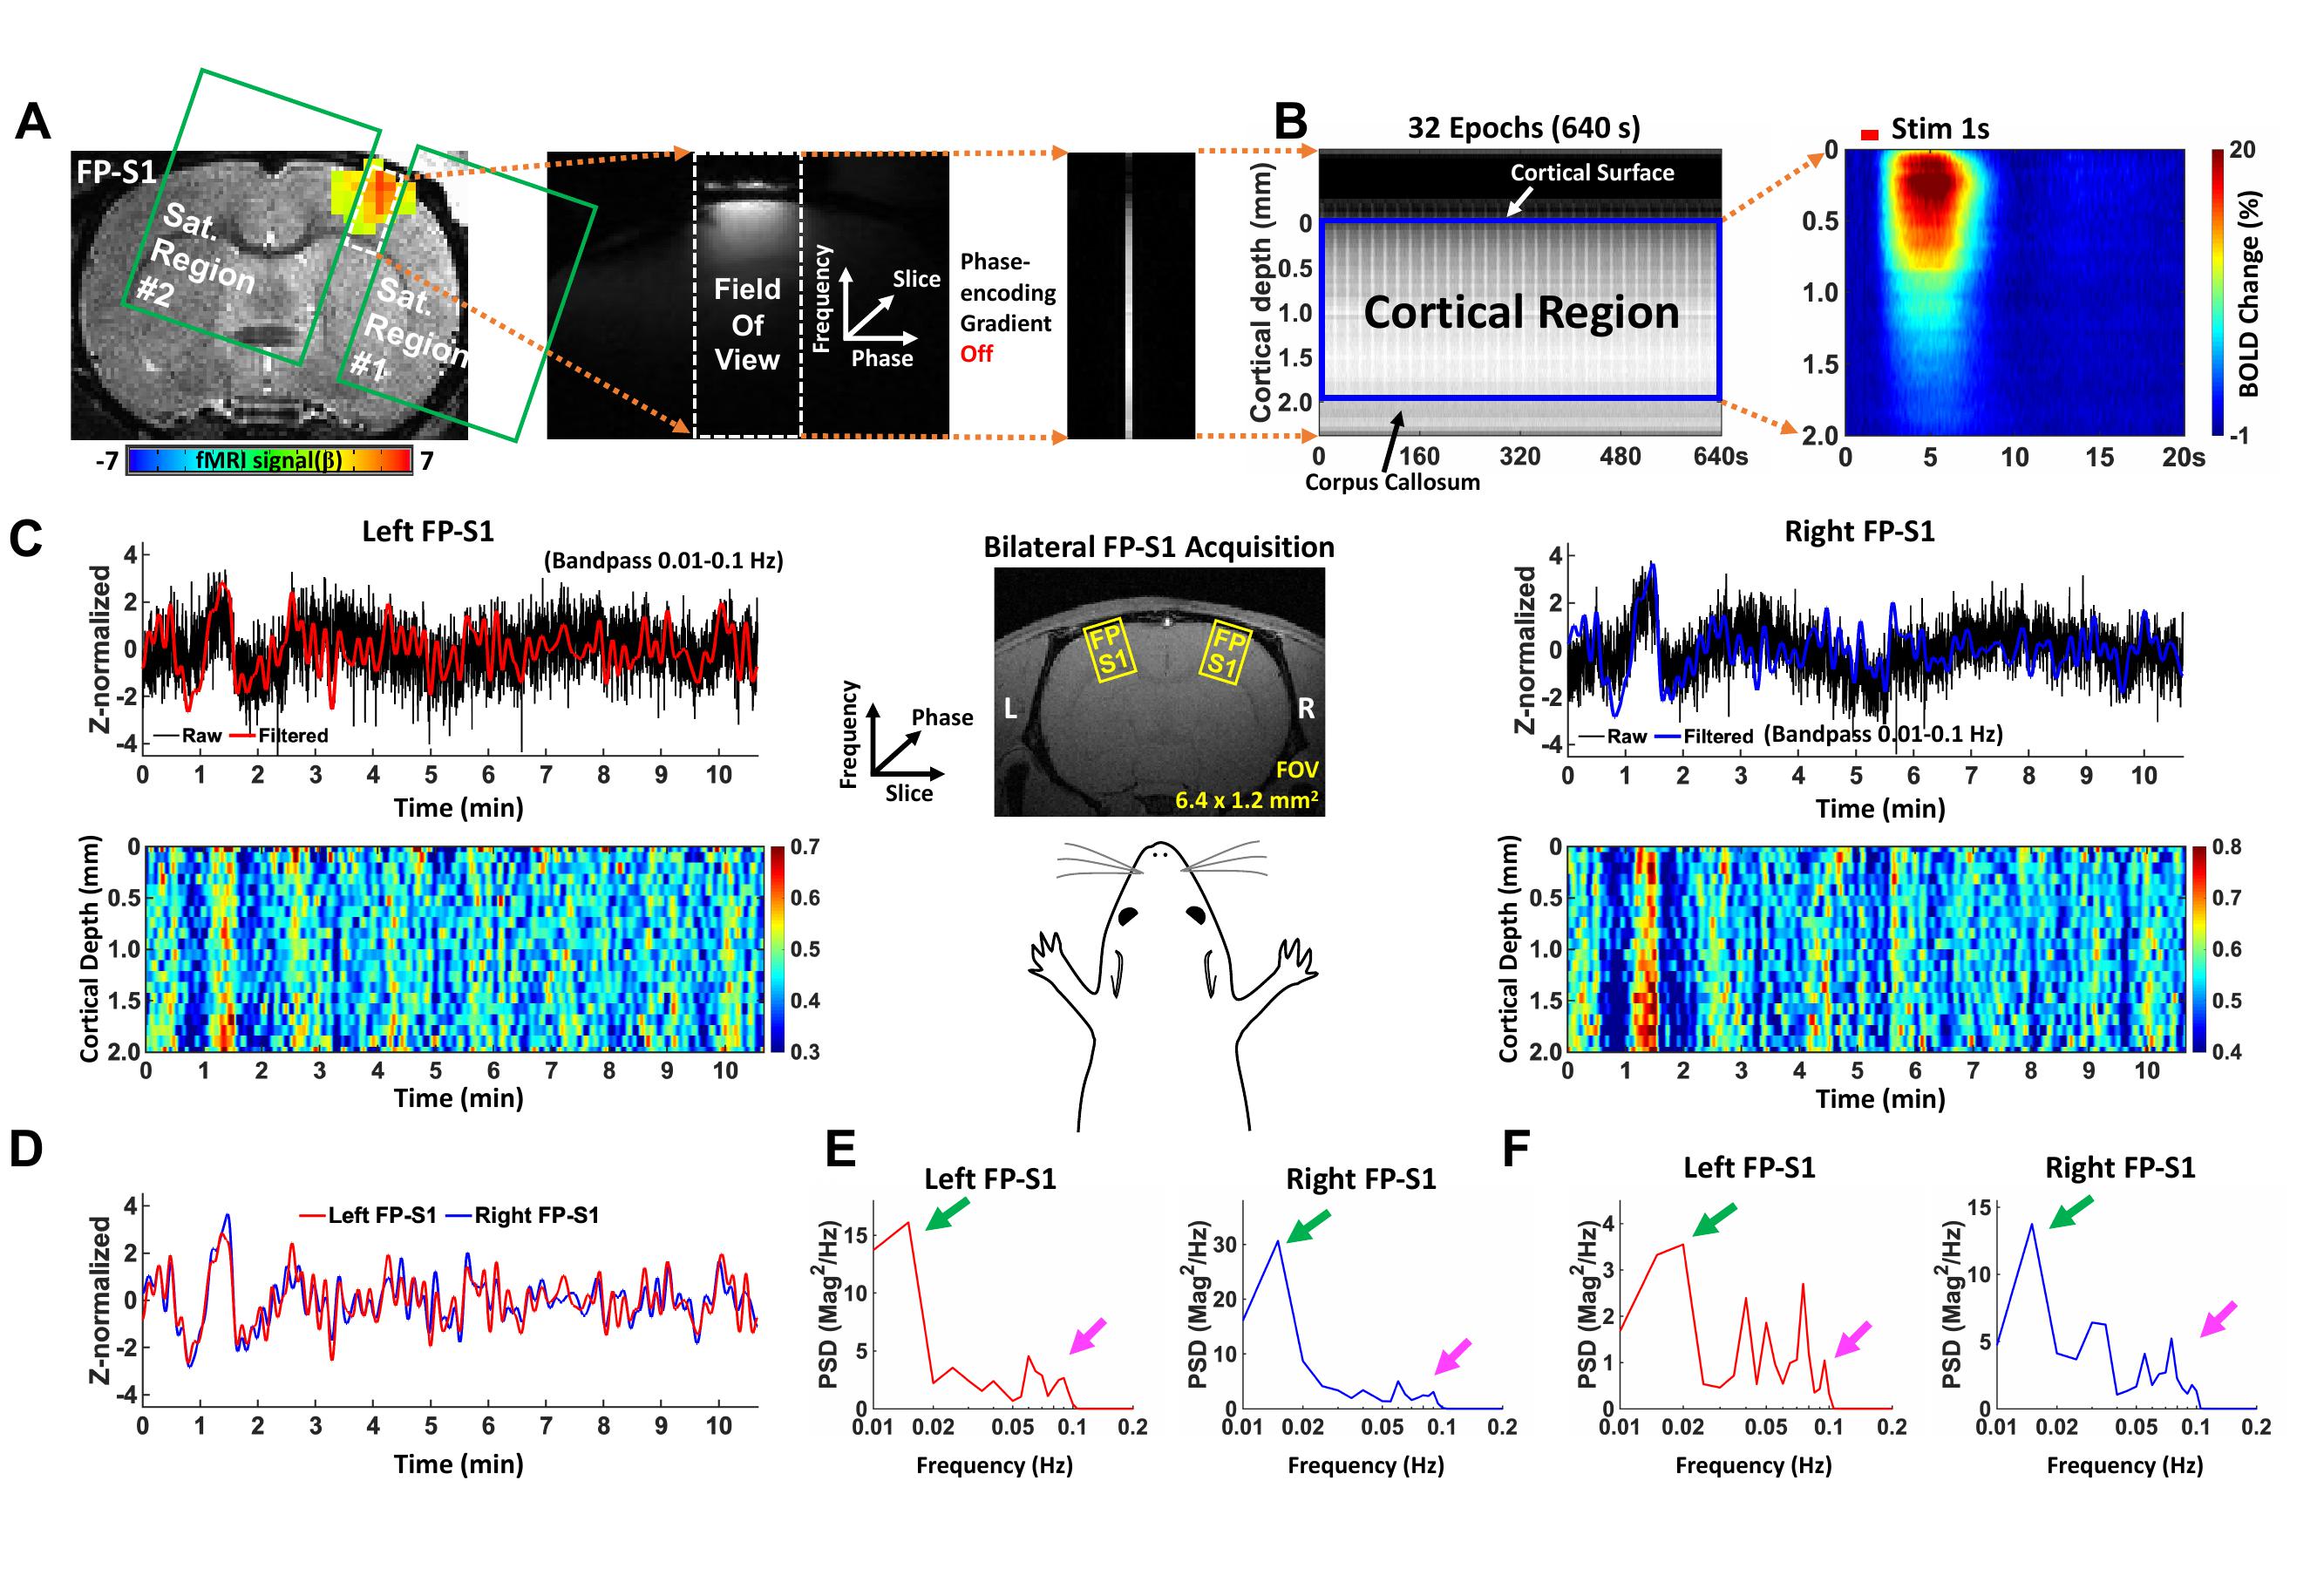
GRE based bilateral line-scanning fMRI (BiLS) datasets were acquired in 4 anesthetized rats for rs-fMRI (32 trials) using a Bruker 14.1T scanner with a home-made transceiver surface coil (22 mm diameter). BiLS method was applied by increasing the slice dimension (1 to 2) while swapping the phase and slice encoding directions and using two saturation slices to avoid aliasing artifacts in the reduced field-of-view, i.e., symmetric FP-S1 regions (Fig. 1A, C). Laminar fMRI responses from the two cortices were acquired along frequency encoding direction (Fig. 1C, middle). The following acquisition parameters were used: TR/TE 100/12.5 ms, TA 10 min 40 sec, FA 45°, slice thickness 1.2 mm, slice gap 8.0 mm, FOV 6.4 x 3.2 mm2, and matrix 64 x 32. The phase encoding gradient was turned off. A total of 6400 lines in each cortex were acquired every single trial in rs-fMRI. Coherence and PSD analysis were performed after applying a band-pass filter (0.01-0.1 Hz). All signal analyses were implemented in Matlab software (Mathworks, Natick, MA).Results
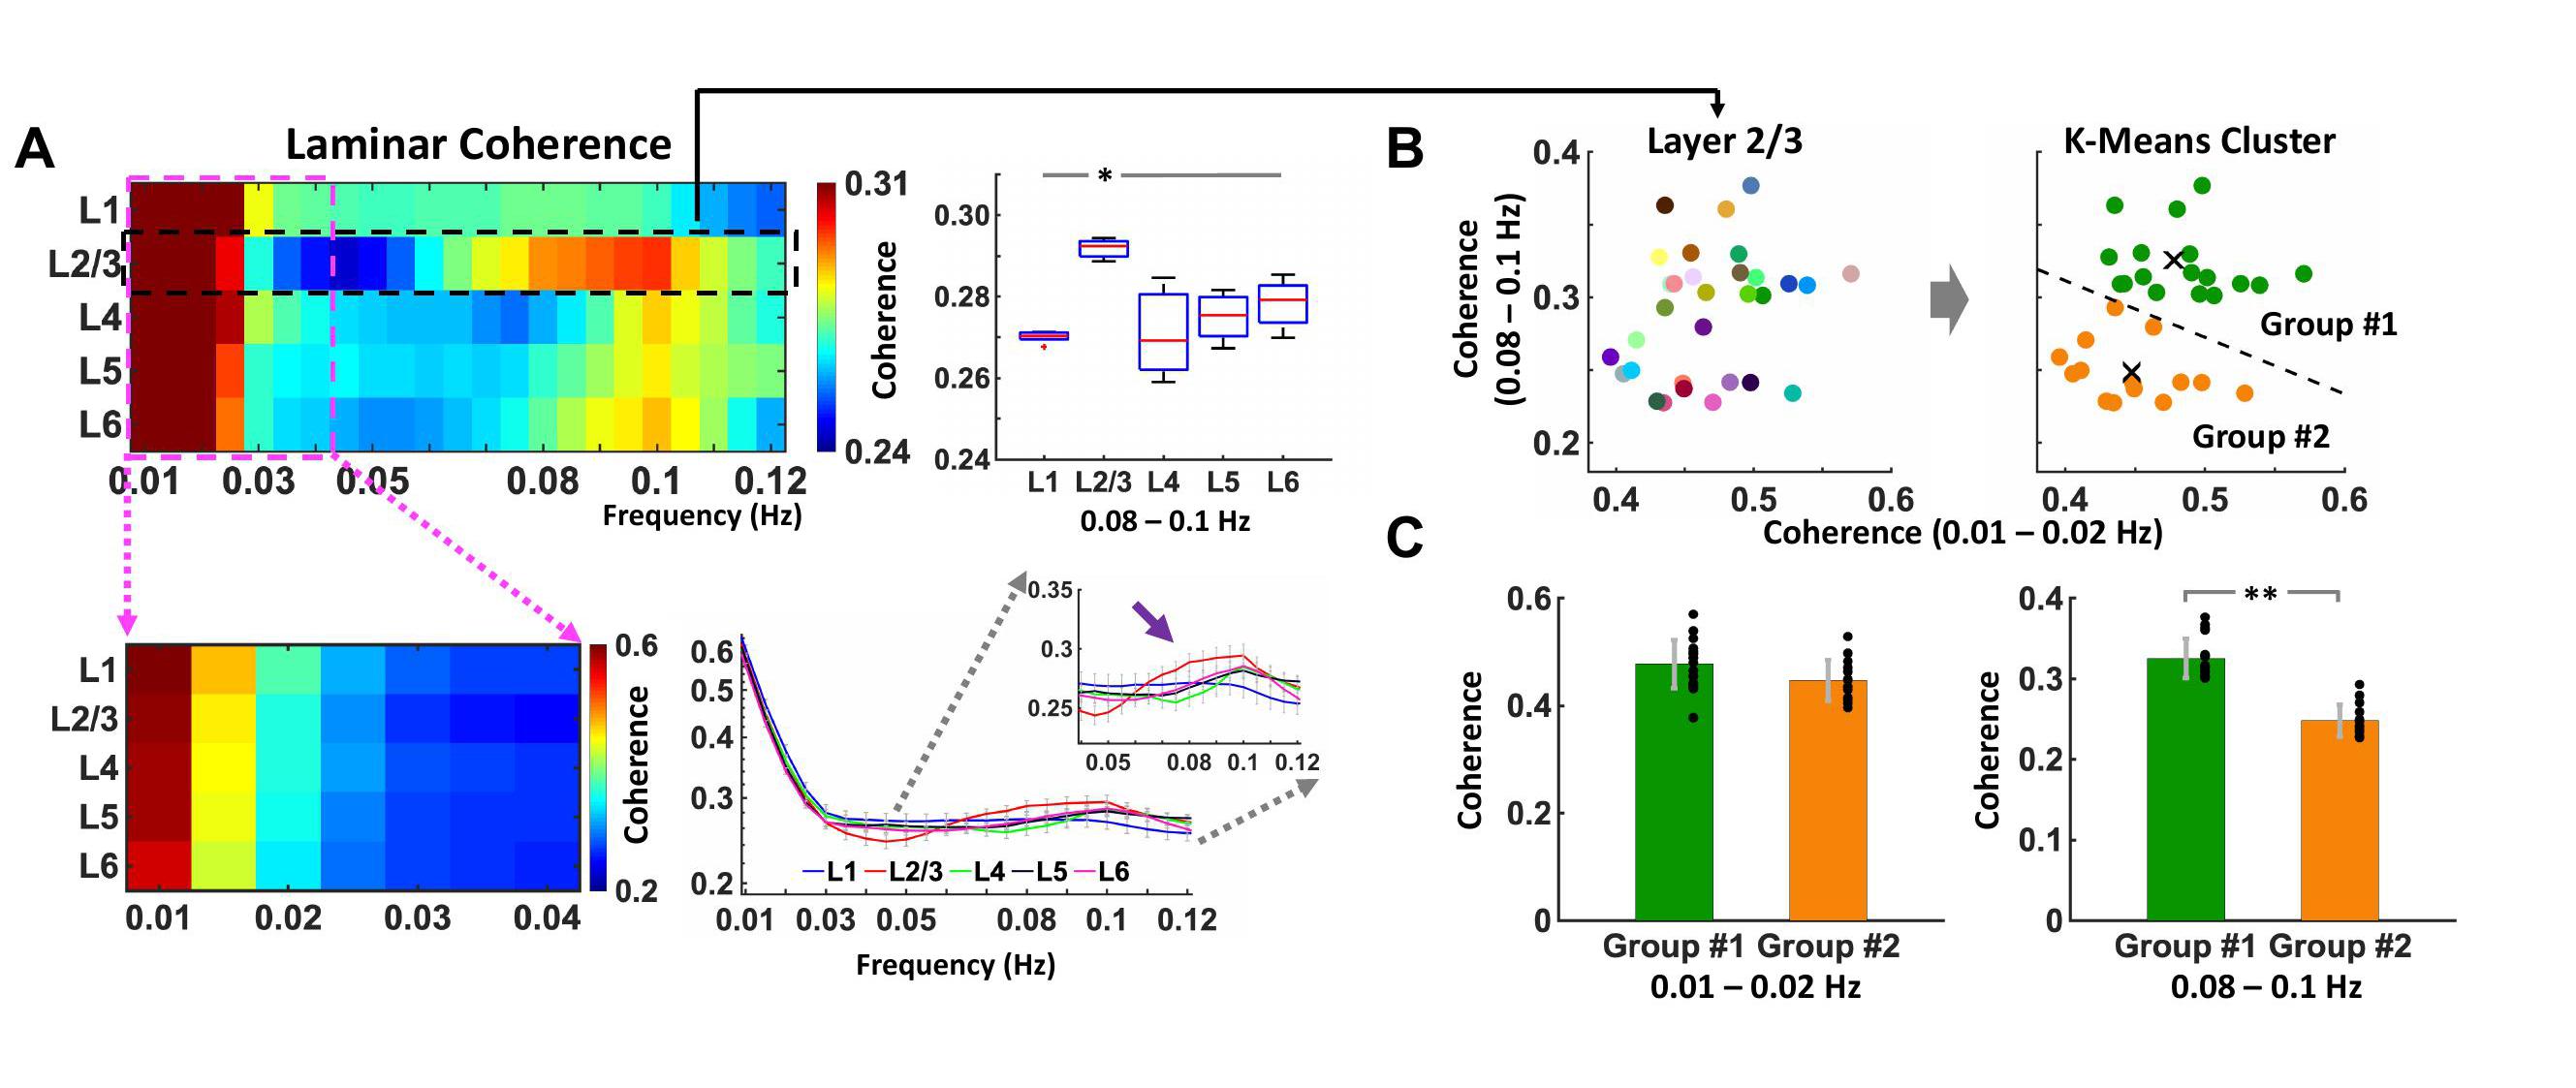
Spontaneous laminar-specific BOLD responses were simultaneously detected across the cortical depth in both the left and right FP-S1 (Fig. 1C) using BiLS method, following the sequential image processing of the conventional unilateral line-scanning (UniLS) method (Fig. 1A, B). In a representative trial, average voxel time courses in both the FP-S1 regions highly fluctuated across the cortical depth (Fig. 1C). Moreover, Fig. 1D and E show that this fluctuation was highly synchronized in the time series (D), having peaks at ultra-slow fluctuation (0.01-0.02 Hz, green arrows) and slow fluctuation (0.08-0.1 Hz, magenta arrows) in the PSD plots (E). However, some trials were less synchronized, maintaining strong ultra-slow fluctuations as Fig. 1F shows another representative trial among them. The group-averaged result of coherence (Fig. 2A) with all data sets (n = 32 trials of 4 rats) was characterized by having strong coherence at 0.01-0.02 Hz across all the layers (Layer 1-6), whereas at 0.08-0.1 Hz, the coherence in Layer 2/3 was significantly higher than in the other layers (one-way ANOVA, post-hoc: *p-value <0.05). To further investigate the laminar coherence features of Layer 2/3, we applied k-means cluster method to divide all the 32 trials into two groups, 18 trials and 14 trials in Group #1 and Group #2, respectively (Fig. 2B). Indeed, the group-averaged coherence at 0.01-0.02 Hz in L2/3 shows no significant differences in both groups, while the coherence at the 0.08-0.1 Hz in Group #1 was significantly higher than in Group #2 (Fig. 2C). Noteworthily, these findings indicate that the ultra-slow (0.01-0.02 Hz) and slow (0.08-0.1 Hz) fluctuations arose from the laminar-specific interhemispheric resting-state network, revealing the two intrinsic oscillatory fluctuations are independent of each other (**p-value = 1.4127*10^-10).Discussion and Conclusion
Using our BiLS method, we detected laminar-specific bilateral fMRI signal fluctuations in rats with high spatiotemporal resolution. We reported that bilateral ultra-slow fluctuations (0.01-0.02 Hz) were synchronized across all cortical laminae due to global brain state changes14,15, while slow fluctuations (0.08-0.1 Hz) were significantly more synchronized in Layer 2/3 where was more likely associated with intrinsic neuronal activities for the callosal projection16. Thus, we have shown the laminar-specific bilateral FC at different ranges of low frequency fluctuation based on either callosal projection or global neuromodulation6,17.Acknowledgements
This research was supported by NIH Brain Initiative funding (RF1NS113278-01, R01 MH111438-01), and the S10 instrument grant (S10 MH124733) to Martinos Center, German Research Foundation (DFG) Yu215/3-1, BMBF 01GQ1702, and the internal funding from Max Planck Society.References
[1] Biswal, B., Yetkin, F. Z., Haughton, V. M. & Hyde, J. S. Functional Connectivity in the Motor Cortex of Resting Human Brain Using Echo-Planar Mri. Magnetic Resonance in Medicine. 34 (4), 537-541, (1995).
[2] Biswal, B. B. et al. Toward discovery science of human brain function. Proc Natl Acad Sci U S A. 107 (10), 4734-4739, (2010).
[3] Biswal, B. B. Resting state fMRI: a personal history. Neuroimage. 62 (2), 938-944, (2012).
[4] Buckner, R. L., Krienen, F. M. & Yeo, B. T. Opportunities and limitations of intrinsic functional connectivity MRI. Nat Neurosci. 16 (7), 832-837, (2013).
[5] Fox, M. D. & Raichle, M. E. Spontaneous fluctuations in brain activity observed with functional magnetic resonance imaging. Nat Rev Neurosci. 8 (9), 700-711, (2007).
[6] Drew, P. J., Mateo, C., Turner, K. L., Yu, X. & Kleinfeld, D. Ultra-slow Oscillations in fMRI and Resting-State Connectivity: Neuronal and Vascular Contributions and Technical Confounds. Neuron. 107 (5), 782-804, (2020).
[7] Mateo, C., Knutsen, P. M., Tsai, P. S., Shih, A. Y. & Kleinfeld, D. Entrainment of Arteriole Vasomotor Fluctuations by Neural Activity Is a Basis of Blood-Oxygenation-Level-Dependent "Resting-State" Connectivity. Neuron. 96 (4), 936-948 e933, (2017).
[8] Baek, K. et al. Layer-specific interhemispheric functional connectivity in the somatosensory cortex of rats: resting state electrophysiology and fMRI studies. Brain Structure & Function. 221 (5), 2801-2815, (2016).
[9] Roland, J. L. et al. On the role of the corpus callosum in interhemispheric functional connectivity in humans. Proc Natl Acad Sci U S A. 114 (50), 13278-13283, (2017).
[10] Owen, J. P. et al. Resting-state networks and the functional connectome of the human brain in agenesis of the corpus callosum. Brain Connect. 3 (6), 547-562, (2013).
[11] Magnuson, M. E., Thompson, G. J., Pan, W. J. & Keilholz, S. D. Effects of severing the corpus callosum on electrical and BOLD functional connectivity and spontaneous dynamic activity in the rat brain. Brain Connect. 4 (1), 15-29, (2014).
[12] O'Reilly, J. X. et al. Causal effect of disconnection lesions on interhemispheric functional connectivity in rhesus monkeys. Proc Natl Acad Sci U S A. 110 (34), 13982-13987, (2013).
[13] Yu, X., Qian, C., Chen, D. Y., Dodd, S. J. & Koretsky, A. P. Deciphering laminar-specific neural inputs with line-scanning fMRI. Nat Methods. 11 (1), 55-58, (2014).
[14] Pais-Roldan, P. et al. Indexing brain state-dependent pupil dynamics with simultaneous fMRI and optical fiber calcium recording. Proc Natl Acad Sci U S A. 117 (12), 6875-6882, (2020).
[15] Chang, C. et al. Tracking brain arousal fluctuations with fMRI. Proc Natl Acad Sci U S A. 113 (16), 4518-4523, (2016).
[16] Fame, R. M., MacDonald, J. L. & Macklis, J. D. Development, specification, and diversity of callosal projection neurons. Trends Neurosci. 34 (1), 41-50, (2011).
[17] Duyn, J. Spontaneous fMRI activity during resting wakefulness and sleep. Prog Brain Res. 193 295-305, (2011).
Figures