0513
Layer-specific orientation selectivity in cat visual cortex using 9.4 Tesla fMRI and multi-photon optical imaging1Center for Magnetic Resonance Research and Department of Radiology, University of Minnesota, Minneapolis, MN, United States, 2Center for Magnetic Resonance Research and Department of Neuroscience, University of Minnesota, Minneapolis, MN, United States
Synopsis
Using high isotropic resolution (250 μm), cerebral blood volume weighted (wCBV) fMRI, we examined whether layer-specific cortical signals could be detected upon visual stimulation in cat primary visual cortex. We also examined single blood vessel responses (dilation, blood flow) to identical stimuli by using 2- and 3-photon imaging in the same cortical area and species. With fMRI, we often found orientation preference maps tangential and orthogonal to the cortical surface. Moreover, the laminar profile of orientation selectivity with both imaging techniques (fMRI and optical) revealed a selectivity index that was significantly lower in cortical layer 4 compared to layer 2/3.
INTRODUCTION
Neural circuits in the neocortex have a stereotypical organization, e.g., input layers are distinct from output layers. It cannot be assumed a priori that signatures of these laminar differences in neural circuitry are reflected in hemodynamic signals mediated by neurovascular coupling that form the basis of fMRI. If such laminar differences in fMRI signals could be detected, validation with single-vessel resolution would represent a critical step in demonstrating the utility of fMRI as a proxy for studying aspects of laminar neural processing. The cat primary visual cortex, with its well-established neural functional micro-architecture (1-4), provides an ideal opportunity to examine these questions.METHODS
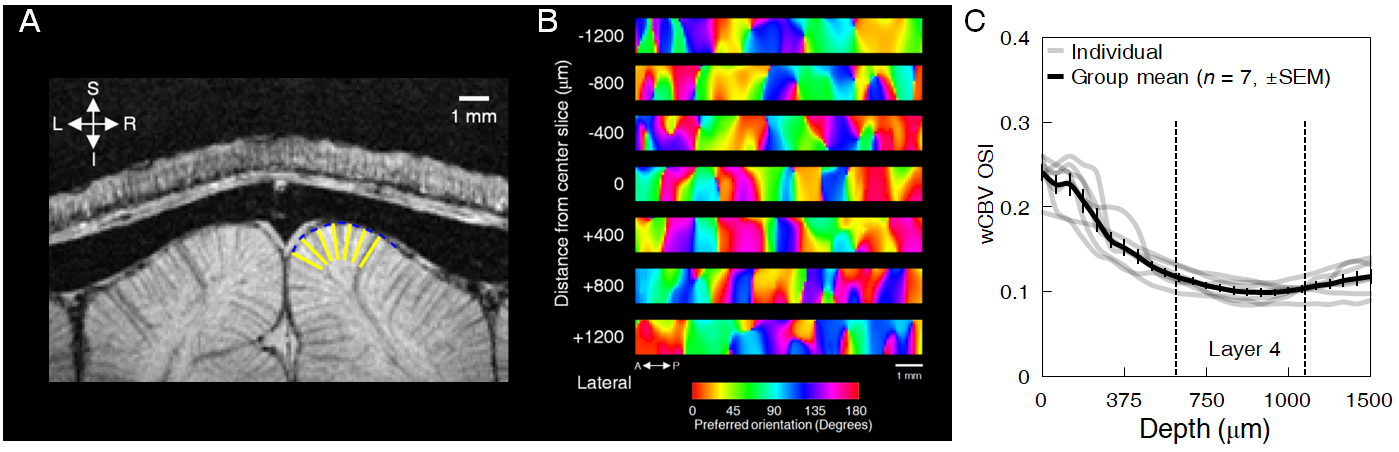
Animal preparation: 32 cats (0.8–1.6 kg, 4-16 postnatal weeks) were used for fMRI (n = 7) and optical imaging (n = 13). Animals were initially anesthetized (ketamine cocktail, 10–20 mg/kg) and subsequently maintained with 0.8-1.1% isoflurane. For wCBV fMRI, a contrast agent (Feraheme® 0.75 cc/kg) was delivered through the femoral vein. For multi-photon imaging, Alexa 680 dextran, Texas Red dextran or fluorescein dextran was used to image individual blood vessels. Vital signs were maintained in accordance with the protocol approved by the University of Minnesota Institutional Animal Care and Use Committee. Visual stimulation: Drifting square-wave grating visual stimuli were used (2 Hz temporal period, 4–8 orientations and thus double the number of directions). Functional imaging: All scans were performed on a 9.4T MRI system (Agilent, CA) with custom-made 15-mm diameter radio frequency (RF) coil. Structural imaging used flow-compensated RF-spoiled GE sequence (matrix=256×256, FOV=32×32 mm, 125 μm isotropic resolution, 10-12 slices, TR=119.86 ms, TE=5.1 ms). wCBV fMRI used 2D segmented (n=4) gradient echo EPI sequence (matrix=80×80, FOV=20×20 mm, 250 μm isotropic resolution, 6-8 slices for axial and 1-3 slice for sagittal/coronal imaging, TR=2 secs, TE=10 ms). Optical imaging: 2- and 3-photon optical imaging was carried out with a customized microscope (Bruker Ultima with 25x and 16x objective lenses, Olympus) and appropriate laser sources (5); the laminar boundaries (dorsal start and ventral end) of cortical layer was determined by post-mortem histology using vGlut2 antibody labelling and found to be 640–1150 μm from the pial surface (see dashed vertical lines in Fig. 2C). Our unpublished data in cats shows that vGlut2 selectively labels the afferent terminals arriving from the visual thalamus in cortical layer 4. Data analysis: fMRI data underwent pre-processing using the Analysis of Functional Neuroimages (AFNI), (6) (slice-timing correction, motion correction, 250 μm spatial smoothing, 0.01 – 0.3 Hz bandpass temporal filter). Then General Linear Model (GLM) was applied. Optical imaging analysis was carried out as described previously for vessel dilation and blood velocity (4). The orientation tuning curve was estimated with Von Mises function fitting (7) and orientation selectivity index (OSI) (8) was calculated based on the following formula (9): OSI = abs(∑krkei2θk / ∑krk ), where is the mean wCBV response (- ) in fMRI data or vessel dilation or blood velocity in optical imaging data across trials to stimulus of orientation.RESULTS
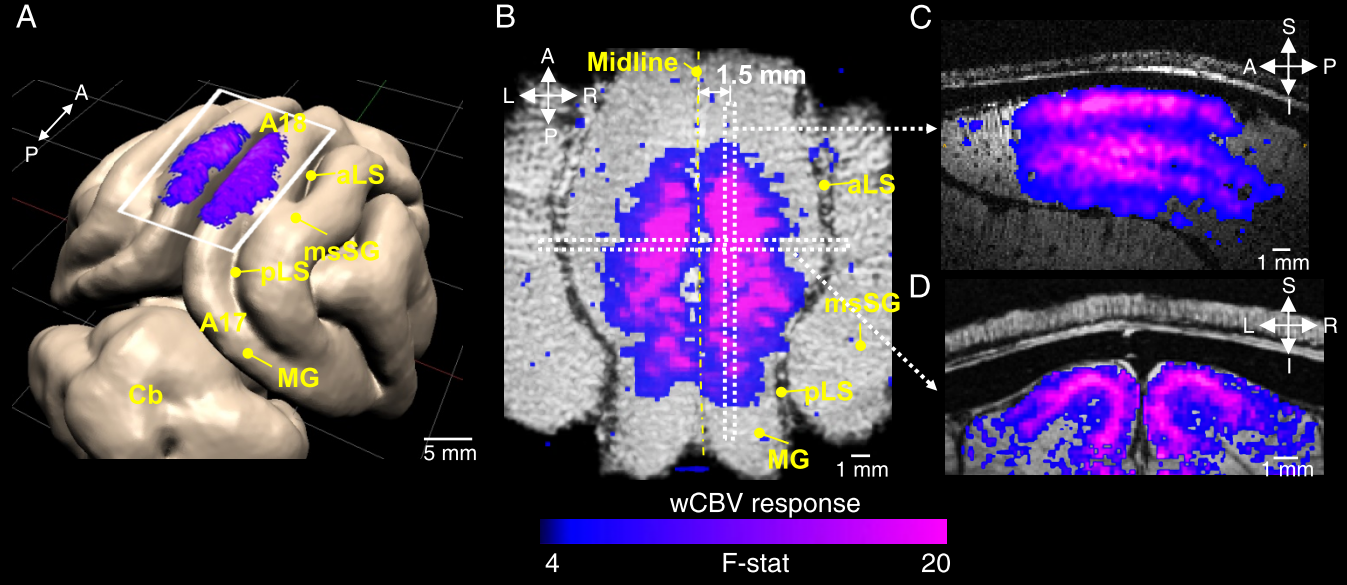
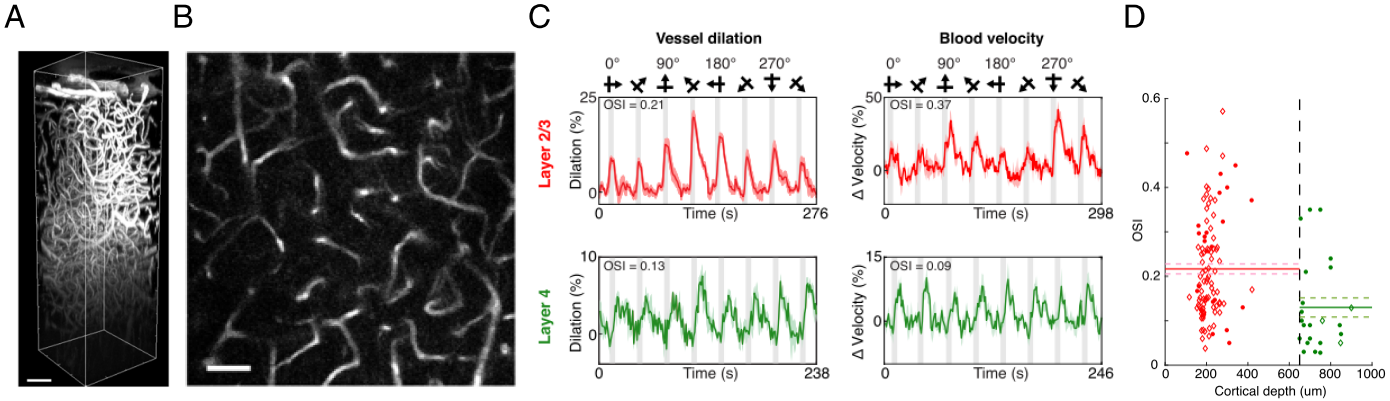
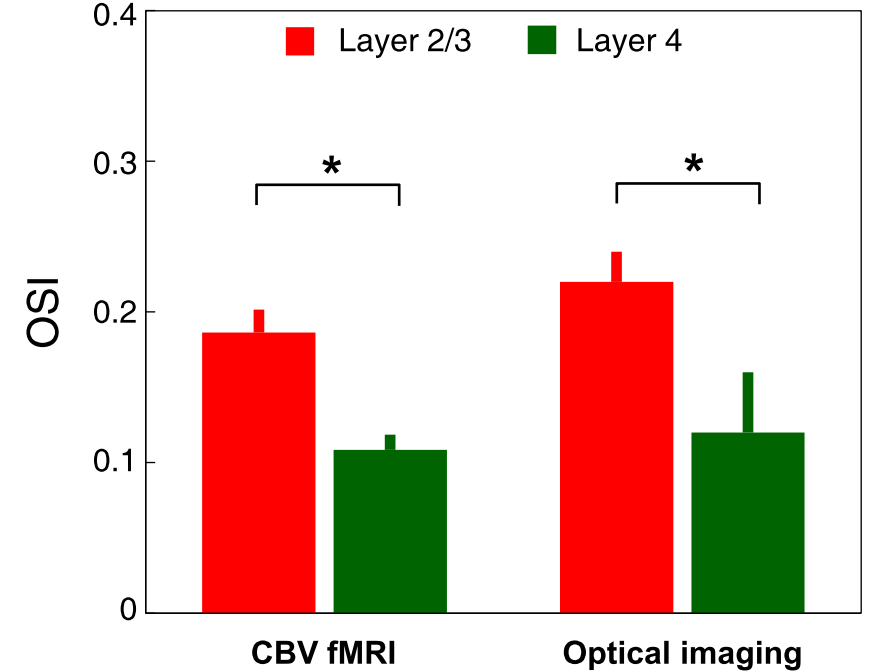
The average stimulus-induced percent signal change in wCBV fMRI was -4.2±1.0%, reaching statistical significance in all layers (F-stat > 4, P <0.001, false-discovery rate [FDR] corrected) (Fig. 1); the maximum activation was detected within the middle cortical layer (950 μm depth from cortical surface) (Fig. 1C and 1D), consistent with previous wCBV fMRI findings (10). 3D Orientation mapping based on voxel-wise wCBV responses revealed a predominantly columnar arrangement of orientation preference perpendicular to cortical surface (Fig 2); OSI in all animals, calculated from wCBV fMRI, displayed a distinctive depth-specific variation (Fig. 2C) with lowest OSI in middle cortical layer (950 μm depth). Multi-photon optical imaging revealed single blood vessel responses in layer 4 which also had lower OSI than in layer 2/3 (Fig 3). Comparing the OSI for the two different imaging techniques, showed an equivalent statistical difference (P < 0.05) between layer 2/3 and layer 4 selectivity (Fig. 4).DISCUSSION
Previous single-unit extracellular electrophysiological recordings in the cat (11) showed columnar organization of orientation preference across cortical layers. However, it is not known if this columnar representation would be detectable by fMRI methods since laminar organization of sub-threshold (synaptic) activity and vascular responses that would also impact fMRI signals is completely unknown. Previous fMRI studies obtained cortical orientation maps on the cortical surface (10, 12) but lacked the voxel resolution to delineate orientation tuning across cortical layers. Here we show a mostly columnar organization of orientation preference across cortical layers detected by wCBV fMRI. Critically, we also show a layer-dependent variation in orientation selectivity index with two independent techniques (fMRI and optical imaging); specifically, cortical layer 4 displays significantly less orientation-selective responses than cortical layer 2/3.CONCLUSION
Our findings lay the groundwork for future expansion of such comparisons between fMRI data obtained with different approaches (e.g. variants of BOLD fMRI and VASO) and aspects of neuronal activity monitored across lamina by multiphoton imaging using reporters that respond to aspects of neuronal spiking and synaptic activity (e.g., calcium and glutamate imaging (4)) towards providing a better understanding of how laminar differences in neuronal activity are reflected in neurovascular coupling and hemodynamic signals reported in fMRI techniques.Acknowledgements
This work was supported by NIH grants: R01 MH111447, R01 MH111413, R01 NS118330, P41 EB027061 and P30 NS076408; and WM KECK foundation.References
1. K. Ohki, S. Chung, Y. H. Ch'ng, P. Kara, R. C. Reid, Functional imaging with cellular resolution reveals precise micro-architecture in visual cortex. Nature 433, 597-603 (2005).
2. K. Ohki et al., Highly ordered arrangement of single neurons in orientation pinwheels. Nature 442, 925-928 (2006).
3. P. Kara, J. D. Boyd, A micro-architecture for binocular disparity and ocular dominance in visual cortex. Nature 458, 627-631 (2009).
4. P. O'Herron et al., Neural correlates of single-vessel haemodynamic responses in vivo. Nature 534, 378-382 (2016).
5. C. J. Liu, A. Roy, A. A. Simons, D. M. Farinella, P. Kara, Three-photon imaging of synthetic dyes in deep layers of the neocortex. Sci Rep 10, 16351 (2020).
6. R. W. Cox, AFNI: software for analysis and visualization of functional magnetic resonance neuroimages. Computers and Biomedical research 29, 162-173 (1996).
7. M. Villeneuve, M. Vanni, C. Casanova, Modular organization in area 21a of the cat revealed by optical imaging: comparison with the primary visual cortex. Neuroscience 164, 1320-1333 (2009).
8. D. L. Ringach, R. M. Shapley, M. J. Hawken, Orientation selectivity in macaque V1: diversity and laminar dependence. Journal of Neuroscience 22, 5639-5651 (2002).
9. P. O’Herron, M. Levy, J. J. Woodward, P. Kara, An Unexpected Dependence of Cortical Depth in Shaping Neural Responsiveness and Selectivity in Mouse Visual Cortex. Eneuro 7 (2020).
10. F. Zhao, P. Wang, K. Hendrich, S.-G. Kim, Spatial specificity of cerebral blood volume-weighted fMRI responses at columnar resolution. Neuroimage 27, 416-424 (2005).
11. A. Shmuel, A. Grinvald, Functional organization for direction of motion and its relationship to orientation maps in cat area 18. J Neurosci 16, 6945-6964 (1996).
12. E. Yacoub, N. Harel, K. Uğurbil, High-field fMRI unveils orientation columns in humans. Proceedings of the National Academy of Sciences 105, 10607-10612 (2008).
Figures