0512
Neural activity-driven BOLD responses within the cortex occur first at synaptic input layers1Center for Neuroscience Imaging Research (CNIR), Institute for Basic Science (IBS), Suwon, Korea, Republic of, 2Department of Biomedical Engineering, Sungkyunkwan University, Suwon, Korea, Republic of
Synopsis
To further advance understanding of brain functions, identifying the direction of information flow, such as thalamocortical vs. corticothalamic projections, is critical. Because the early hemodynamic response at microvessels near active neurons can be detected by ultrahigh field fMRI, we propose using the onset times of fMRI responses to discern the information flow. This approach was confirmed by observing the high temporal resolution BOLD fMRI responses to bottom-up somatosensory stimulation and top-down optogenetic stimulation of the primary motor cortex in anesthetized mice at ultrahigh field of 15.2 T.
Purpose
One goal of fMRI research is to demonstrate the temporal sequence of neural events in brain. Since the contribution of local capillaries to BOLD-fMRI increases with the field strength1,2, we hypothesized that early hemodynamic responses at ultrahigh fields would reflect the neural information flow. Sensory-evoked fMRI response was observed first in thalamocortical input layer (L4) within primary somatosensory cortex (S1)3-5, suggesting that early fMRI signal reflect synaptic input. However, differences in onset responses between layers could be related to differences in their hemodynamic response functions6. Thus, systemic study of neural processing orders is crucial to determine whether neural activation sequence could be identified by layer-dependent onset times.Here, we performed high-temporal-resolution mouse fMRI at ultrahigh field while conducting bottom-up somatosensory stimulation, top-down optogenetic stimulation, and hypercapnic challenge.
Materials & Methods
Naïve C57BL/6 mice were used to determine the timing of functional responses to somatosensory-stimulation (N=7) and hypercapnia (N=7), and transgenic Thy1-ChR2 mice (N=6) were used to reverse the order of information flow by photo-stimulation of excitatory neurons in primary motor cortex (M1, AP: 0.05mm, ML: 1.1mm, and DV: 0.25mm).fMRI data were acquired using single-shot GE-EPI sequence at ultrahigh field of 15.2T, temporal resolution of 250ms (TE=11ms), and spatial resolution of 156×156×500μm3 from ketamine-xylazine anesthetized mice. For fMRI studies, we designed three stimulus conditions to induce; 1) thalamocortical (TC) inputs to S1FL by forepaw-stimulation (4Hz, 0.5mA), 2) corticocortical (CC) inputs to S1FL by optogenetic-M1-stimulation (20Hz, 2mW, Ø105µm), and 3) hemodynamic response without evoking neural activity by hypercapnic challenge (10% CO2). Each fMRI trial consisted of 40-s pre-stimulus, 20-s stimulus, 60-s inter-stimulus, 20-s stimulus, and 60-s post-stimulus periods (averaging of 15 fMRI trials).
To define layer-dependent response, cortical section was flatted by projecting lines radially perpendicular to cortical surface7, and was resampled to double using bicubic interpolation. S1FL section was sub-divided into three-evenly-spaced-ROIs by depth: upper (L2/3), middle (L4/5), and lower layers (L6) (Fig.1A). Two stimulus blocks were averaged to improve detectability, and mean signal changes during stimulation were calculated, excluding the initial 6s after stimulus onset. To obtain the BOLD dynamics temporal responses within each ROI were fitted using the gamma-variate functions. Time to 5% of peak was used as the onset time of hemodynamic responses without contribution from drainage of downstream vessels.
Results
Cortical depth–dependent responses were visualized using time-dependent percent change maps with 2s moving average window at 1s interval (Fig.1B). Sensory-evoked response within S1FL was evoked first at middle layer and then gradually propagated to surface and deeper layers. Later, the highest response was observed in upper-S1FL-layer, where large draining veins are concentrated. Optogenetic-M1 response occurred first in upper cortical layers, and it propagated downward over time, though the largest signal was in upper layer. Hypercapnia-induced response began at M1 surface and then shifted to upper-S1FL-layer before penetrating into deeper cortical layers, suggesting that laminar BOLD responses to neural stimulation and the hypercapnia have different origins.To investigate whether BOLD magnitude or early BOLD onset can identify the layers receiving synaptic inputs, BOLD responses in three layer-dependent ROIs were measured and analyzed using the gamma-variate fitting process (Fig.2A). Signal changes were highest in upper layers (Fig.2B.i) and decreased monotonically with cortical depth. Laminar responses normalized by response at deeper cortical depth were consistent across all experimental conditions (Fig.2B.ii). Overall, BOLD magnitude changes cannot identify the layers receiving synaptic input.
Sensory-evoked onset response of middle cortical layers tended to be slightly faster than that of upper and lower layers of S1FL (Fig.3). M1-excited-S1FL response was first observed in upper layer, followed by middle and lower layers. Indeed, CC projection from M1 produced the earliest response in upper-S1FL-layers. Hypercapnia-induced hemodynamic responses showed a tendency to begin in upper layers and move to middle and lower layers.
Discussion & Conclusion
Many studies of animals have investigated feasibility of using dynamic BOLD-fMRI to obtain information from synaptic input layers3-5. Although onset times depend heavily on BOLD sensitivity, temporal resolution, strength of neural activity, and anesthesia, common observation is that sensory-evoked response starts at S1-L4.In our study, somatosensory-stimulation induced the earliest BOLD response at L4/5, whereas optogenetic-M1-stimulation produced first in L2/3. The L4 neurons are known to respond first during somatosensory-stimulation due to TC inputs from ventral thalamus, whereas L2/3 neurons respond during optogenetic-M1-stimulation due to CC inputs from M18,9. Thus, the earliest BOLD onset indeed occurs at the layers receiving synaptic input.
Neural activity-driven vascular responses occur first in capillary bed and then propagate to upstream (arterial network toward the pial surface) and downstream (venous) vessels10,11. Thus, neural activity-driven capillary action is the earliest within vasculature. Meanwhile, vascular response caused by increase in CO2 level is mediated by increase in extracellular pH that leads to relaxation of smooth muscles in arteries but does not involve neurons12,13. Therefore, vascular-driven action starts at superficial layers and propagates to deeper layers due to faster arterial blood delivery and shorter path lengths between arteries and veins for superficial layers.
In summary, BOLD onset response to hypercapnia is highly sensitive to arterial blood delivery, whereas that to neural-stimulation reflects capillary responses near active neurons, indicating that ultrahigh-resolution BOLD-fMRI at ultrahigh fields will provide insights to determine the direction of neural information flow.
Acknowledgements
This work was supported by IBS-R015-D1.References
1. Ogawa S, Menon RS, Tank DW, et al. Functional brain mapping by blood oxygenation level-dependent contrast magnetic resonance imaging. A comparison of signal characteristics with a biophysical model. Biophys J. 1993;64(3):803-812.
2. Uludağ K, Müller-Bierl B, & Uğurbil K. An integrative model for neuronal activity-induced signal changes for gradient and spin echo functional imaging. NeuroImage. 2009;48(1):150-165.
3. Silva AC, & Koretsky AP. Laminar specificity of functional MRI onset times during somatosensory stimulation in rat. PNAS. 2002;99(23):15182-15187.
4. Yu X, Qian C, Chen DY, et al. Deciphering laminar-specific neural inputs with line-scanning fMRI. Nature methods. 2014;11(1):55-58.
5. Jung WB, Shim HJ, & Kim SG. Temporal dynamics of mouse BOLD fMRI in the sensory pathway. Prog Neurobiol. Proc 27th Annual Meeting, ISMRM. 2019.
6. Handwerker DA, Ollinger JM, & D'Esposito M. Variation of BOLD hemodynamic responses across subjects and brain regions and their effects on statistical analyses. NeuroImage. 2004;21(4):1639-1651.
7. Shih YY, Chen YY, Lai HY, et al. Ultrahigh-resolution fMRI and electrophysiology of the rat primary somatosensory cortex. NeuroImage. 2013;73:113-120.
8. Habas C, & Manto M. The Cerebellar Thalamus, Cerebellum. 2019;18:635-648.
9. Ni J, & Chen JL. Long-range cortical dynamics: a perspective from the mouse sensorimotor whisker system. Eur J Neurosci. 2017;46:2315-2324.
10. Iadecola C, Yang G, Ebner TJ, et al. Local and propagated vascular responses evoked by focal synaptic activity in cerebellar cortex. Journal of neurophysiology. 1997;78(2):651-659.
11. Hall CN, Reynell C, Gesslein B, et al. Capillary pericytes regulate cerebral blood flow in health and disease. Nature. 2014;508:55-60.
12. Brian JE, Jr. Carbon dioxide and the cerebral circulation. Anesthesiology. 1998;88(5):1365-1386.
13. Iadecola C, Arneric SP, Baker HD. Role of local neurons in cerebrocortical vasodilation elicited from cerebellum. Am J Physiol. 1987;252:1082-1091.
Figures
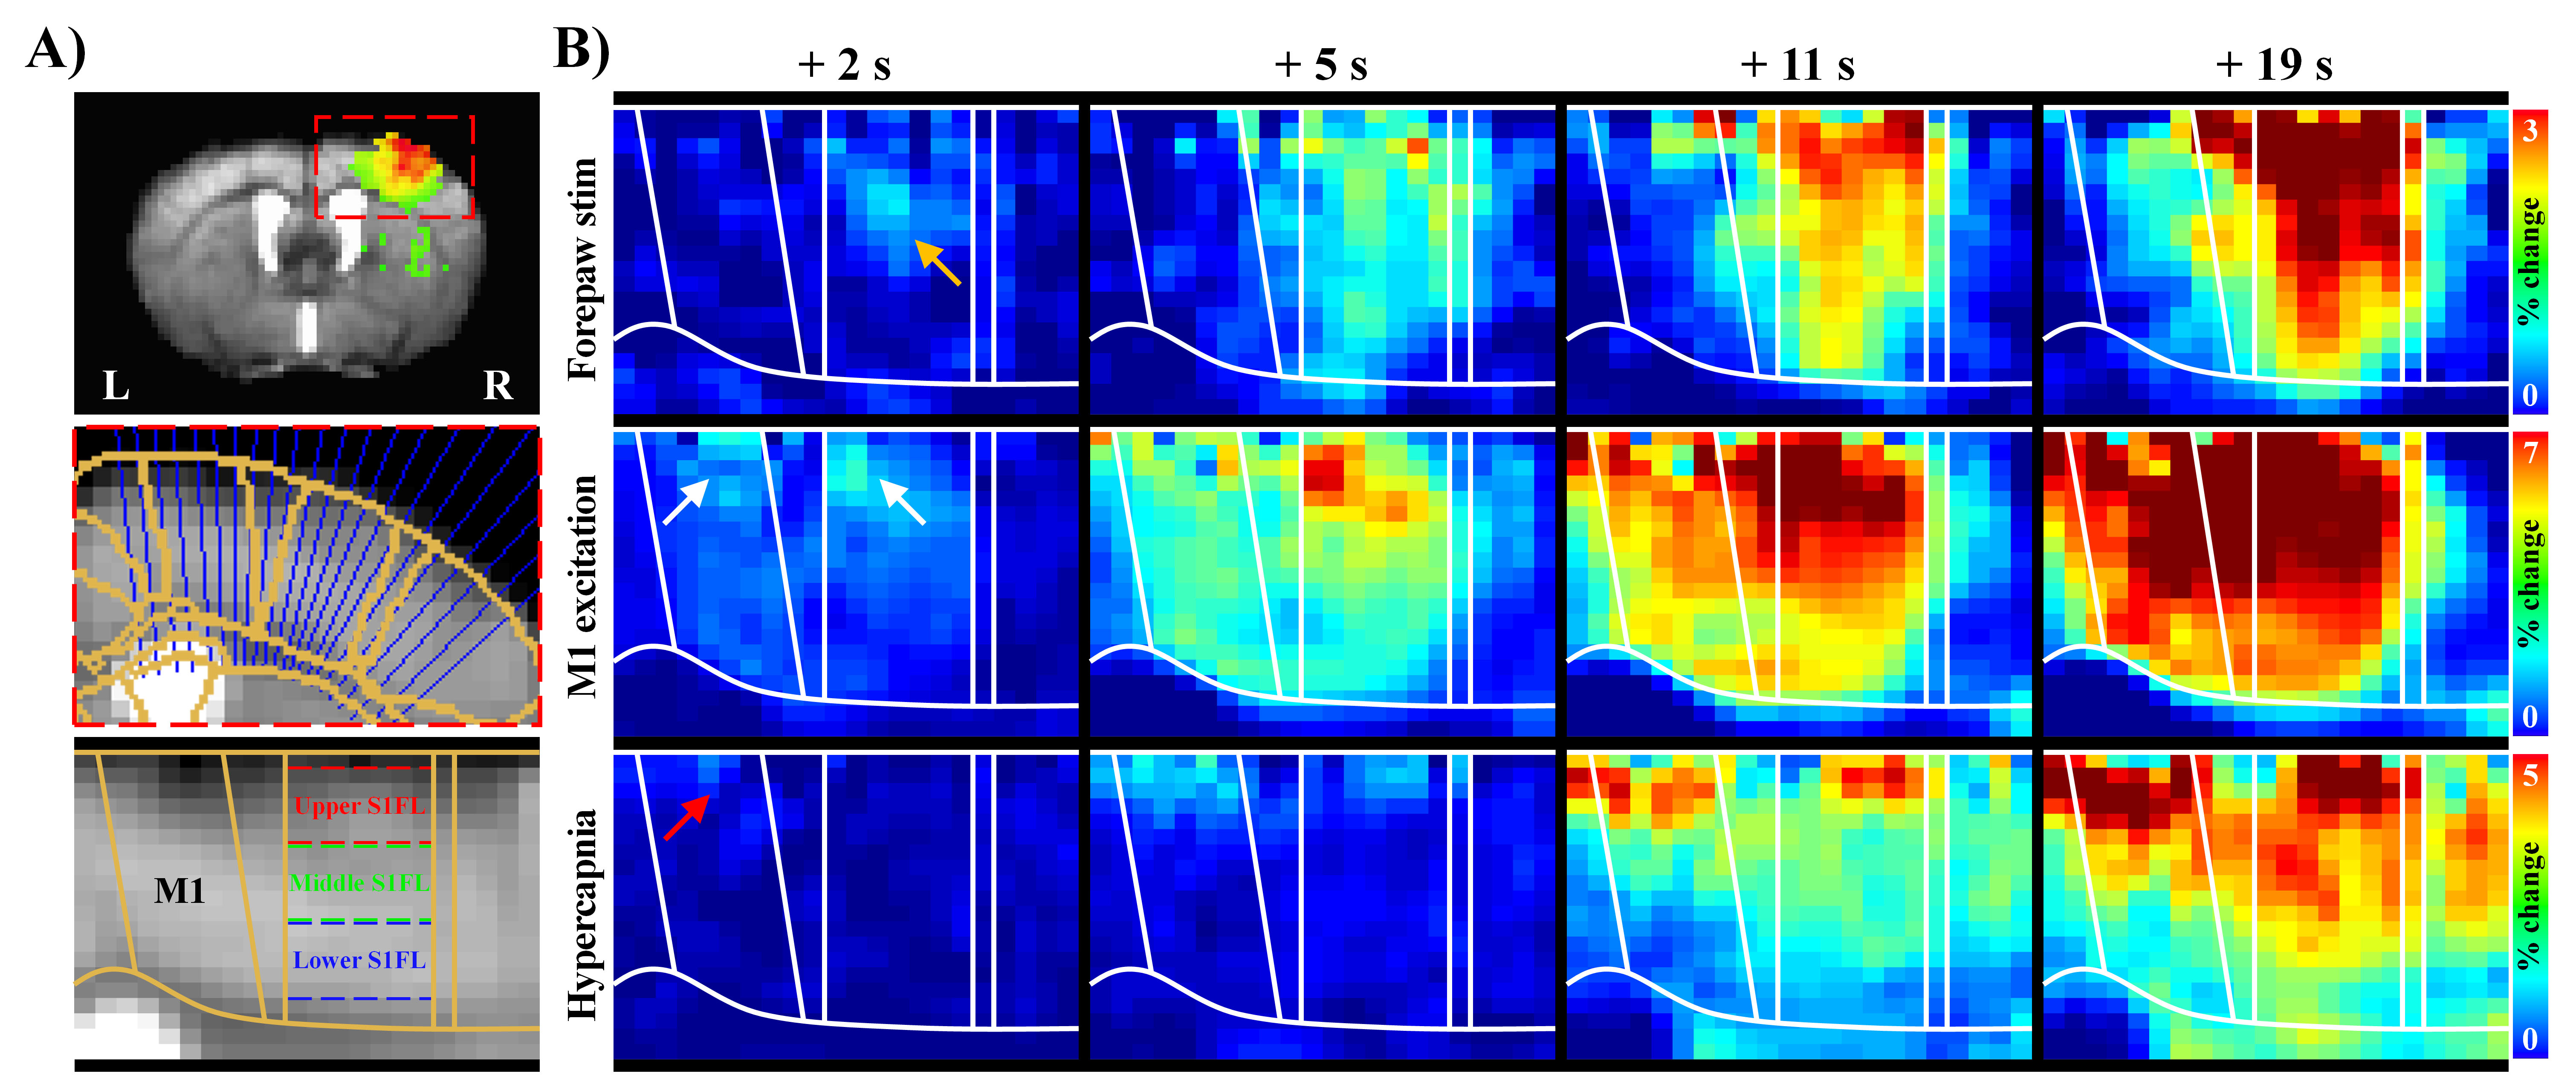
Figure 1. Laminar BOLD responses to neural stimulation and hypercapnic challenge have different origins.
A) The cortical areas (S1FL and M1) were linearized using radially projecting lines perpendicular to the cortical edges.
B) Dynamic BOLD changes were calculated with average window of 2 s duration at interval of 1 s. Sensory-evoked responses first appeared in S1FL middle layer (yellow arrow), whereas early responses by M1 excitation in upper areas of M1 and S1FL (white arrows), and hypercapnic responses started in M1 upper layer (red arrow).
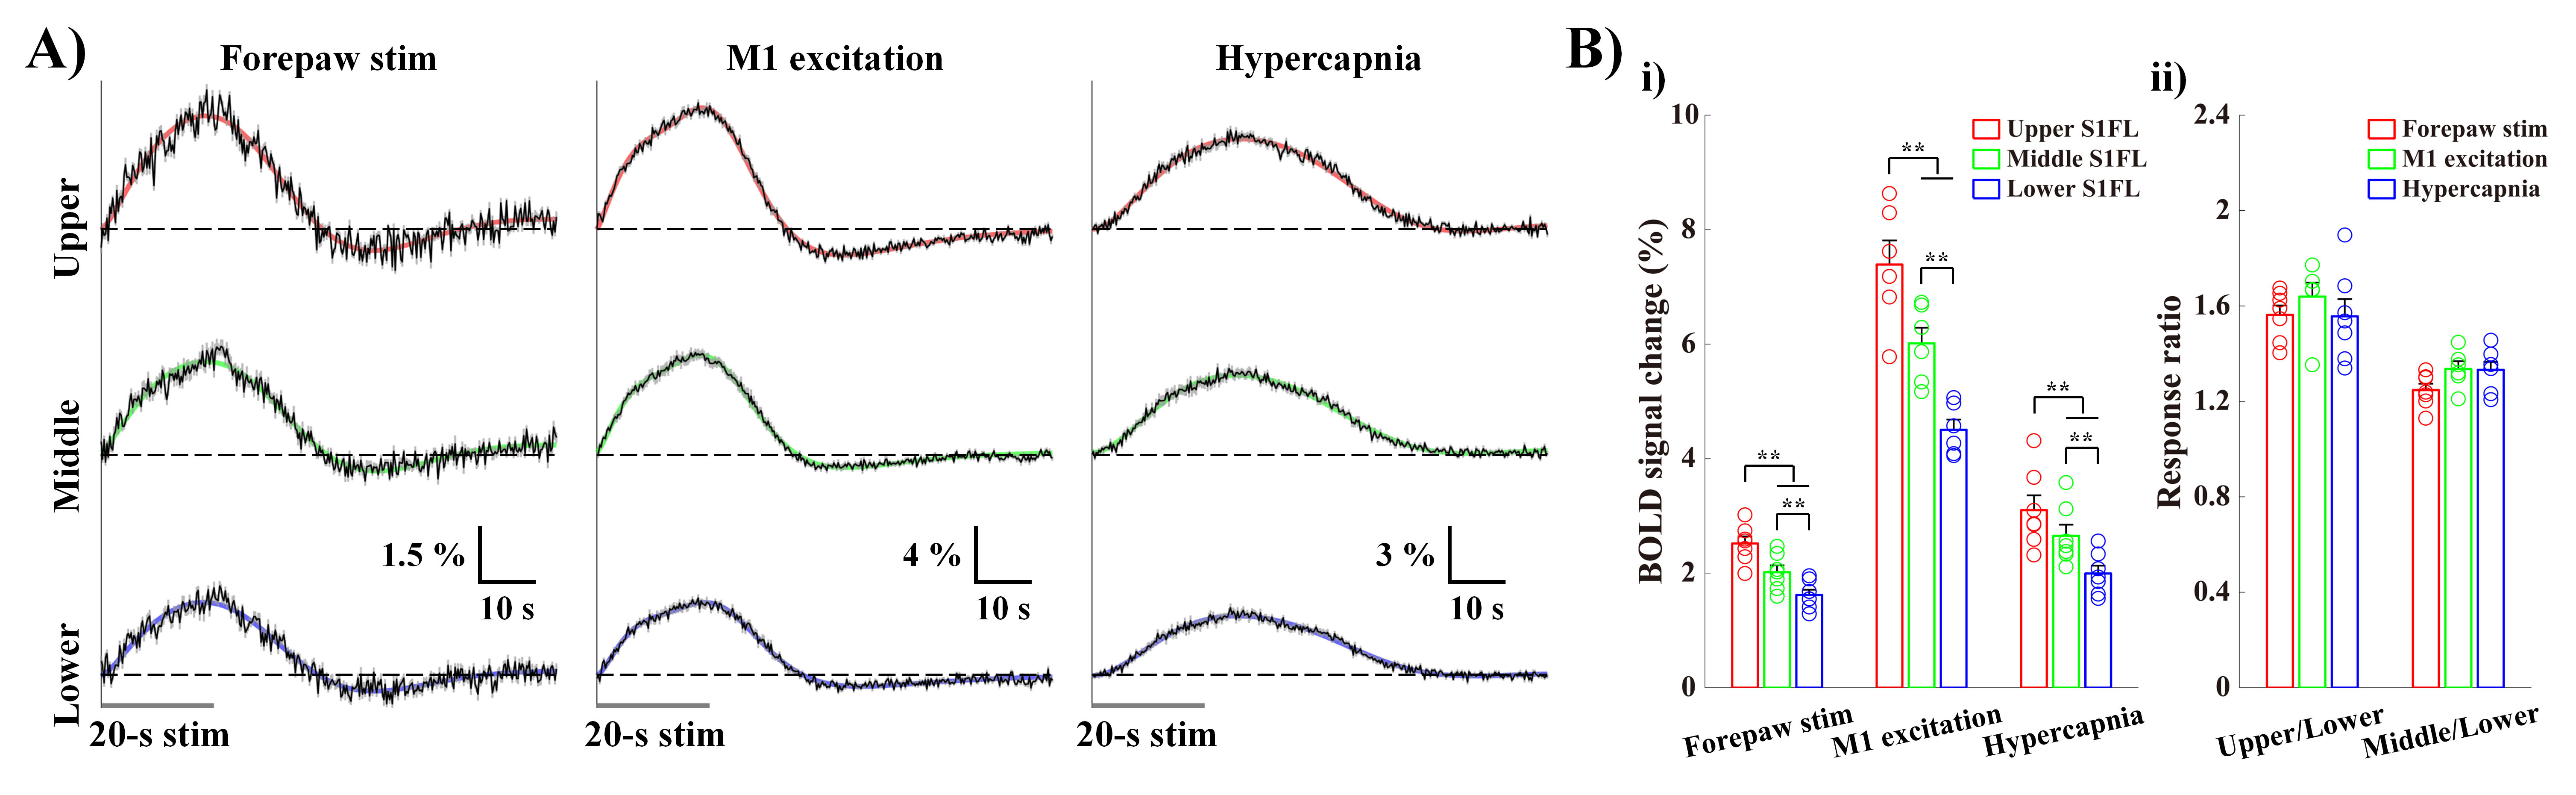
Figure 2. BOLD magnitude change cannot identify the layers receiving synaptic inputs.
A) fMRI time-courses in the S1FL layer-specific ROIs (black) were measured to quantify the signal changes, and fitted (colored) using the gamma variate functions to determine the HRFs.
B) Mean signal changes during stimulations monotonically decreased with depth (i). However, the laminar responses normalized by the response at deeper ROIs were consistent under all experiments (ii).
error bars, SEM; colored circles, individual data; **, p < 0.01 (repeated ANOVA followed by
Tukey post hoc test).
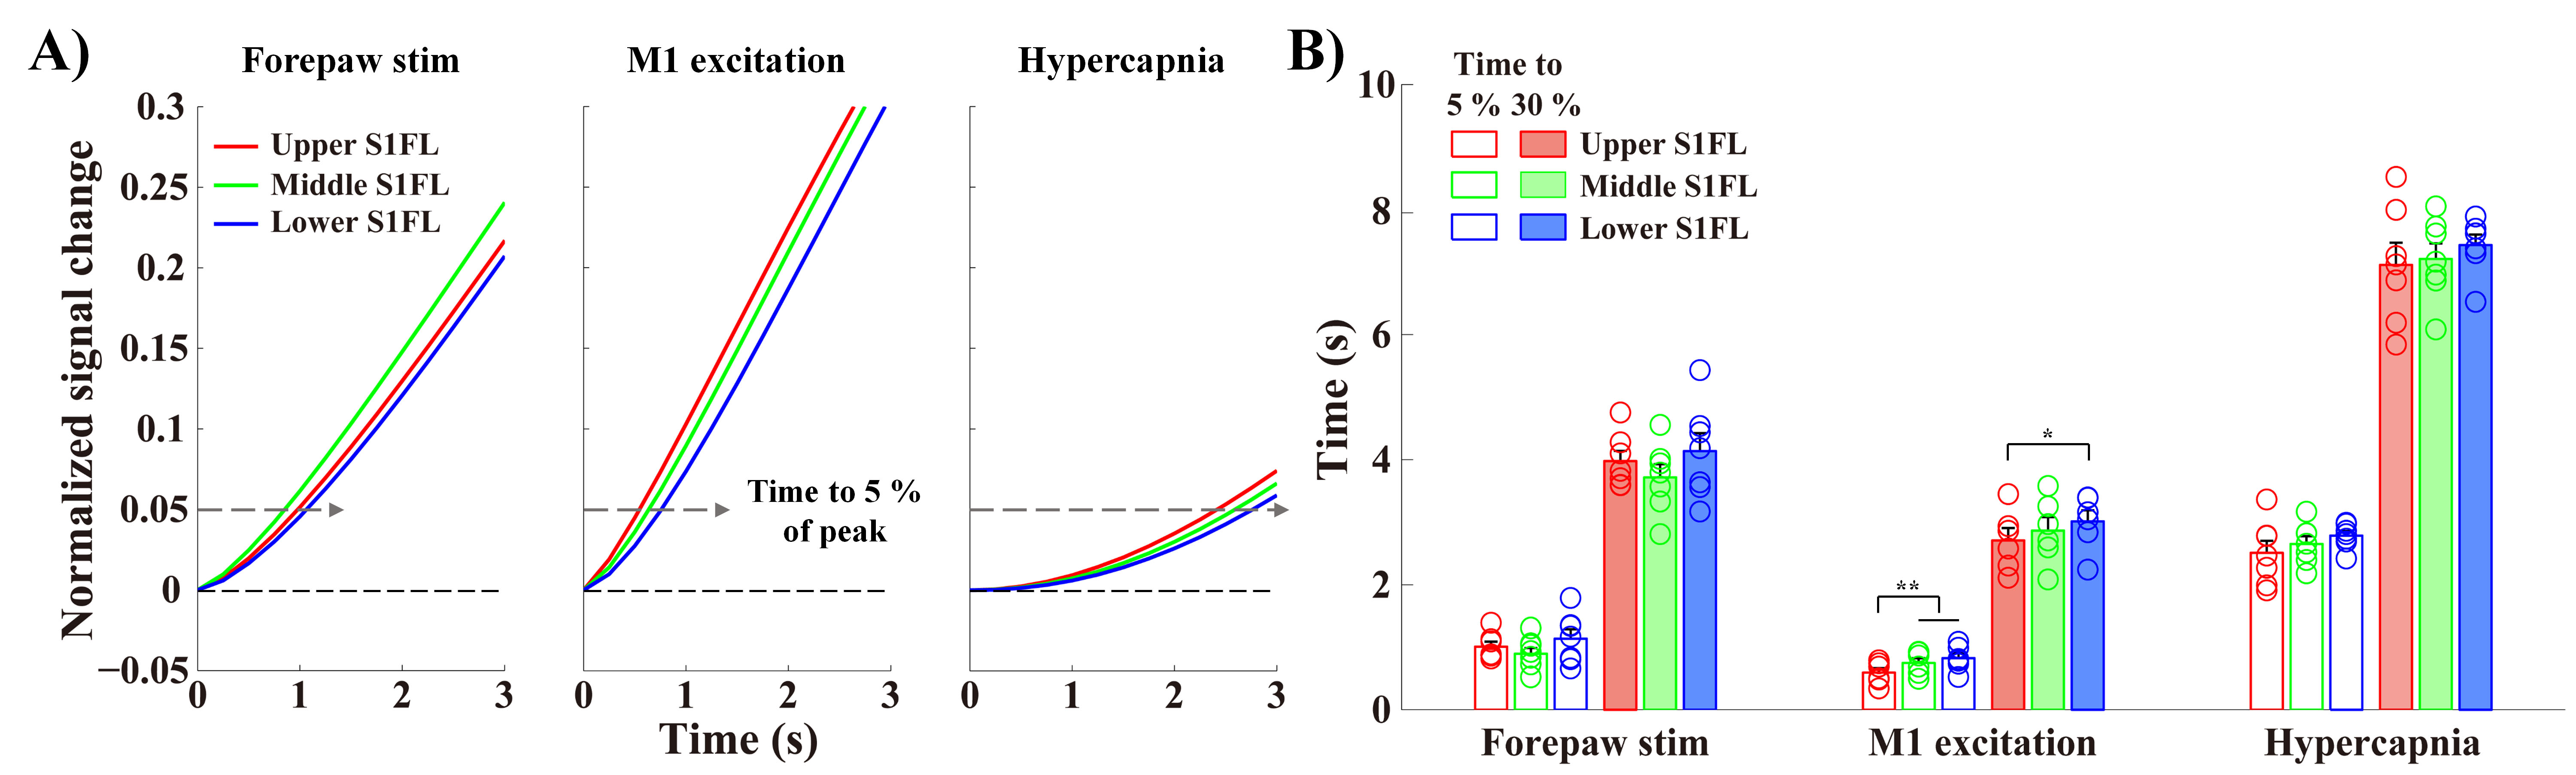
Figure 3. Layers receiving synaptic inputs show the earliest BOLD responses.
A-B) The fitting curves were normalized to the peak (showing from 0 s to 3 s after stimulus onset), and the times to reach 5 % and 30 % of the peak were then measured in the S1FL layer-specific ROIs. The order of early BOLD responses was Middle → Upper → Lower for forepaw stimulation and Upper → Middle → Lower for M1 excitation and hypercapnia.
error bars in B, SEM; colored circles in B, individual animal data; * and ** in B, p < 0.05 and p < 0.01, respectively (repeated ANOVA followed by Tukey post hoc test).