0511
BOLD fMRI and functional ultrasound comparisons in co-registered olfactory bulb sections of the same mice1NeuroSpin, CEA, Paris, France, 2Inserm - Institut de la Vision, Paris, France, 3Physics for Medicine, ESPCI, INSERM, CNRS, PSL Research University, Paris, France
Synopsis
Using UHF (17.2T) BOLD fMRI on the mouse Olfactory Bulb (OB) we recorded odor activation at high spatio-temporal resolution (0.17x0.17x0.3 mm; TR= 250ms). With 6% 1s odor application we found fast unimodal activations. Increasing odor concentration and duration (35% 5s) we revealed the second vascular component. Adding functional ultrasound (fUS) recordings from the co-registered OB coronal section, we could verify an overall good accordance in the dynamics of BOLD and fUS signals in small ROIs (< 0.5 mm^3), although evident differences were also found in some ROIs. We aim at highlighting the relationship between local vascular activity and BOLD fMRI.
Introduction
Multi-modal approaches help better understand the origin of neuroimaging contrasts and compare new techniques with established methods. Recently, we have introduced a novel chronic mouse preparation suitable for serial recordings with Two-Photon Microscopy (TPM), functional ultrasound Power Doppler (fUS-PD), and BOLD fMRI(1). Using this preparation, we showed that the micro- and mesoscopic imaging techniques similarly report the activation of the Olfactory Bulb (OB) to increasing odor concentrations, with the vascular responses showing a linear relationship with microscopic neuronal responses. In a subsequent study, we focused on TPM and fUS-PD signals only, comparing the microscopic neuronal and vascular activation in a single glomerulus to the single fUS voxel containing it, in its center(2). Microscopic vascular and single fUS-PD voxel responses to odor stimulation have been found very similar in their dynamics (Pearson coefficient > 0.9).Motivated by these results, in this study we compare BOLD fMRI and fUS-PD responses.
Methods
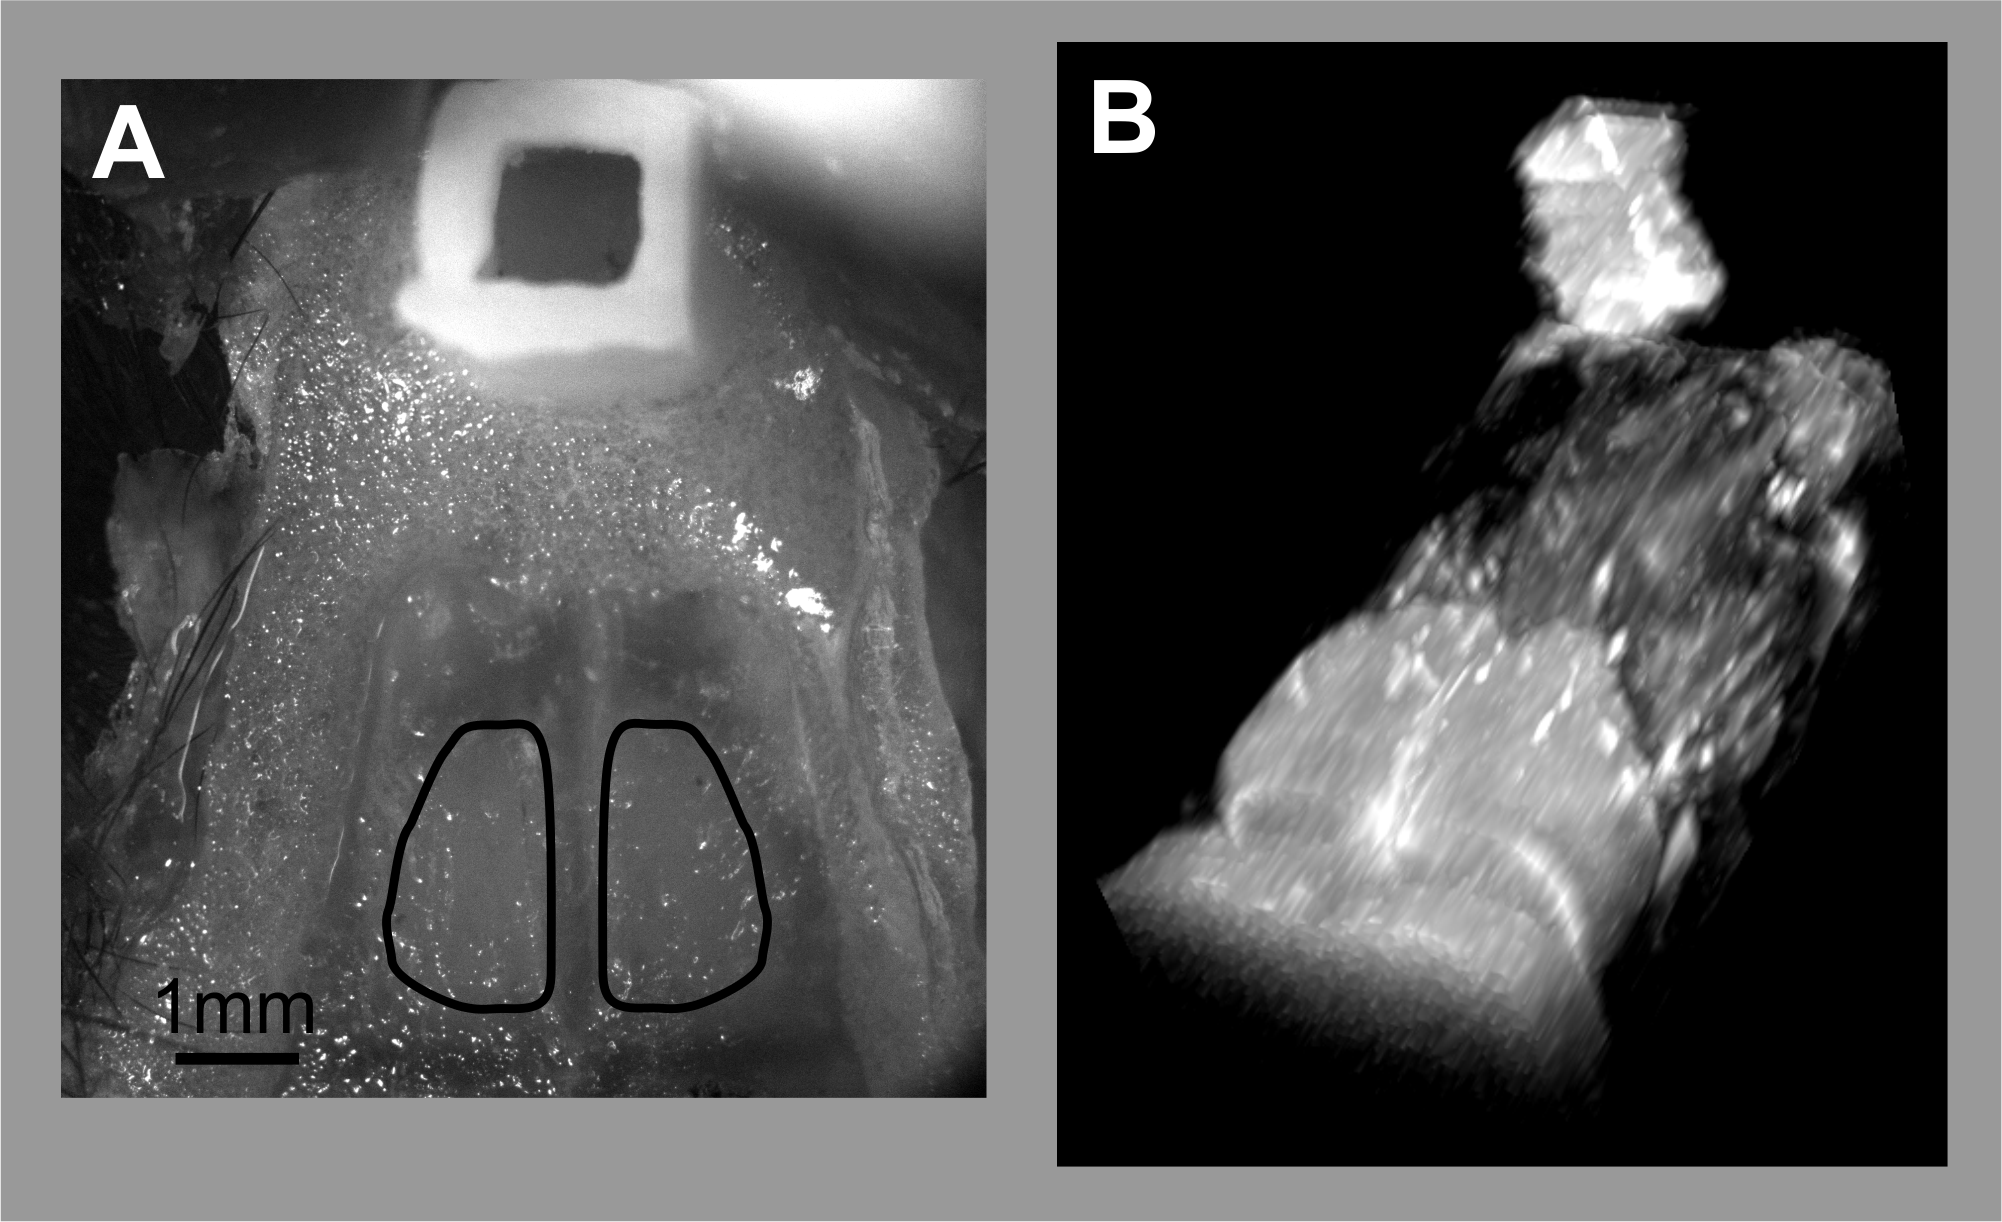
Animals: 5 mice (23-30 g) underwent surgery to place a plastic head bar for cradle fixation and to place a reference for co-registration, following a surgical protocol similar to that described in (1, 2). The skull was exposed but kept intact. A 3D-printed, plastic reservoir of ~1x1x2 mm (LxWxH) size was cemented on the bone over the nasal cavity of the mice (Fig.1A). The reservoir was filled with agar gel before imaging (Fig. 1B).MRI: One week after the surgery, the mice underwent MRI on a 17.2 T (Bruker Biospin, Germany) preclinical scanner using a 1 cm diameter circular surface coil. The acquisitions were performed under medetomidine sedation. fMRI data was collected using a GE-EPI sequence with a TR/TE= 250/10 ms, flip angle 40°, voxel size of 0.17 x 0.17 mm2 in plane, and 0.3 mm thickness, 2 adjacent slices. Anatomical images were acquired using a RARE acquisition with the following parameters: TR/TE= 2000/15 ms, voxel size 0.05 x 0.05 mm2 in plane, 0.3 mm thickness.
fUS: For fUS-PD, we used a 15 MHz probe with a nominal voxel size of 0.11 x 0.1 mm and 0.4 mm thickness. The fUS probe was solidly secured to a microscope objective (connection measured with mm precision (2)), to place the fUS probe vertically to the reservoir edge. We recorded a stack of fUS images of the reservoir and then moved the fUS probe with a motor assisted system to the OB section without changing its vertical and lateral positions with respect to the mouse head. Mice were stimulated with ethyl tiglate at 2 odor strengths: 35% - 5 s and 6% - 1s.
Image Analysis: Image analysis was performed in SPM12. BOLD to RARE co-registration was a simple overlap as the two acquisitions were performed in the same experiment. fUS to RARE co-registration, instead, was accomplished manually using the reservoir as.reference Note that RARE can only detect the agar-filling, while fUS detects just the walls of the reservoir (Fig.2). BOLD activation maps (p< 0.01, no FWE was used to draw ROIs on different OB subregions).
Results
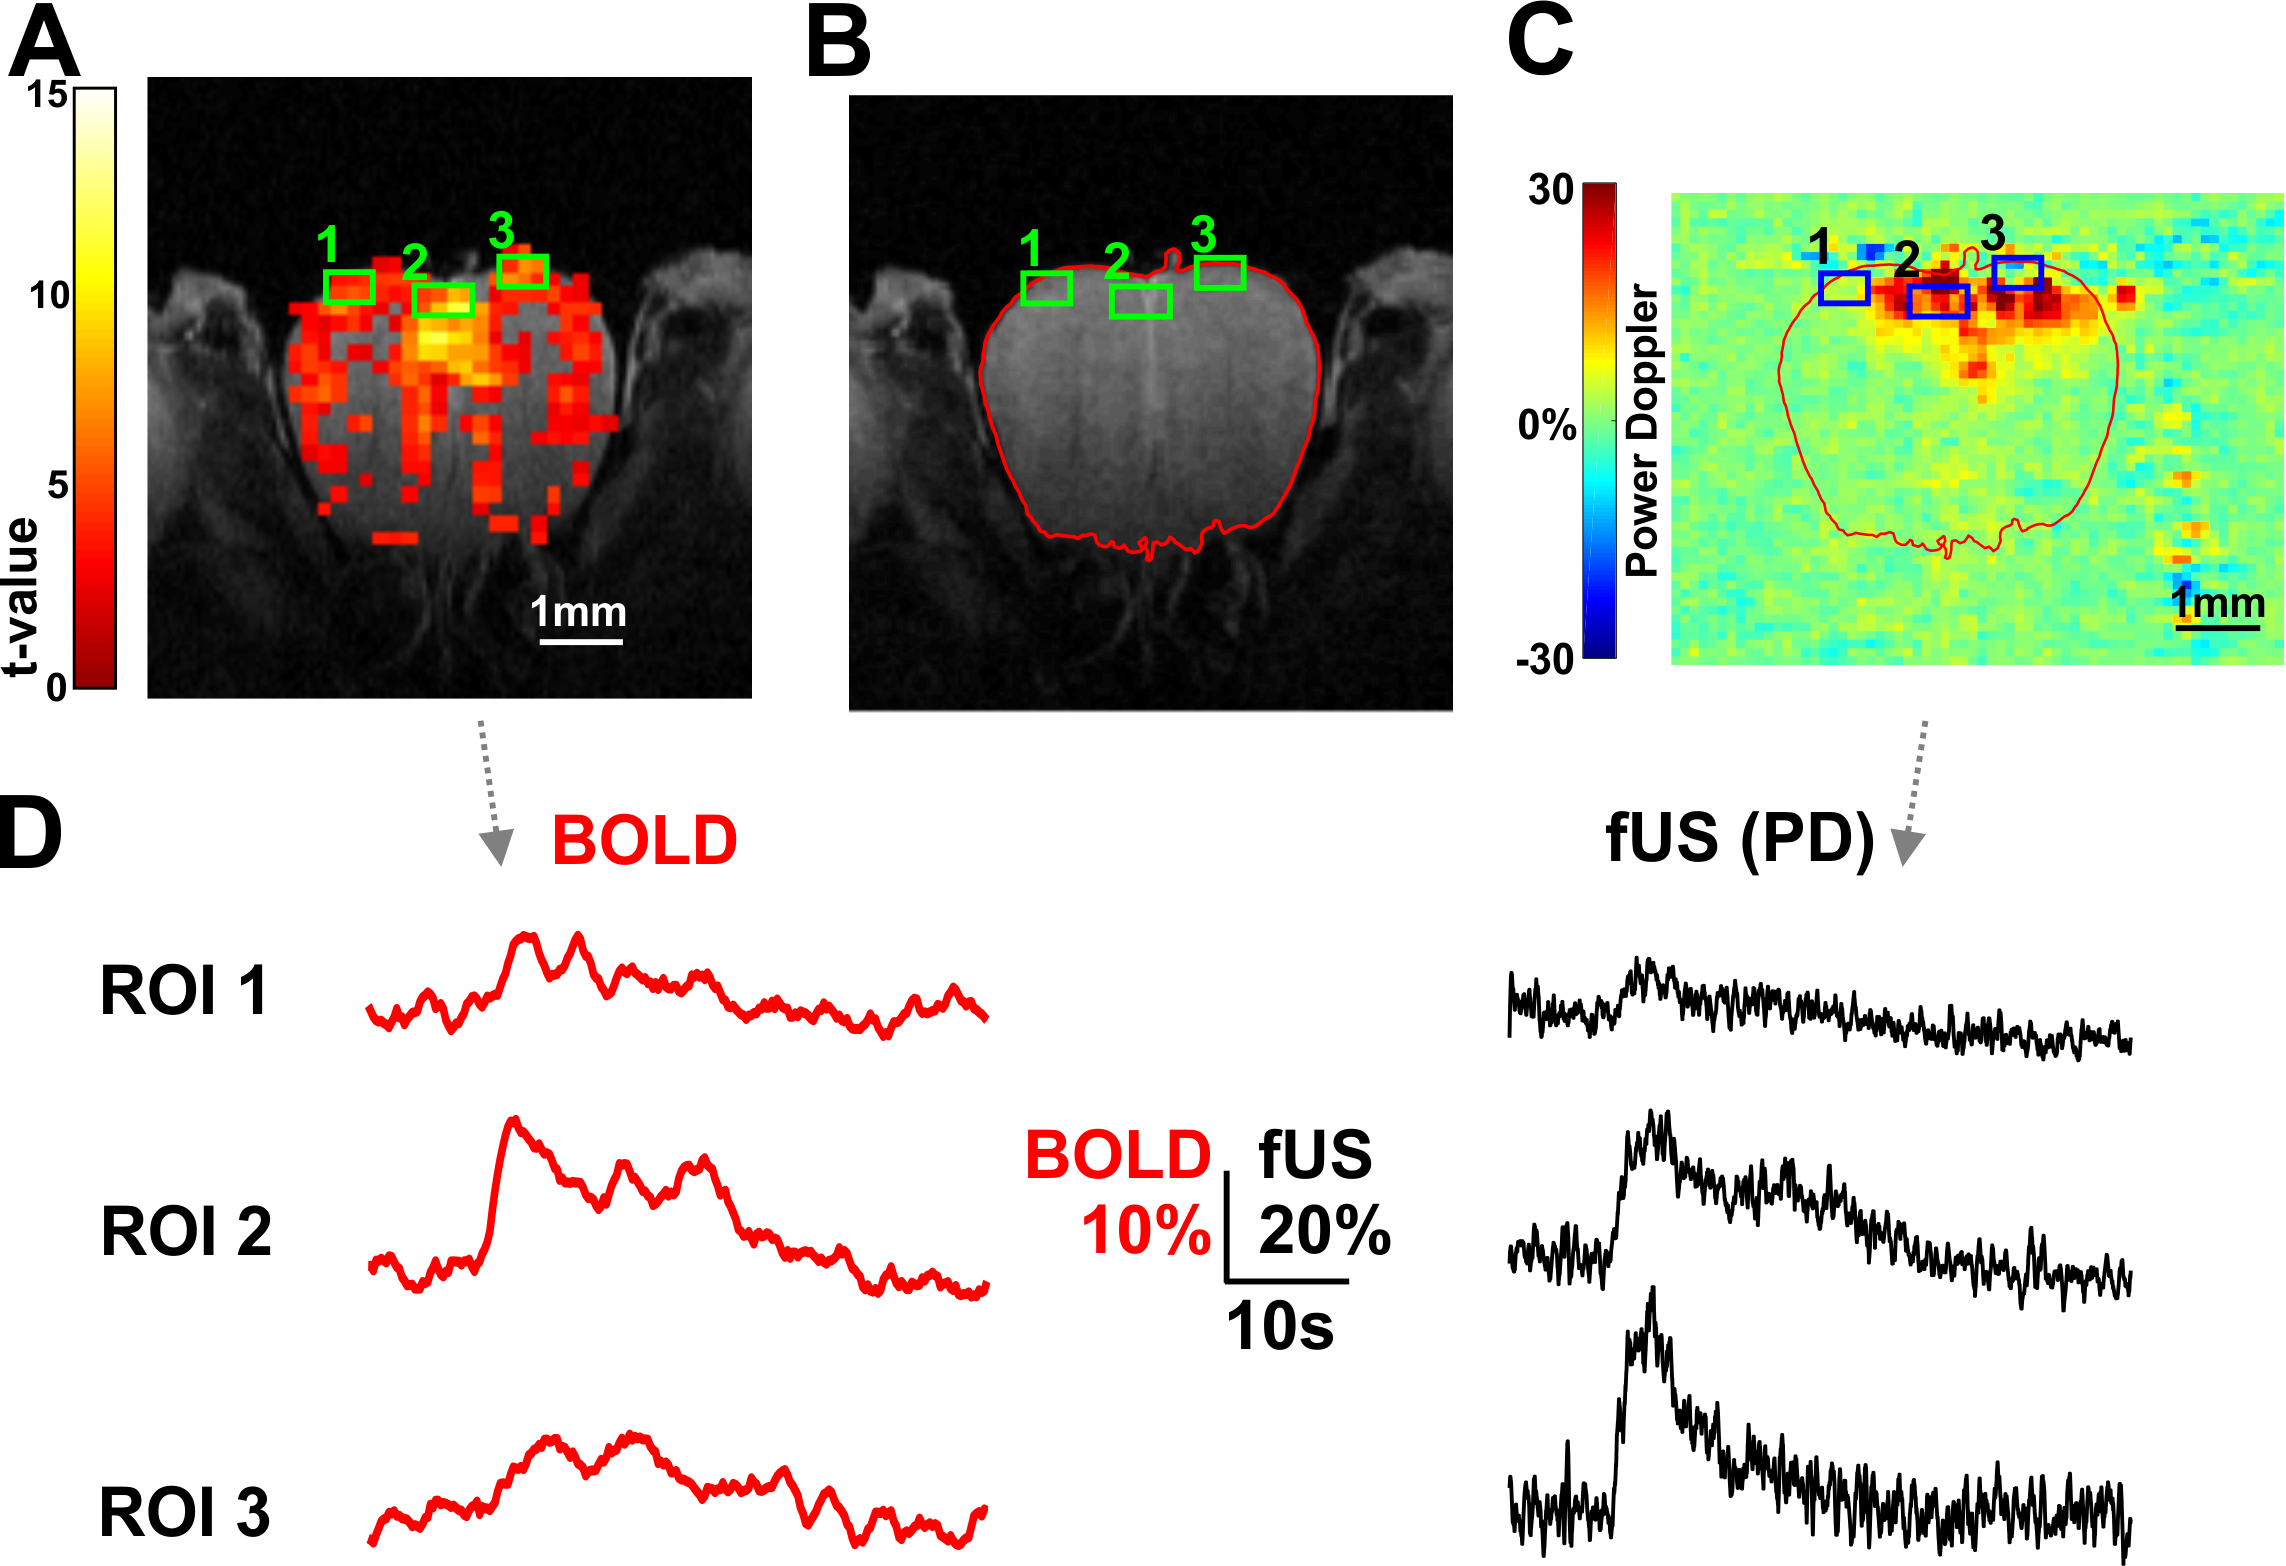
Thanks to the high spatio-temporal resolution of our BOLD recordings, we could observe the fast dynamics of BOLD signal (Fig.3). The time course response to the mild stimulation showed a single peak while the response to the strong stimulation showed an identical peak, larger in amplitude, followed by a second vascular component that we and other groups already observed in the OB and in other brain regions (3, 4). ROIs located on different OB subregions (Fig.4A) were drawn on BOLD activation maps. The ROIs were then, transferred to fUS-PD recordings by means of the co-registration onto the RARE anatomical image (Fig.4B-C). Note that fUS has little tissue penetration (~ 1mm) because of the soundwave attenuation due to the multi-layer bone over the OB compared (Fig.4C). With the stronger odor stimulation, average time courses from all the voxels included in each ROIs, showed, overall, a good agreement between fUS and BOLD (Fig.4D). However, ROI-to-ROI differences have been found, as reported by the example in Fig 4. Unlike RO3, ROI1 and 2 showed good agreement between BOLD and fUS-PD on both the fast and slow peaks of activation.Conclusion and Discussion
To conclude, our results confirmed that BOLD fMRI follows the fast dynamics already measured with TPM and fUS in the OB. Moreover, the similarity in the BOLD and fUS PD dynamics, indicating a strict relationship between blood and oxygen transients, hypothesized by many neurovascular coupling models, but rarely proved experimentally, it is true across the OB and at mesoscopic level. The ROI-to-ROI differences between BOLD and PD deserve a deeper evaluation.Our work extends to BOLD fMRI the previous findings about the neurovascular coupling in the OB obtained with other techniques and fosters the use of this brain region and the high spatial-temporal resolution allowed by ultrahigh-field MRI for sensory processing studies.
Acknowledgements
No acknowledgement found.References
1. D. Boido, R. L. Rungta, B.-F. Osmanski, M. Roche, T. Tsurugizawa, D. Bihan, L. Ciobanu, S. Charpak, Mesoscopic and microscopic imaging of sensory responses in the same animal. Nature Communications. 10, 1110 (2019).
2. A.-K. Aydin, W. D. Haselden, Y. G. Houssen, C. Pouzat, R. L. Rungta, C. Demené, M. Tanter, P. J. Drew, S. Charpak, D. Boido, Transfer functions linking neural calcium to single voxel functional ultrasound signal. Nat Commun. 11, 2954 (2020).
3. B. Chen, M. Kozberg, Bouchard, M. Shaik, E. Hillman, A Critical Role for the Vascular Endothelium in Functional Neurovascular Coupling in the Brain. Journal of the American Heart Association. 3, e000787–e000787 (2014).
4. K. Schulz, E. Sydekum, R. Krueppel, C. J. Engelbrecht, F. Schlegel, A. Schröter, M. Rudin, F. Helmchen, Nature Methods, in press, doi:10.1038/nmeth.2013.
Figures