0510
Linescan BOLD and diffusion fMRI signal responses triggered by activation of the rat visual system differ in time, amplitude and shape1NeuroSpin, Gif-sur-Yvette, France, 2Shionogi & Co., Ltd., Osaka, Japan
Synopsis
BOLD and diffusion fMRI signal response time courses following rat visual stimulation differ in time, amplitude and shape.
Introduction
Blood oxygenation level-dependent (BOLD) fMRI is widely used to investigate brain activity. However, BOLD fMRI, relying on the neurovascular coupling, is only “remotely” related to neuronal activation, spatially and temporally, and may fail in some conditions which impair neurovascular coupling. In contrast, diffusion fMRI1 has been shown to be more directly linked to neuronal activation exhibiting neuronal responses even when neurovascular coupling is abolished2-3, although its putative mechanism (neuromechanical coupling and cell swelling) remains disputed. To better compare BOLD and DfMRI temporal patterns we implemented a linescan approach which allows high temporal resolution acquisitions.Methods - Protocol
11 male Sprague Dawley rats (250-350 g) were scanned under medetomidine anesthesia (s.c.) and control of body temperature and physiological parameters. Two visual stimulation protocols (blue led light flashing in front of the right eye) were implemented: a block paradigm design (BP) with a 15s stimulation window (n=6) and an event-related design (ER) with a 3s stimulation (n=5) (Fig.1). All animal procedures used were approved by an institutional Ethic Committee and were conducted in strict accordance with the recommendations and guidelines of the European Union.Methods - fMRI
All fMRI acquisitions were conducted using a 17.2T scanner (Bruker, Germany) equipped with a pair of surface/volume coils (Rapid Biomedical, Germany). RARE (TR/TE = 2000/14 ms, in plane resolution = 90 x 90 µm2, slice thickness = 1mm, 5 slices) and GE BOLD fMRI images (TR/TE = 1000/10 ms, in plane resolution= 240 x 240 mm2, slice thickness = 1mm, 5 slices) were first acquired to identify activation loci, and especially the left superior colliculus. Linescan diffusion-weighted spin echo images were subsequently acquired along a vertical line set across the superior colliculus (Fig.2) with the following parameters: flip angles = 110°/180° (empirically optimized), TR/TE = 250/15 ms, slice/line thickness=1.2/1 mm, in line resolution 100 µm, b = 0, 1000 and 1800 s/mm². Runs of 1440 signals were acquired, resulting of 8 blocks of 180 time points for BP and 40 blocks of 36 time points for ER. 4-5 runs were acquired for each b value to increase SNR.Methods - Processing and Analysis
After Fourier transform signal profiles were displayed for each time point, resulting in 2D or 3D “space-time” color maps (Fig.2). The analysis was performed for each subject on an individual run basis and after run averaging at each b value using a homemade software (Matlab; MathWorks, Natick, MA). To avoid any bias with prior response function models4, regions of interest centered on the activation spots were drawn of the 2D space-time maps. The degree of activation was estimated for those ROIs and tested for significance using the General Linear Model after denoising5, detrending and correction for time autocorrelation. The peak amplitude and time to peak within the activation spots were also estimated for each b value, for each subject and after averaging of the time courses across subjects. Group statistical analysis was performed using a Wilcoxon-ranked-sum test using p=0.05 as significance threshold.Results
An example of 3D and 2D space-time activation map for BP is shown on Fig.2 (average of 4 runs for b=0 and b=1800s/mm², respectively) with the corresponding ROI activation time course shown on Fig.2. The amplitude of the response is larger for b=1800s/mm² and bimodal with a first peak ahead of the b=0 response peak by 0.5s and a shoulder at the end of the stimulation (the location of this shoulder has been found close to that corresponding to the main activation spot, but not always exactly colocalized). This triple pattern (earlier response for b=1800s/mm², peak amplitude and shoulder increasing with b value) wa consistent and significant at group level (Fig.3) both for BP and ER. For ER the mean peak amplitude reached 0.64% and 1.73% for b=0 and 1800s/mm², respectively (p=0.016) and the mean time-to-peak 2.65s and 2.15s for b=0 and 1800s/mm², respectively (p=0.032).Discussion
The mechanisms underlying the diffusion fMRI response have been debated6,7. Here, the difference in the response patterns confirm that BOLD and diffusion fMRI rely on different mechanisms. The increase of the diffusion fMRI response with b value, as reported earlier1, also points to a genuine diffusion mechanism, ie a change in tissue microstructure occurring upon activation1,2,3,8, possibly cell swelling. However, the shape of the diffusion response remains intriguing. A very similar response pattern has also been observed in the sensory cortex following forepaw stimulation9 (Fig.2 in reference 9). While the first peak likely corresponds to the neuronal activity1,2,3,,8,9 one might speculate that the second could be linked to astrocyte activity. Schummers et al.10 have reported stimulus locked astrocyte response in the visual cortex of ferrets occurring right at the end of the stimulus (Fig.4B in reference 10) and diffusion MRI has been shown to be sensitive to volume changes associated to astrocyte activity status11.Conclusion
High temporal resolution diffusion fMRI using linescan shows that the signal response time course following visual stimulation in rat visual system significantly differs from the BOLD response, in time, amplitude and shape, suggesting different mechanisms for the two approaches (neurovascular coupling for BOLD and neuromechanical coupling for DfMRI).Acknowledgements
No acknowledgement found.References
1.Le Bihan, D., Urayama, S., Aso, T., et al. Direct and fast detection of neuronal activation in the human brain with diffusion MRI. Proc Natl Acad Sci U S A. 2006; 103: 8263-8268.
2.Abe, Y., Tsurugizawa, T., Le Bihan, D.. Water diffusion closely reveals neural activity status in rat brain loci affected by anesthesia. PLoS Biol 2017; 15: e2001494.
3.Tsurugizawa, T., Ciobanu, L., Le Bihan, D. Water diffusion in brain cortex closely tracks underlying neuronal activity. Proc Natl Acad Sci U S A 2013; 110: 11636-11641.
4.Aso, T., Urayama, S., Poupon, C., et al. An intrinsic diffusion response function for analyzing diffusion functional MRI time series. Neuroimage 2009; 47: 1487-1495.
5.Veraart, J. Fieremans, E, Novikov, D.S. Diffusion MRI noise mapping using random matrix theory. Magn. Res. Med. 2016; 76: 1582-1593.
6.Miller, K.L., Bulte, D.P., Devlin, et al. Evidence for a vascular contribution to diffusion FMRI at high b value. Proc Natl Acad Sci U S A 2007; 104: 20967-20972.
7.Bai, R., Stewart, C.V., Plenz, et al. Assessing the sensitivity of diffusion MRI to detect neuronal activity directly. Proc Natl Acad Sci U S A 2016; 113: E1728-1737.
8.Nunes, D., Ianus, A., Shemesh, N. Layer-specific connectivity revealed by diffusion-weighted functional MRI in the rat thalamocortical pathway. Neuroimage 2019; 184: 646-657.
9.Nunes D, Gil, R, Shemesh N. A rapid-onset diffusion functional MRI signal reflects neuromorphological coupling dynamics. 2020; arXiv: 2001.08508.
10.Schummer J, Hongbo Y, Sur M. Tuned Responses of Astrocytes and Their Influence on Hemodynamic Signals in the Visual Cortex. Science 2008; 320: 1638-1643.
11.Debaker C, Djemai B, Ciobanu L et al. Diffusion MRI reveals in vivo and non invasively changes in astrocyte function induced by an aquaporin-4 inhibitor. PloSONE 2020; 15(5): e0220702.
Figures
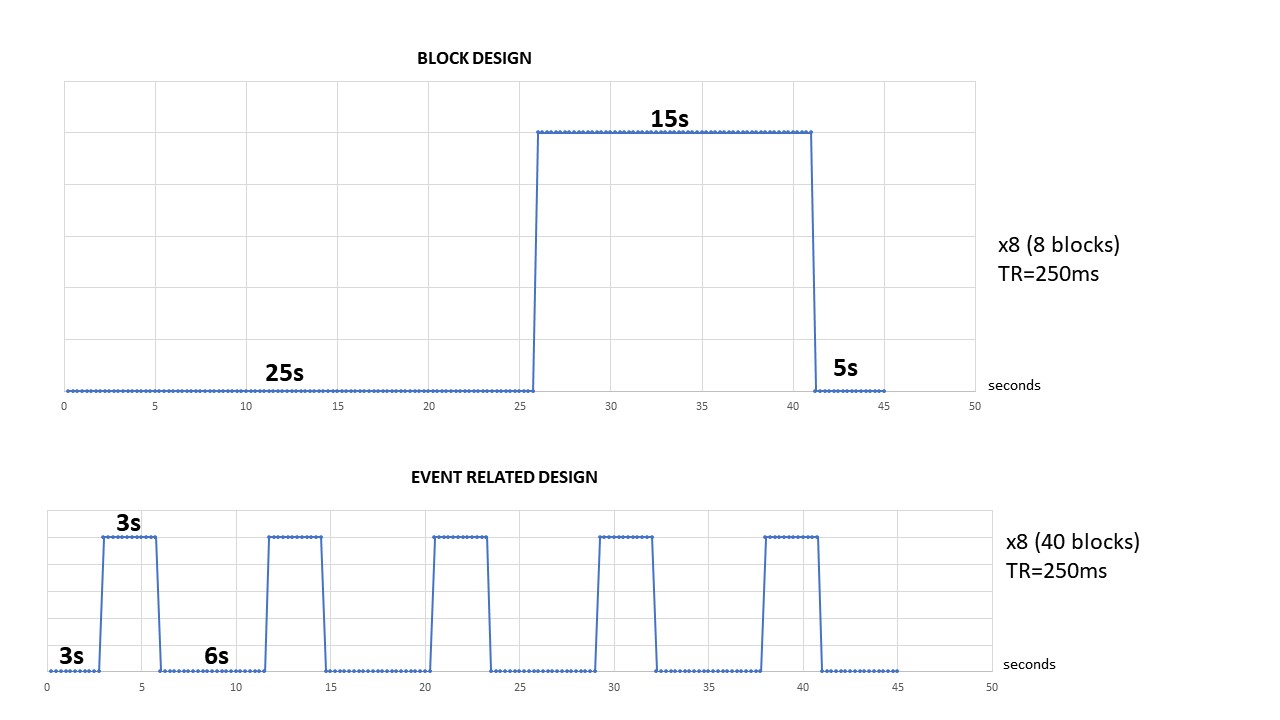
Figure 1: Experimental design
Top: Block paradigm (BP)
Bottom: Event-related design (ER)
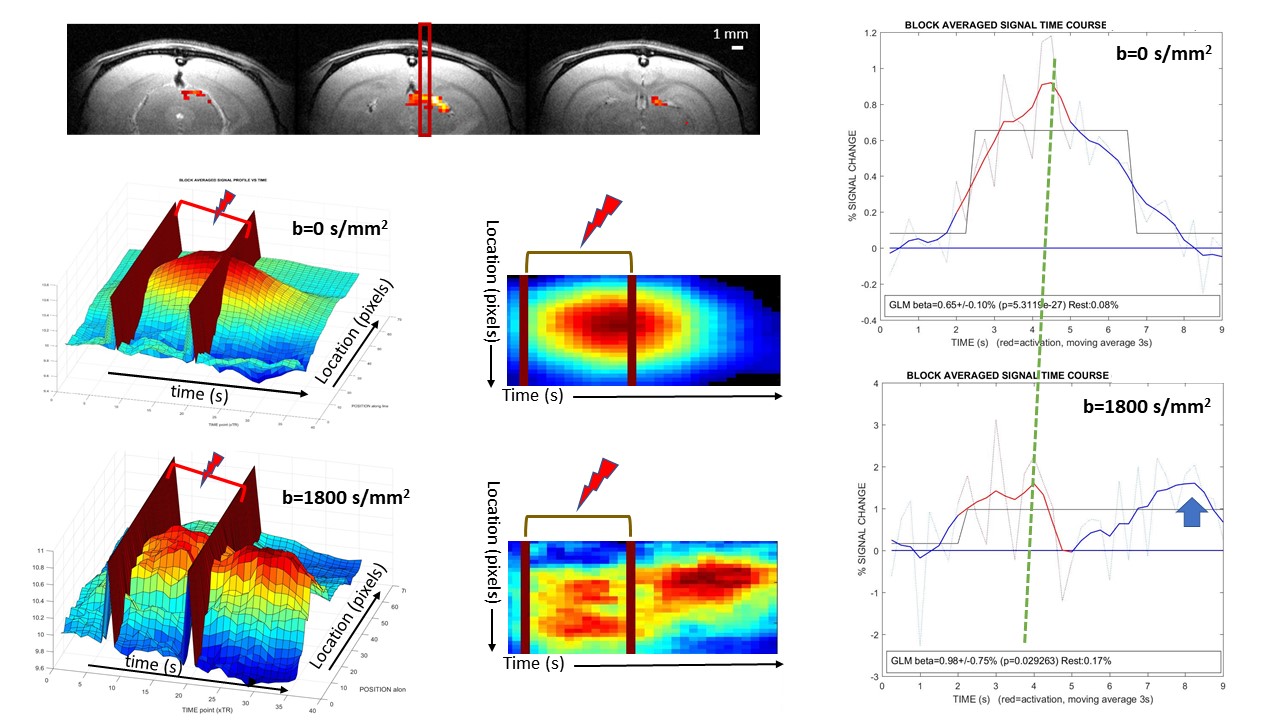
Figure 2: Example of results in a single subject
Top: BOLD fMRI showing Superior Colliculus and line position.
Middle: 2D/3D renderings of the space-time activation pattern (b=0) ([9 9] median filtering). The activation spot extends beyond the end of the stimulation.
Bottom: id with b=1800s/mm² showing 2 peaks with slightly different spatial extents, one inside the activation window and the other after the stimulation
Right: Response time courses. The response amplitude (beta) is higher for b=1800s/mm² and present 2 peaks. Both responses are statistically significant.
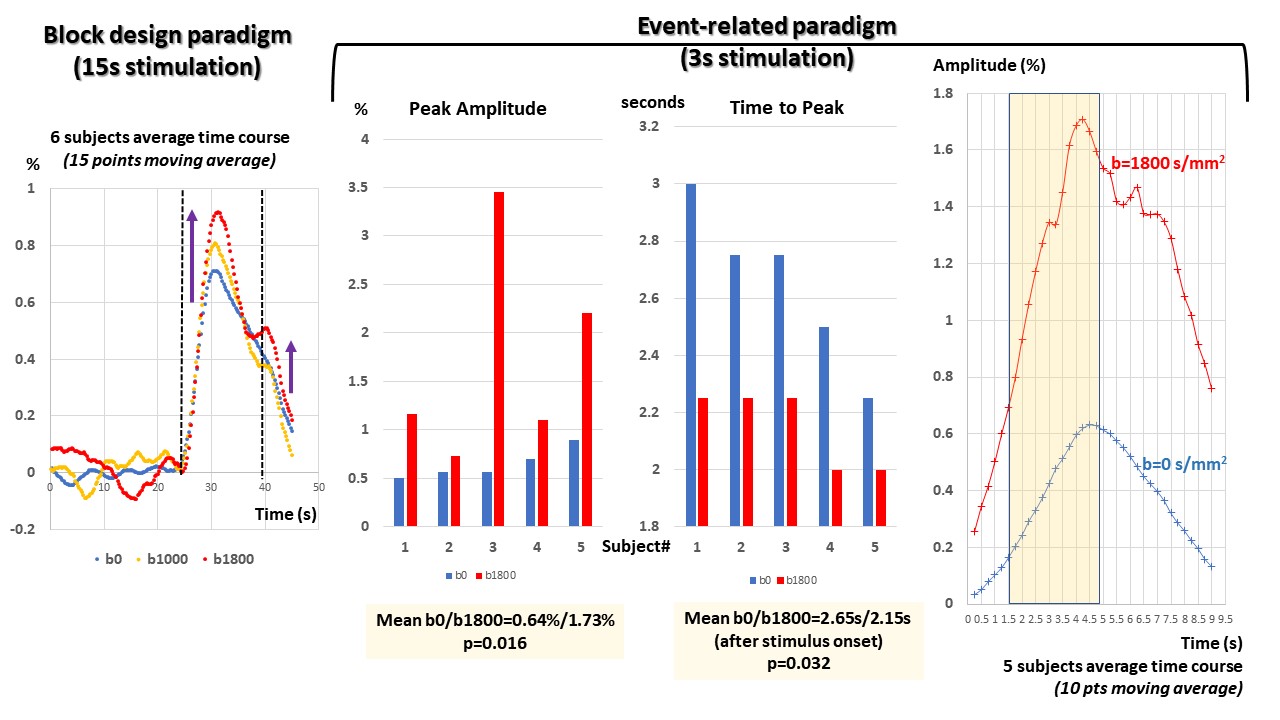
Figure 3: Group results
Left: Group average (n=6) for BP (15 points moving average). The amplitude increase with b value of the main peak and the shoulder are clearly visible.
Middle: Individual results (5 subjects) showing the differences in amplitude and in time-to-peak between b=0 and 1800s/mm² (p=0.016 and p=0.032, respectively).
Right: Group average (n=5) for ER (10 points moving average).