0505
A free-running cardiac T1* mapping sequence for quantifying dynamic changes in myocardial T1* at rest and physiological exercise1Department of Medicine (Cardiovascular Division), Beth Israel Deaconess Medical Center and Harvard Medical School, BOSTON, MA, United States, 2School of Biomedical Engineering and Imaging Sciences, London, United Kingdom, 3Siemens Medical Solutions USA, Inc, Boston, MA, United States, 4University of Alberta, Department of Biomedical Engineering, Edmonton, MA, Canada
Synopsis
In this study, we developed a free-running cardiac T1* mapping sequence (DELTA) for quantifying the dynamic changes in myocardial T1* in response to physiological exercise. DELTA adopts continuous radial acquisition, self-navigation, and adaptive acquisition window to address the challenges associated with high heart rate and deep breathing after exercise. Phantom T1* by DELTA was heart-rate insensitive and had good repeatability. In vivo T1* among multiple measurements had little variation and comparable precision with MOLLI5(3)3 T1*.In the stress/rest studies, T1* reactivity was larger during the first scan after exercise and gradually reduced along the duration of post-exercise.
Purpose
Cardiovascular magnetic resonance tissue mapping has the potential to quantify changes in the myocardial blood volume in response to physiological exercise (Ex-CMR) for assessment of myocardial ischemia(1). However, rapid heart rate and deep breathing during Ex-CMR challenge the general breath-holding T1 mapping techniques(1). This study aims to develop a free-running cardiac T1* mapping sequence to quantify the Dynamic changEs in myocardiaL T1 stAr (DELTA) in response to physiological exercise.Methods
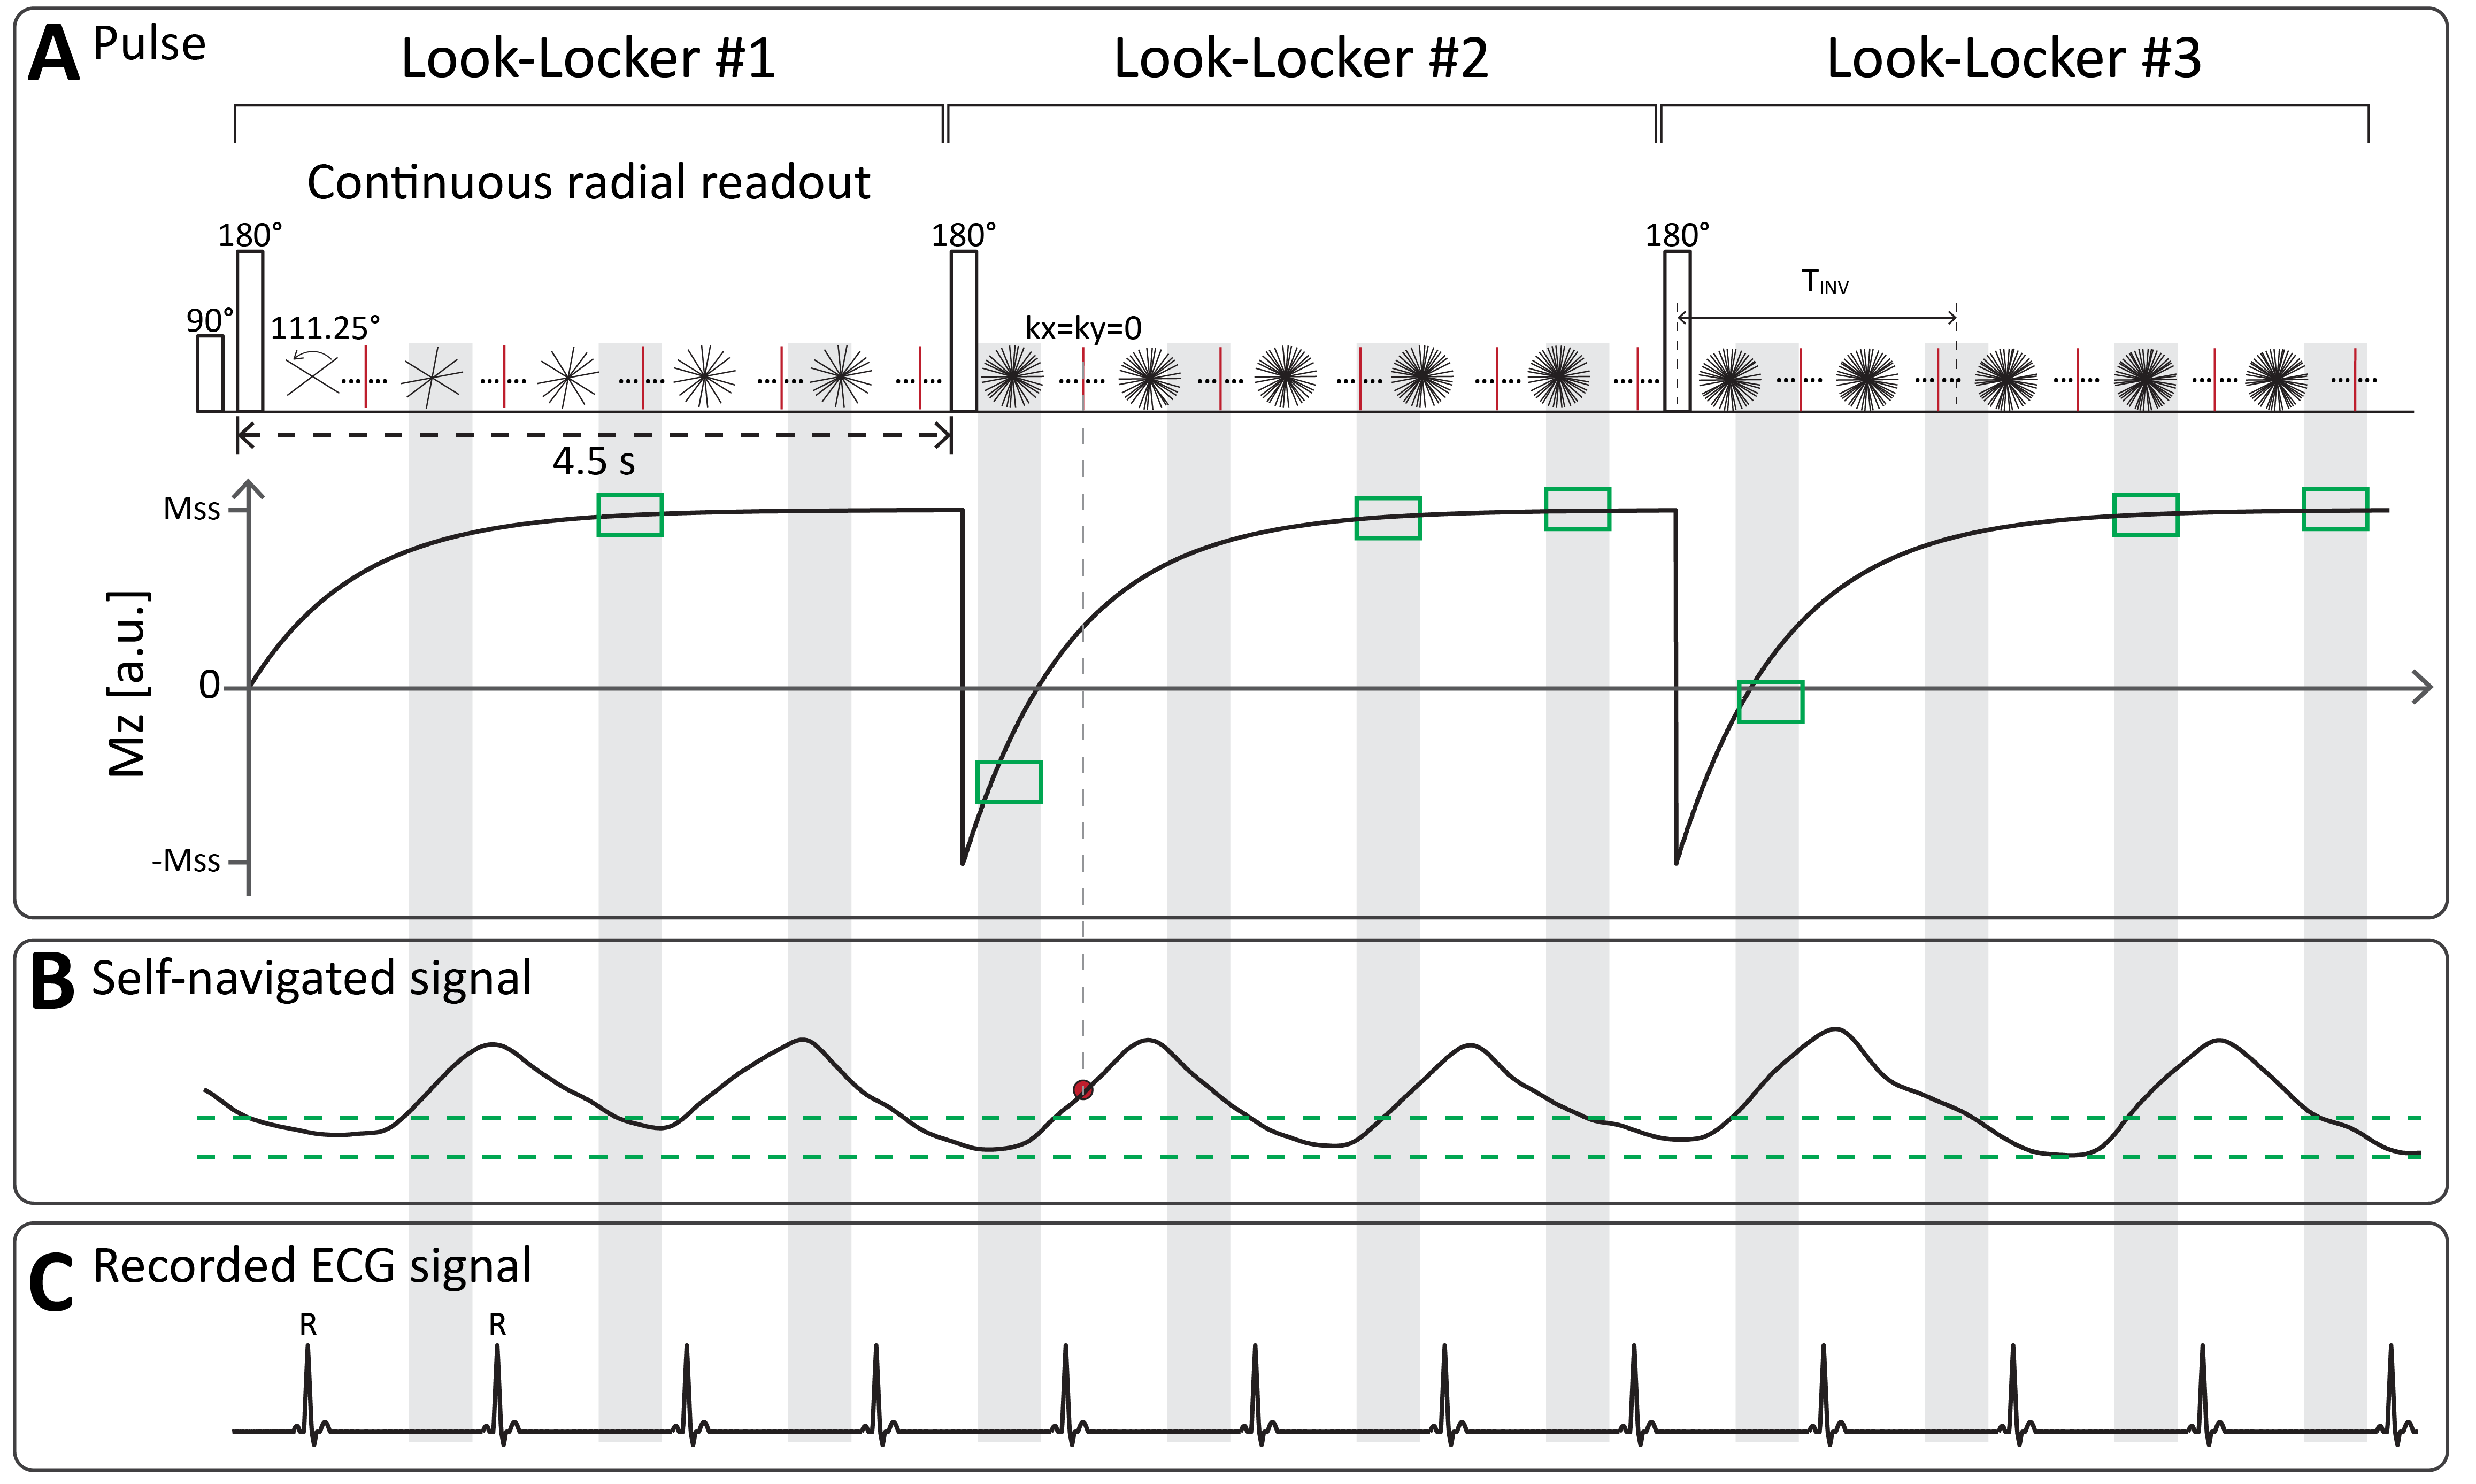
Sequence: Figure 1A shows the diagram of the proposed prototype sequence. DELTA first performs a saturation pulse to renew the whole-heart longitudinal magnetization (Mz). Then, three Look-Locker inversion-recovery experiments are performed. Each Look-Locker experiment continuously acquires golden-angle radial data using low flip angle spoiled gradient-echo. Radial lines acquired in each Look-Locker experiment is fixed to drive the Mz to the steady state (Mss). The evolution of Mz could be formulated as $$$M_{z}(t)=M_{ss}\left \{1 - \left [2-exp\left ( \frac{-T_{SAT}}{T_1^*} \right ) \right ]exp\left ( \frac{-t}{T_1^*} \right ) \right \}$$$, where TSAT is the delay after saturation. During the free-running imaging, self-navigation is acquired every 30 readout in the kz direction. ECG signal synchronous with acquisition is recorded to retrospectively extract cardiac motion. Finally, radial lines collected at mid-diastolic and end-expiration phases (Figures 1B and 1C) are selected for the reconstruction of T1 weighted images using a low rank plus sparsity constraint method(2).Phantom experiments: Nine phantom vials(3) were scanned by inversion-recovery spin-echo for reference values and DELTA on a 3T scanner (MAGNETOM Vida, Siemens Healthcare, Germany) with body and spine phased-array coils. DELTA performed T1* mapping at three slices with a slice-gap of 16 mm (4). For each slice, DELTA performed 10 times for ten T1* measurements with the following parameters: FOV=200×200mm2, resolution=1.8×1.8mm2, thickness=8mm, points per radial spoke=224, TR/TE/flip angle=2.9ms/1.03ms/4º. The radial line is rotated with an angle of 111.25º. Every Look-Locker acquires 1500 spokes. Different measurements of three slices were performed in an interleaved fashion. In vivo experiments: We first investigated the performance of DELTA on nine healthy subjects (4 males, age 25±3 years), which was HIPAA compliant and approved by our Institutional Review Board. Written informed consent was obtained from each subject prior to CMR imaging. MOLLI5(3)3 and DELTA performed T1* maps at the base, middle, and apex for three left-ventricle (LV) slices. For each slice, DELTA was performed ten times for ten T1* measurements. Measurements of three slices were scanned in an interleaved fashion. Imaging parameters of DELTA were the same as those used in phantom studies. MOLLI5(3)3 was performed with the following parameters: bSSFP, FOV=320×320mm2, resolution=1.8×1.8mm2, thickness=8mm, TR/TE/flip angle=3.9 ms/1.95 ms/35°, partial Fourier factor =7/8, Acceleration factor=2(4,5). We recruited another five healthy volunteers (2 males, 25±5 years) for Ex-CMR study. Two rest scans were performed before exercise for baseline. Each subject participated in two Ex-CMR studies (1st and 2nd) using an MR-compatible bicycle ergometer. The interval between two Ex-CMR was 10 minutes. After the 1st exercise, DELTA performed four scans. The interval between the two scans was <1 minute. One scan was performed after the 2nd exercise. In each scan, DELTA only imaged one mid-ventricular slice with ten repetitions.
Data analysis: The mean and standard deviation (SD) of T1* for each phantom vial, LV, and septal myocardium were calculated by manually delineating the region of interest. SD was used to assess the T1* precision. T1* reactivity is calculated as:$$${T_{1}^*}_{reactivity}\%=\frac{{T_1^*}_{post-stress}-{T_1^*}_{rest}}{{T_1^*}_{rest}}\times100$$$, where T1*post-stress represents T1* measured after stress and T1*rest is the mean value of two rest scans.
Results
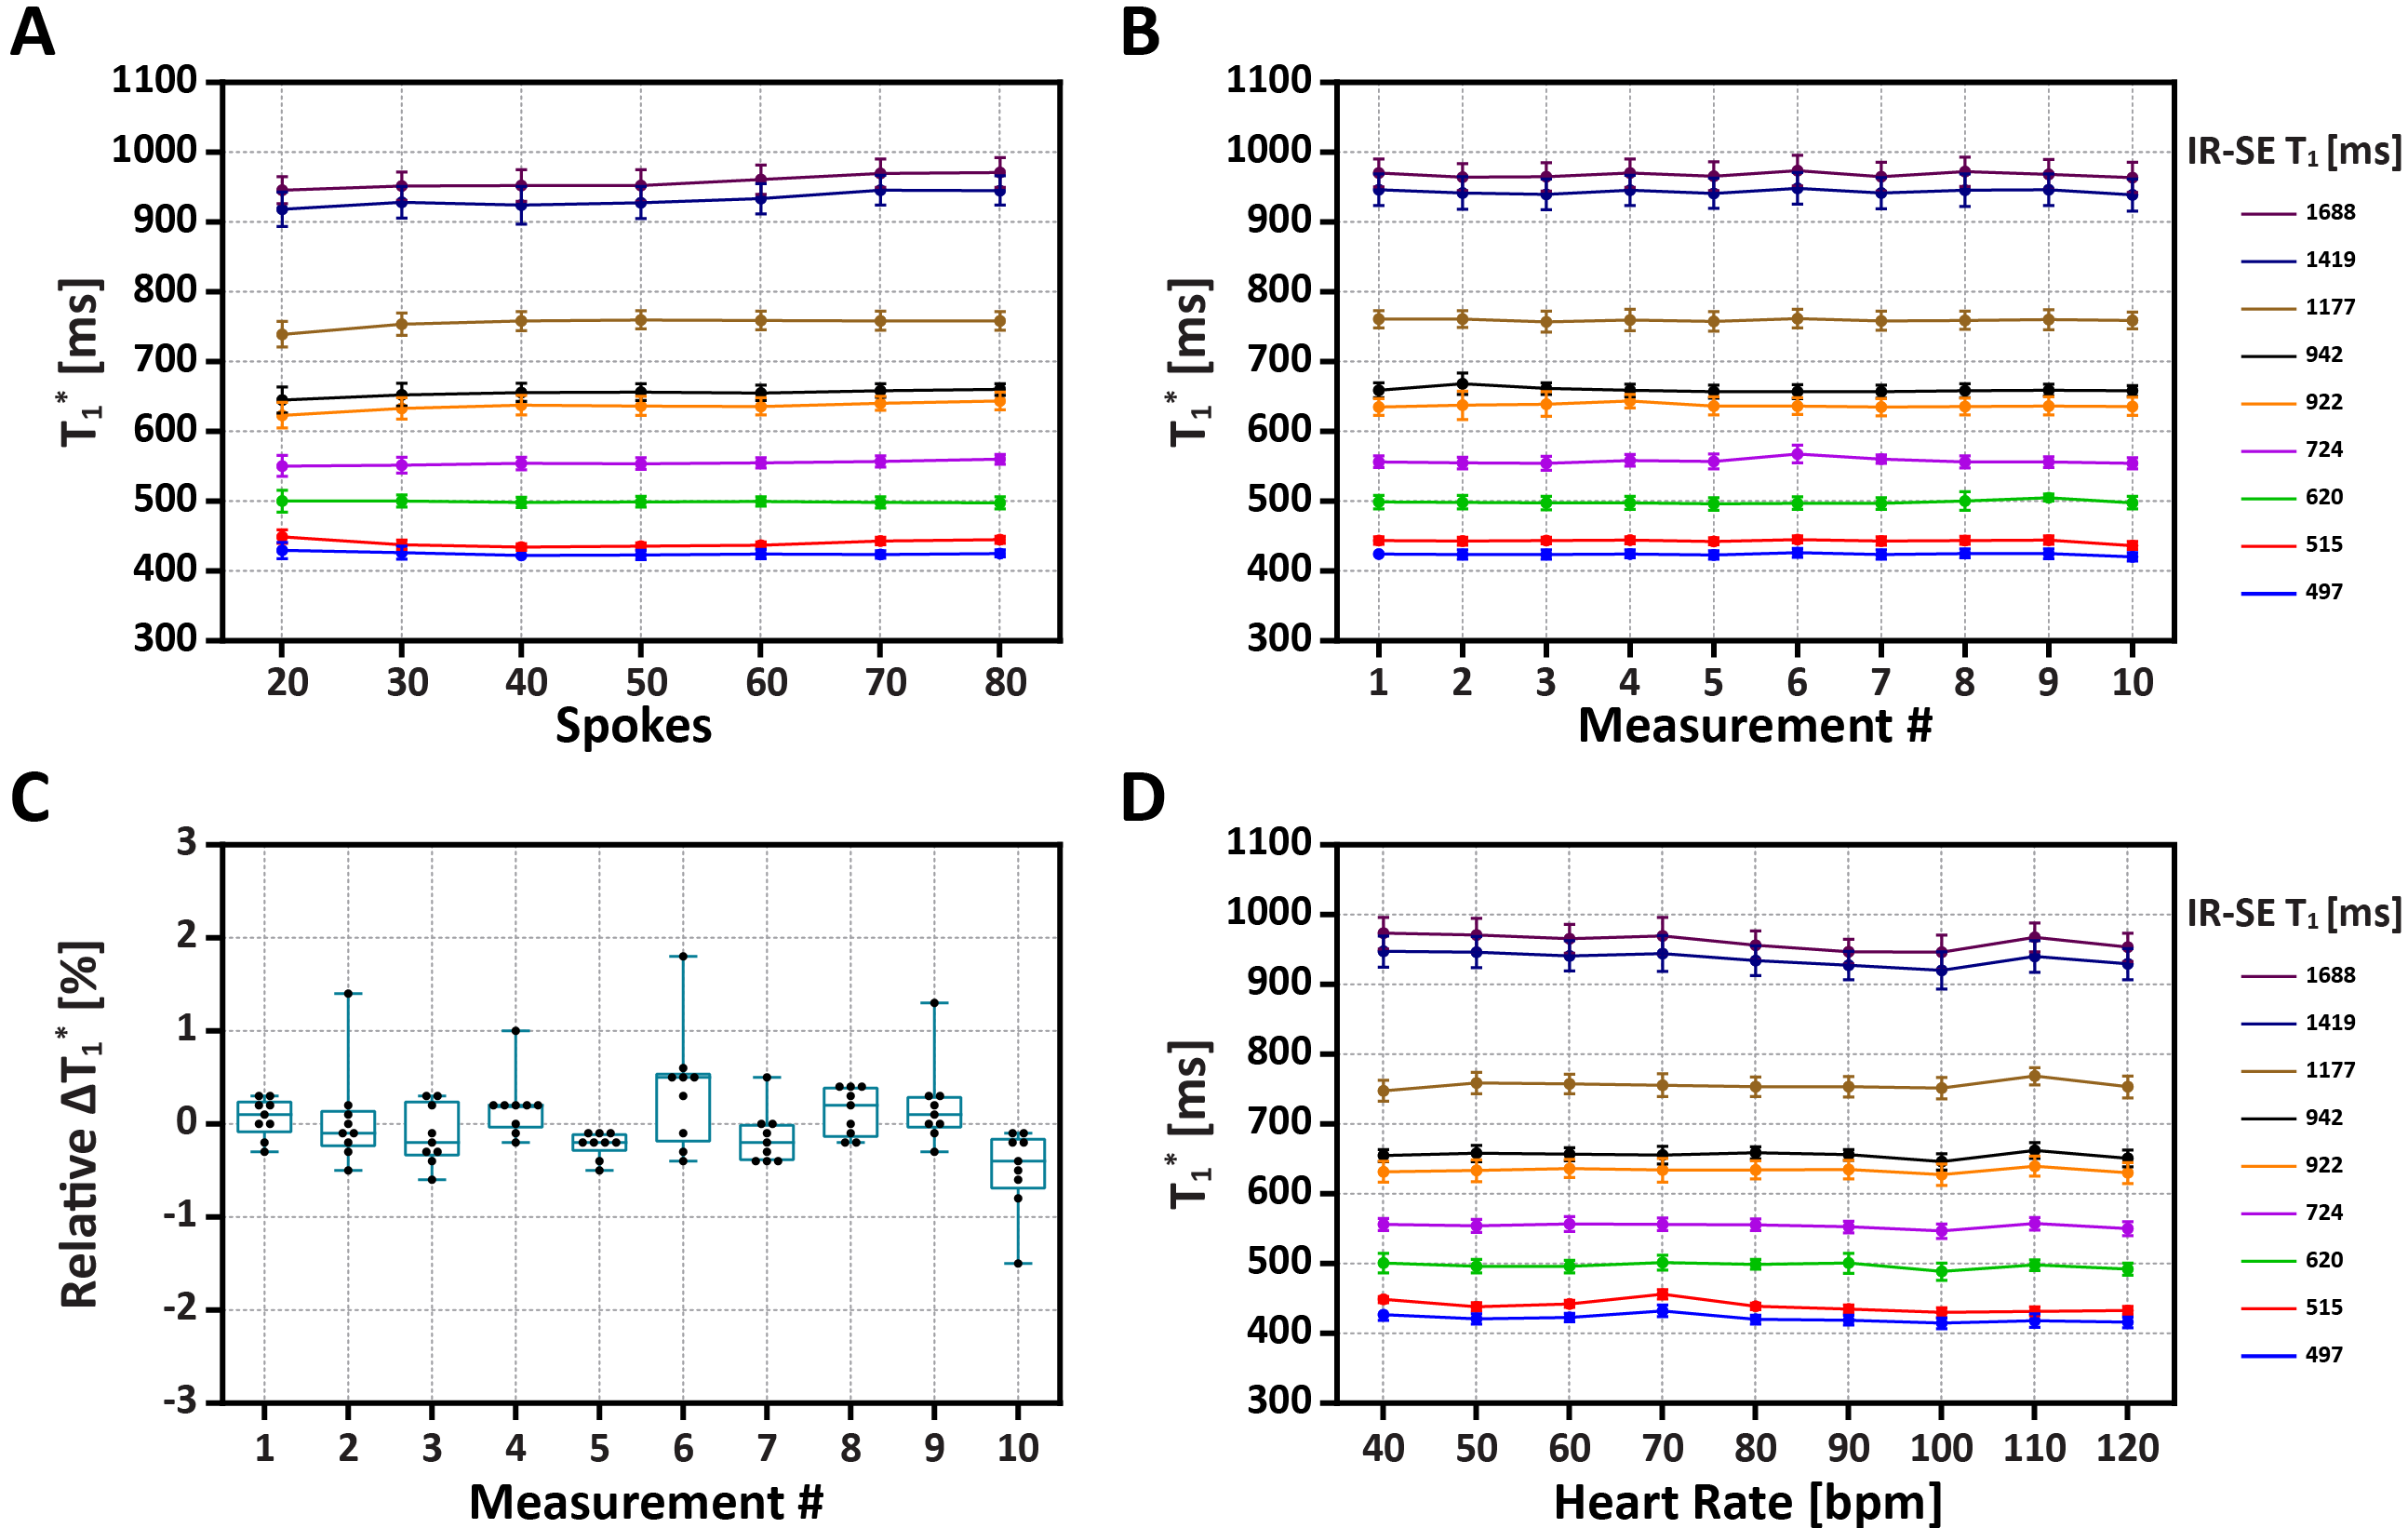
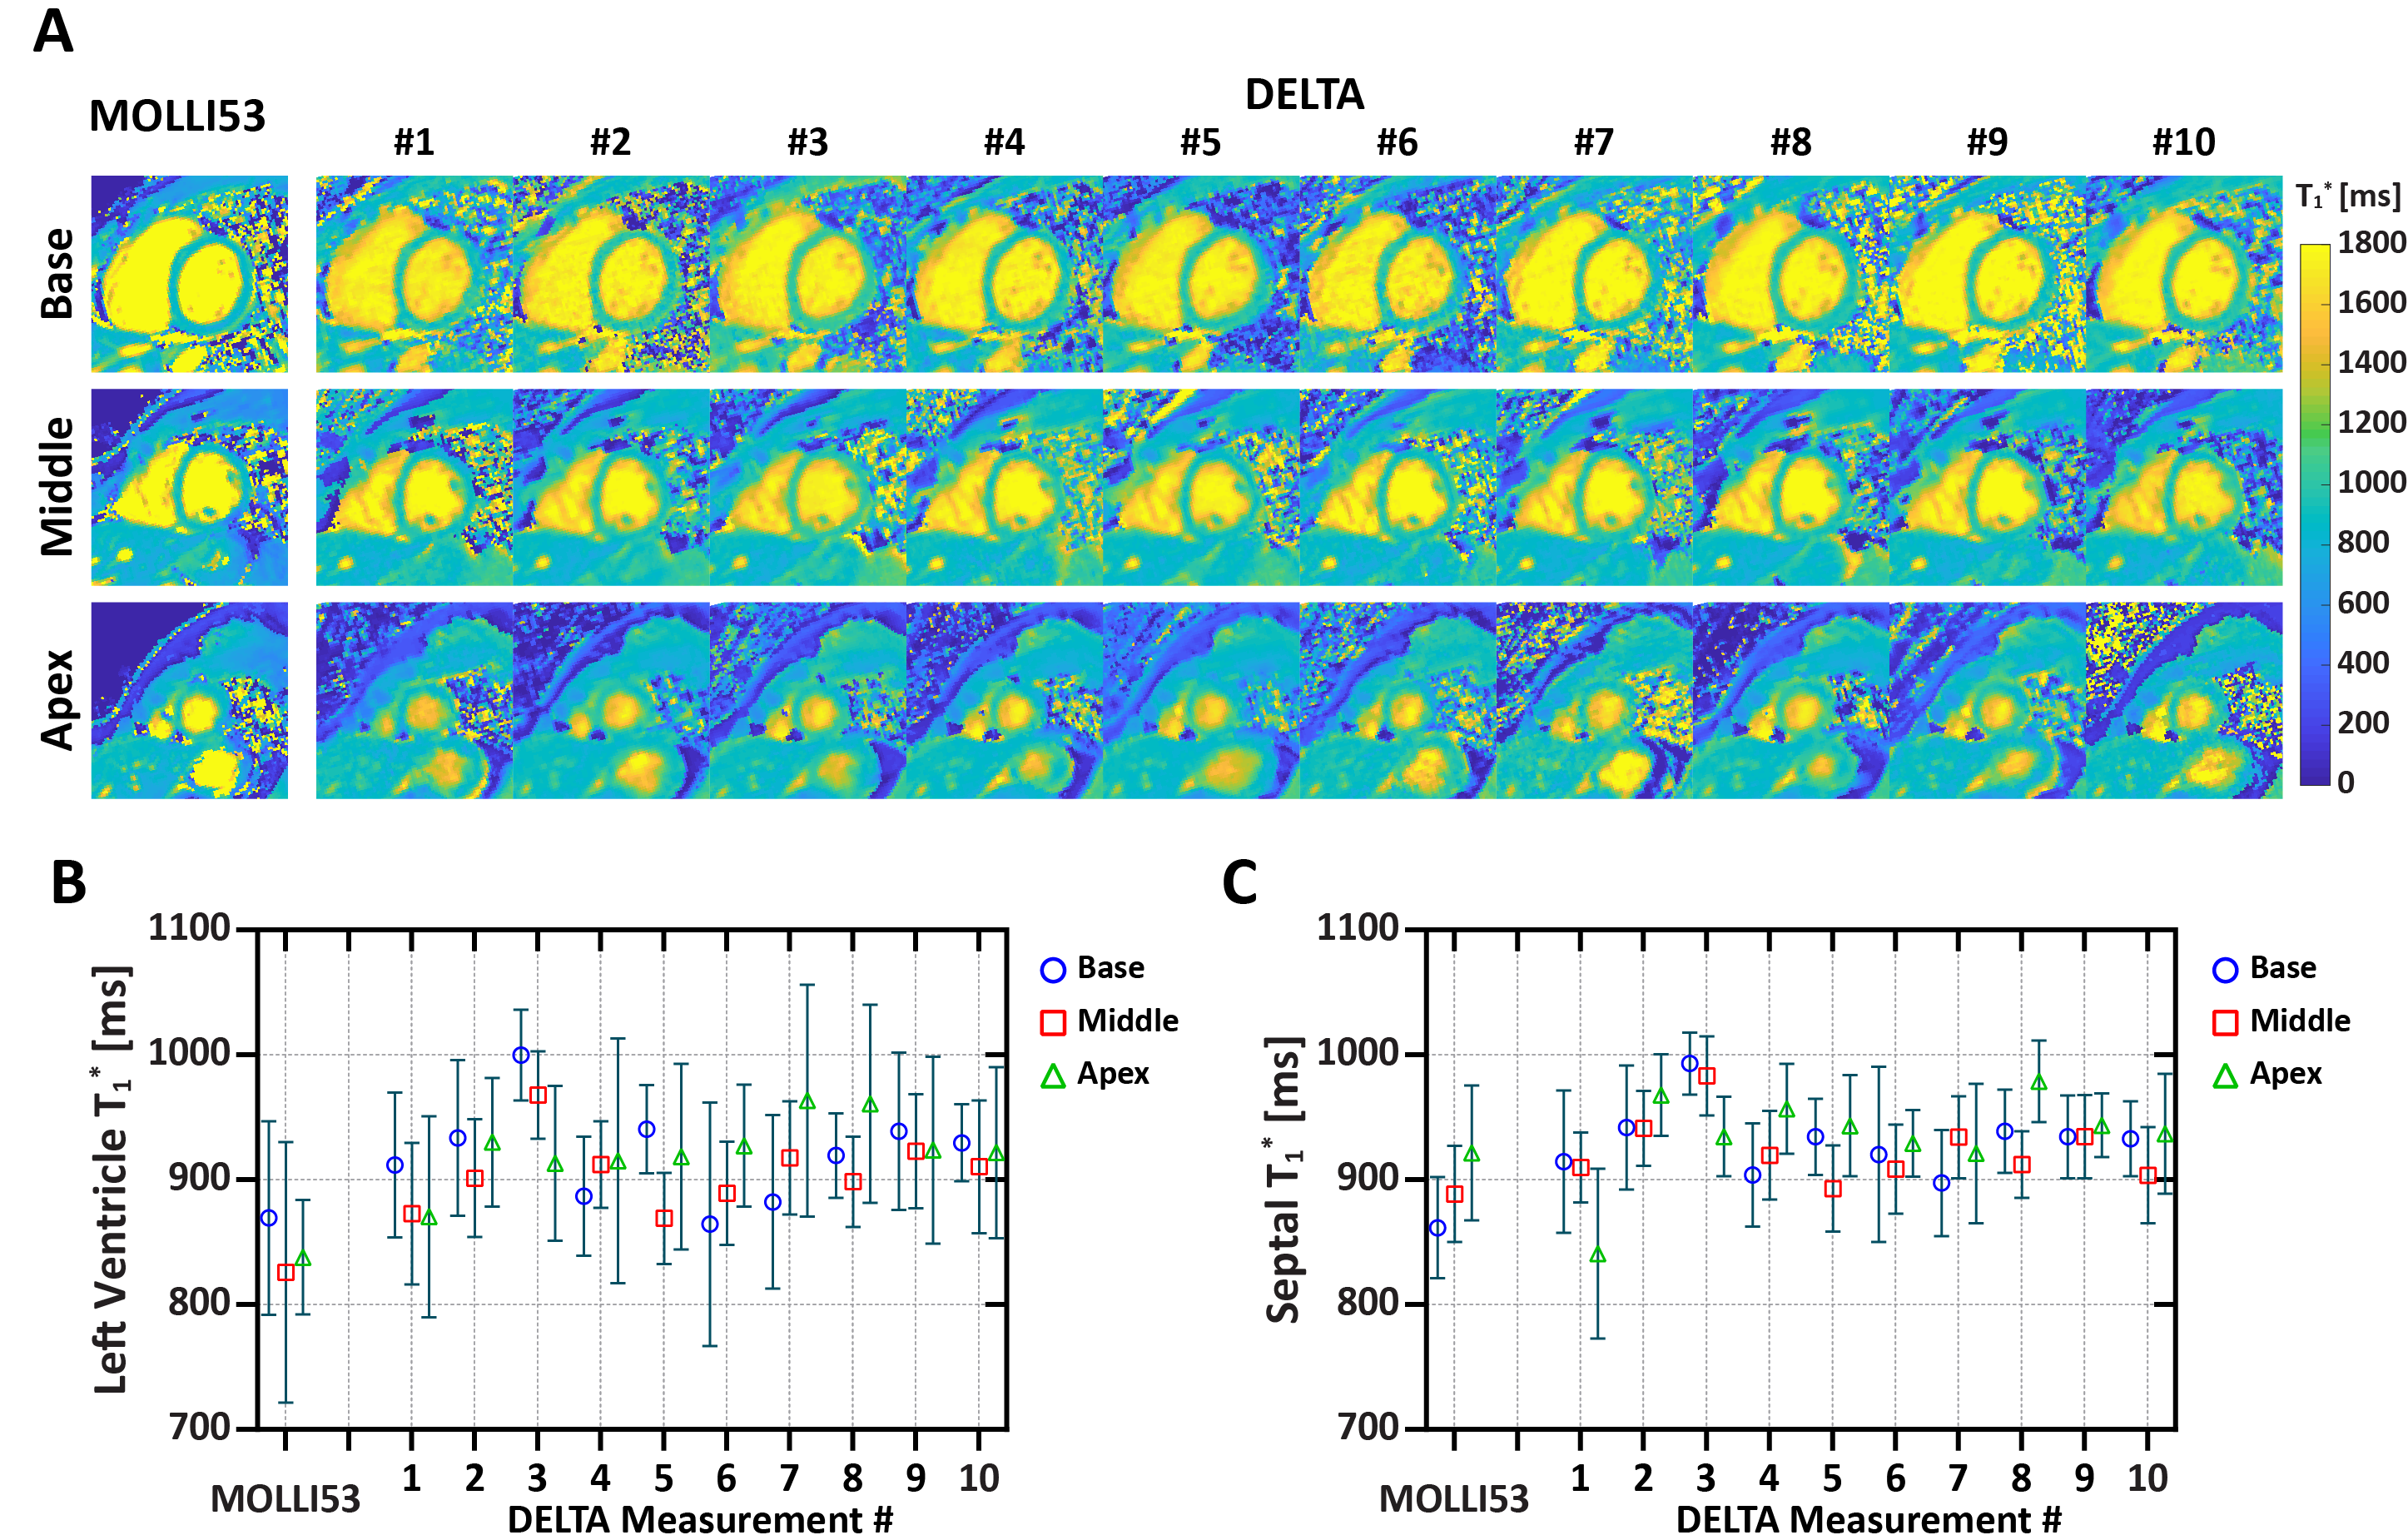
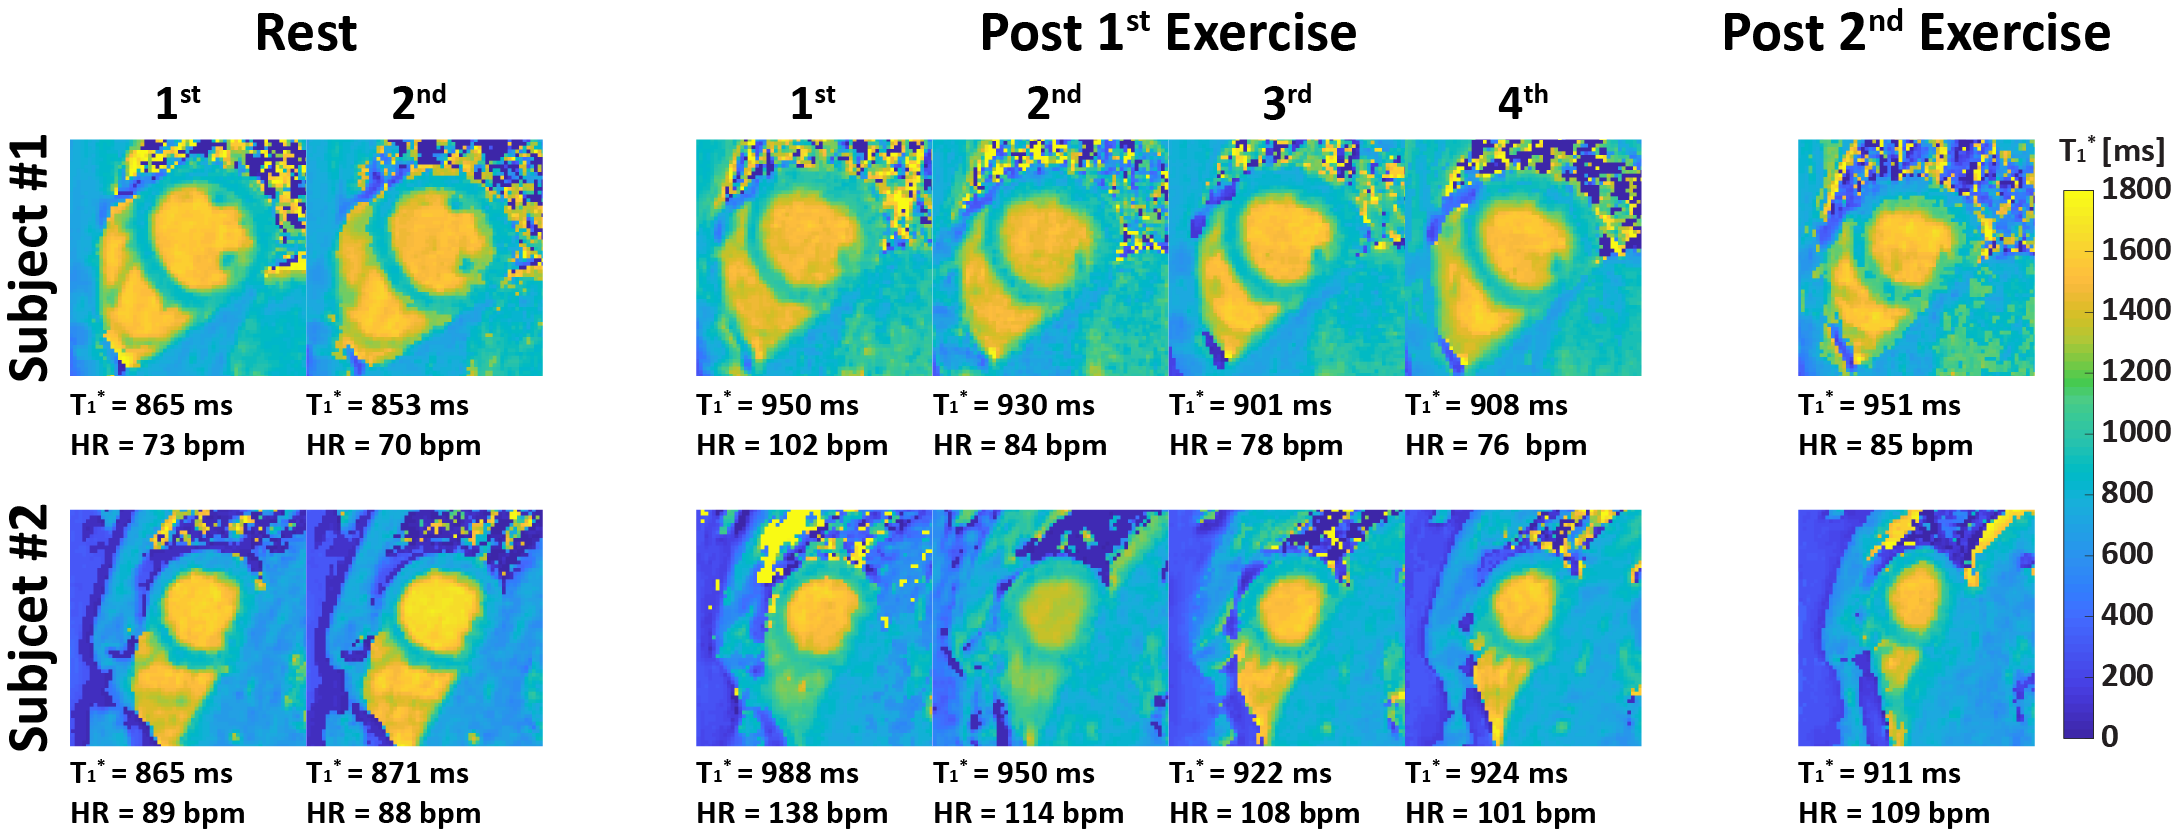
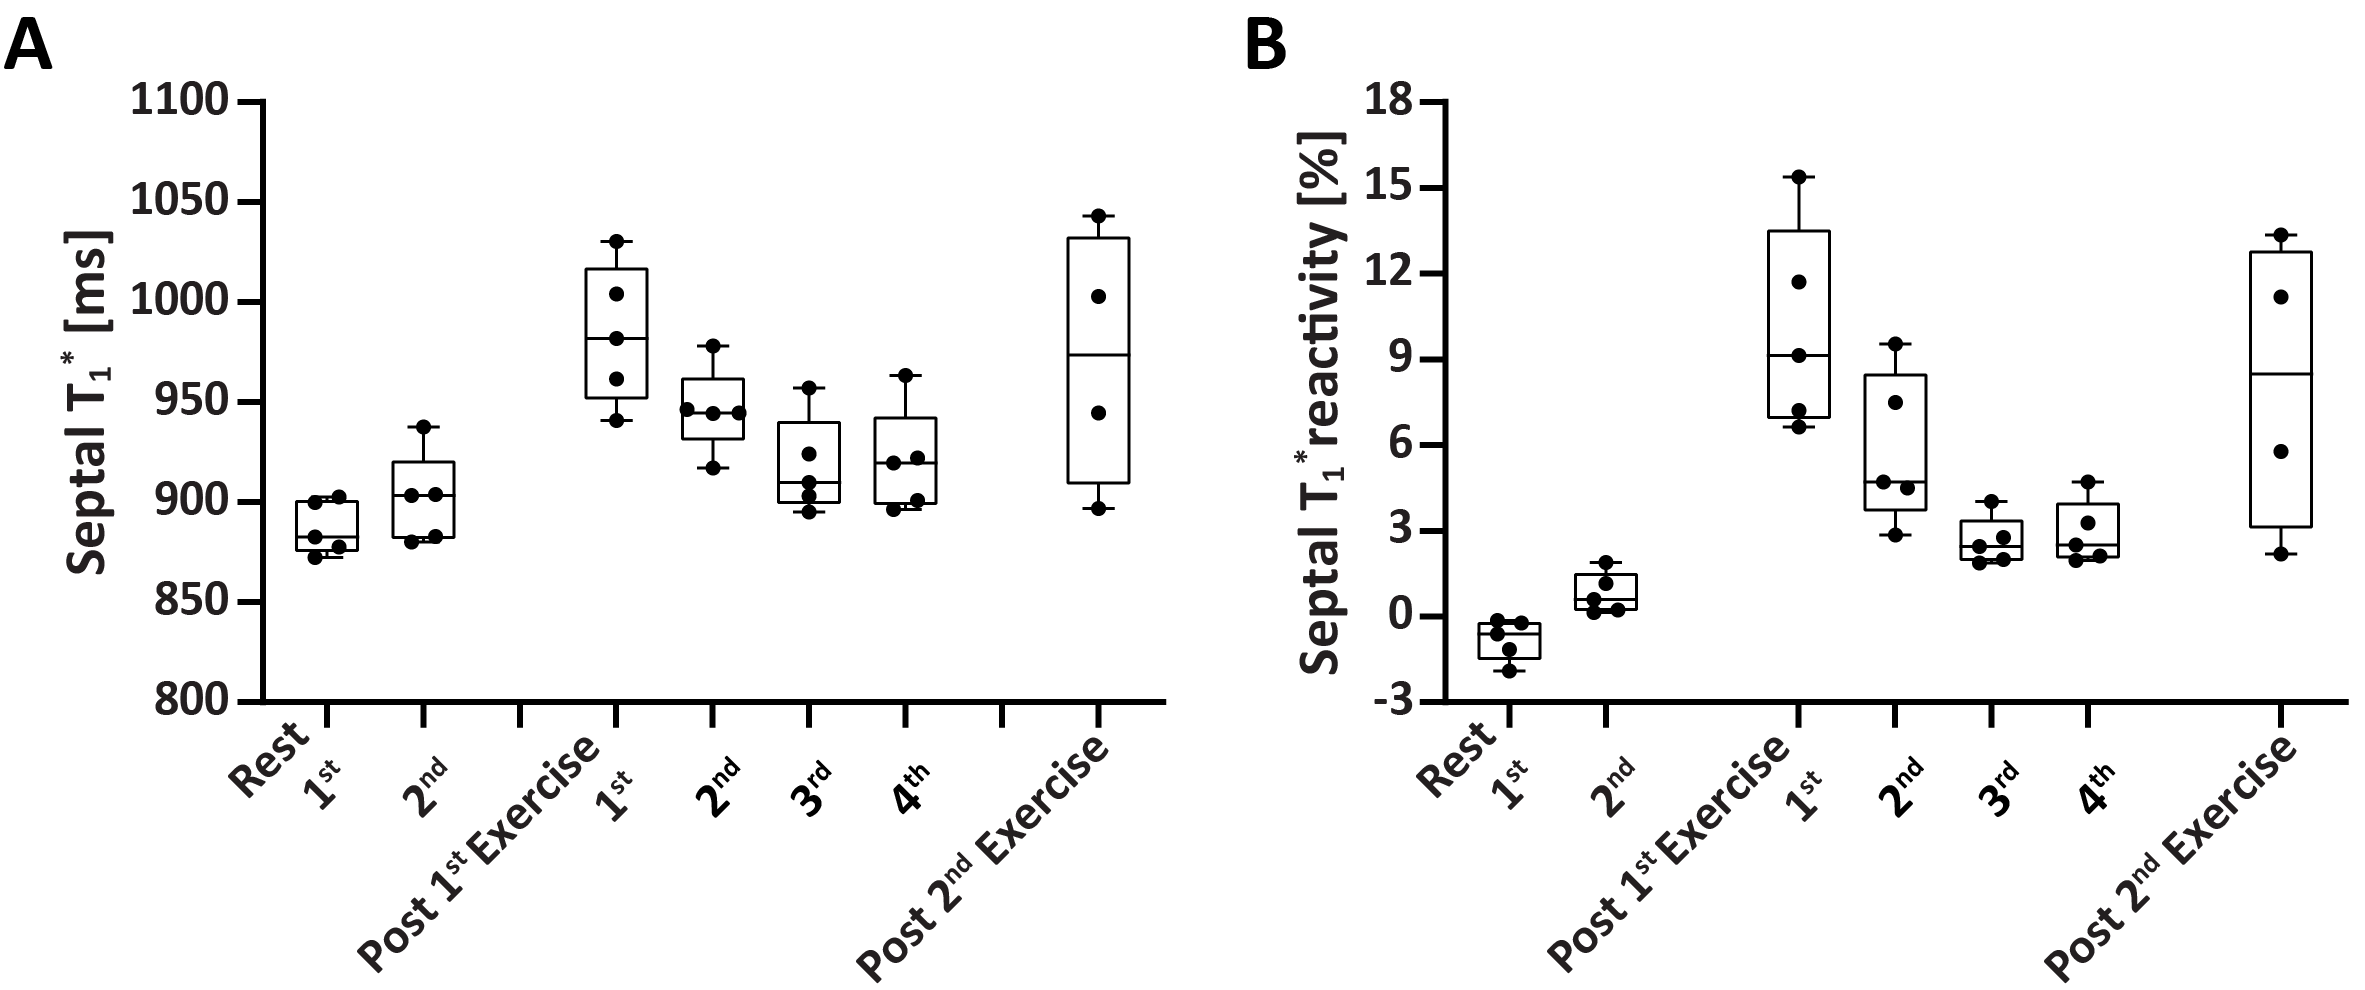
Phantom: In Figure 2A, when spokes increased from 20 to 80, the coefficient of variation of all vials decreased from 2.64% to 1.63% and the overall coefficient of variation was smaller than 3%. Figure 2B show the mean and SD of T1* of each vial from 10 measurements by DELTA at the simulated heart rate of 60 bpm. The corresponding relative ΔT1*%($$$\Delta{T_{1}^*}_{\textit{}i}\%=\frac{{T_1^*}_{\textit{i}}-{T_1^*}_{\textit{avg}}}{{T_1^*}_{avg}}\times100$$$, where T1*avg was mean of ten measurements) ranged from -1.5% to 1.8% (Figure 2C). In Figure 2D, the T1* was nearly constant at different heart rates with low variation.In vivo: Figures 3 shows representative T1* maps of one healthy volunteer. The mean LV and septal T1* measured by MOLLI5(3)3 and DELTA were 835±78ms and 929±65ms (P=0.01), and 863±87ms and 946±74ms (P=0.03), respectively. SD of LV and septal T1* was 62±9ms and 67± 13ms (P=0.25), 44±6ms and 46±8 ms (P=0.42), respectively. For DELTA, SD of ΔT1* of LV and septal T1* were 4.4% and 4.5% respectively. Figure 4 shows T1* maps of two healthy subjects imaged at rest and after two exercises. In Figure 5A, the average septal T1* was 887±13ms and 901±22ms measured at rest, and 983±35 ms, 946±21ms, 917±24ms, and 920±26ms measured after the 1st exercise. The corresponding T1*reactivity was 10.0±3.5%, 5.8±2.6%, 2.6±0.9%, and 2.9±1.1%. After the 2nd exercise, the septal T1* and its reactivity were 971±64 ms and 8.1±5.1% (Figure 5B).
Discussion and Conclusion
Phantom T1* by DELTA was heart-rate insensitive and had comparable precision to that from MOLLI. The measured T1*reactivity of healthy subjects was correlated with time after exercise-stress. In conclusion, DELTA can quantify myocardium T1* and reveal changes in myocardial tissue properties with stress using physiological exercise. Further studies are warranted to establish the diagnostic accuracy of DELTA in detecting myocardial ischemia.Acknowledgements
No acknowledgement found.References
1. Nakamori S, Fahmy A, Jang J, El-Rewaidy H, Neisius U, Berg S, Goddu B, Pierce P, Rodriguez J, Hauser T, Ngo LH, Manning WJ, Nezafat R. Changes in Myocardial Native T1 and T2 After Exercise Stress: A Noncontrast CMR Pilot Study. JACC Cardiovasc Imaging 2020;13(3):667-680.
2. Qi H, Qiao H, Sun A, Chen S, Zhao X, Li R, Yuan C, Chen H. Highly Undersampled Kooshball Reconstruction with Low-rank Modeling and Sparsity Constraints for High-resolution T1 Mapping. In Proceedings of the 27th Annual Meeting of ISMRM, Paris, France 2018.
3. Captur G, Gatehouse P, Keenan KE, Heslinga FG, Bruehl R, Prothmann M, Graves MJ, Eames RJ, Torlasco C, Benedetti G, Donovan J, Ittermann B, Boubertakh R, Bathgate A, Royet C, Pang W, Nezafat R, Salerno M, Kellman P, Moon JC. A medical device-grade T1 and ECV phantom for global T1 mapping quality assurance-the T1 Mapping and ECV Standardization in cardiovascular magnetic resonance (T1MES) program. J Cardiovasc Magn Reson 2016;18(1):58.
4. Kellman P, Wilson JR, Xue H, Ugander M, Arai AE. Extracellular volume fraction mapping in the myocardium, part 1: evaluation of an automated method. J Cardiovasc Magn Reson 2012;14(63).
5. Messroghli DR, Radjenovic A, Kozerke S, Higgins DM, Sivananthan MU, Ridgway JP. Modified Look-Locker inversion recovery (MOLLI) for high-resolution T1 mapping of the heart. Magn Reson Med 2004;52(1):141-146.
Figures