0503
Rapid Physiological Dynamics Measured by Real-Time MRI at Up to 100Hz: MR Kinematography1Department of Biomedical Engineering, Johns Hopkins University, Baltimore, MD, United States, 2The Division of Cardiology, Department of Medicine, Johns Hopkins University, Baltimore, MD, United States, 3Biomedizinische NMR, Max-Planck-Institut fur biophysikalische Chemie, Gottingen, Germany, 4The Division of MR Research, Department of Radiology, Johns Hopkins University, Baltimore, MD, United States
Synopsis
The advent of high-speed real-time (RT) MRI permits monitoring of physiological function at unprecedented frame-rates. Here, physiological dynamics at 25-100 frames-per-second are explored using temporal domain Fourier transform (FT) and principal component analysis (PCA). RT cerebral, cardiac and pharyngeal datasets are acquired with continuous radial encoding and nonlinear inverse reconstruction implemented in graphics processing units. FT detects spectral patterns in pharyngeal images acquired during speaking. FT and PCA reflect components associated with breathing and cardiac functions in the brain while decomposition and synthesis in the time-domain can pinpoint cardiac wall motion abnormalities in patients with heart disease.
Introduction
Real-time (RT) MRI 1 has been demonstrated at up to 100 frames-per-second (fps) 2–4 using radial acquisition and nonlinear inverse reconstruction implemented with graphics processing units (GPU). While physiological variations are known to affect the signal intensity in dynamic MRI even at ~3 fps, 5 the physiological information extracted from signal fluctuations observable in RT as well as cine MRI streams is presently limited. 6,7 Here, physiological information is extracted from RT datasets acquired at 25-100 fps by temporal domain Fourier transform (FT) and principal component analyses (PCA). RT pharyngeal MRI acquired during speaking reveals spectral patterns on speech-associated musculature. RT cerebral and cardiac data acquired from healthy subjects and patients with cardiac wall motion abnormalities (WMAs) are decomposed to synthesize images exhibiting temporal physiological processes.Methods
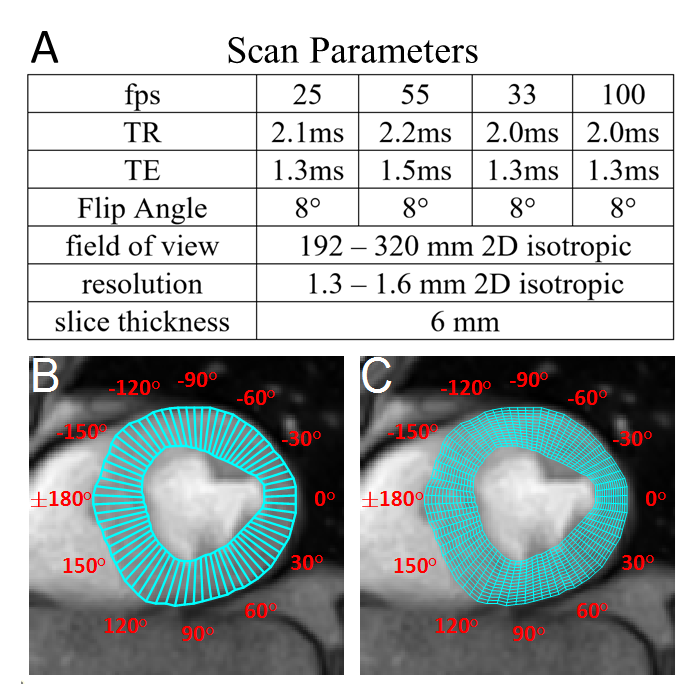
Data AcquisitionIn vivo studies were performed on a Siemens 3T Prisma Scanner. Online RT reconstruction was performed on a SysGen Octuple-GPU bypass computer-based system with 8 Nvidia GPUs connected to the scanner via an Ethernet cable. 1,2,4 IRB-approved studies of healthy volunteers (age 25-30 for pharynx and brain; age 34-66 for cardiac studies) and cardiac patients (age 50-66) with left ventricular (LV) WMAs identified by echocardiography, were performed with scan parameters listed in Figure 1A. Pulse and respiration were monitored peripherally.
LV Segmentation with SNAKEs
Short-axis LV cardiac scans was segmented into regions-of-interest (ROIs) by the active contour (SNAKEs) method in a semi-automatic process. The epi- and endo-cardial LV borders were manually drawn in the first dynamic frame from which the LV was automatically segmented with SNAKEs in subsequent frames, each using the final ROI of the previous frame to initiate the next. Each segmented cardiac section was divided into 72 sectors and aligned according to their polar angle (Figure 1C). The signal within aligned sectors was averaged and unwrapped to produce angular-temporal plots. For quantitative radial analysis, each sector was further segmented into 15 smaller sectors along the radial dimension (Figure 1C).
FT and PCA
Fast FT (FFT) performed on datasets along the temporal dimension resulted in a 3D matrix with two spatial and one frequency dimension. Spectra were generated by integrating both spatial dimensions. Images at specific frequencies were generated by slicing the frequency dimension. FFT performed on segmentations acquired over short-time periods (STFT) were used to extract physiological information that changed with time. The STFT segmentation period was 128 temporal frames. 4D datasets were generated with two spatial dimensions, one temporal dimension, and one frequency dimension from which temporal spectrograms were generated by integrating over both spatial dimensions. PCA was implemented by vectorizing images into a space-time domain matrix which was analyzed by singular value decomposition. Decomposed images associated with the largest eight singular values were synthesized from the corresponding vectors. A synthesized 3D image series was generated with two spatial and one temporal dimensions for each component. Temporal curves for each component were generated by integrating both spatial dimensions. Images of each component calculated from the square-root of the sum-of-the-squares (SSOS) along the temporal dimension of synthesized images, show elevated signal in areas of high motility. Short axis cardiac datasets were analyzed in the angular-temporal domain.
Results
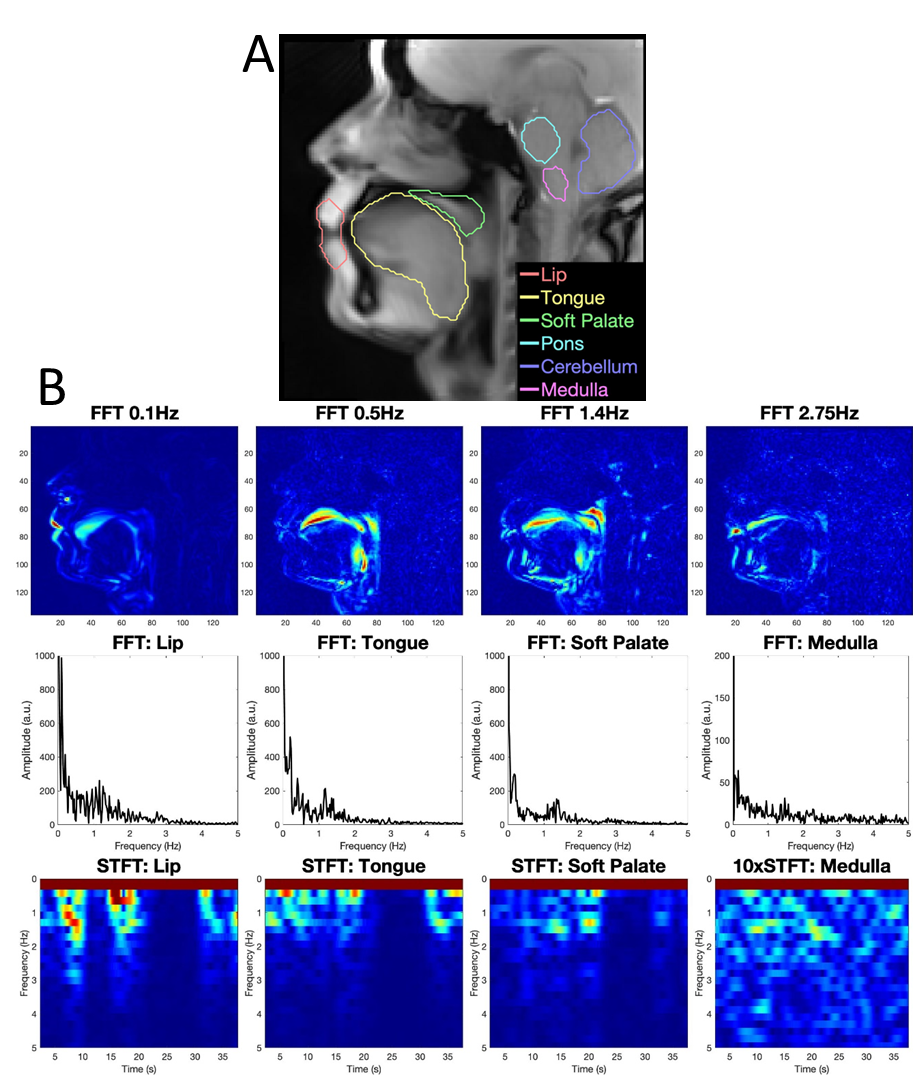
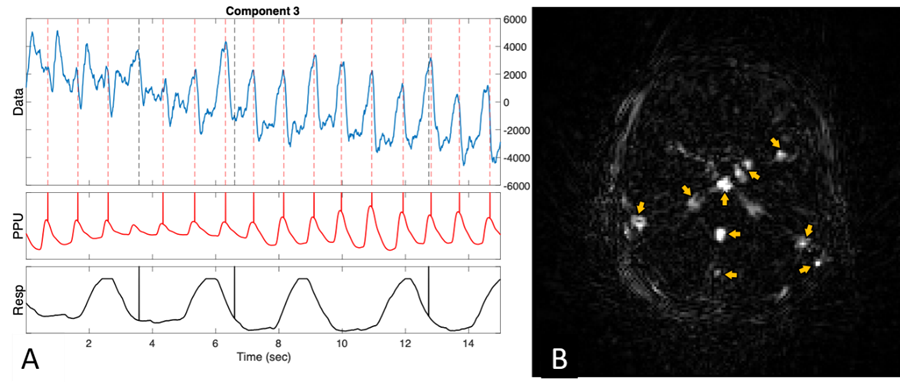
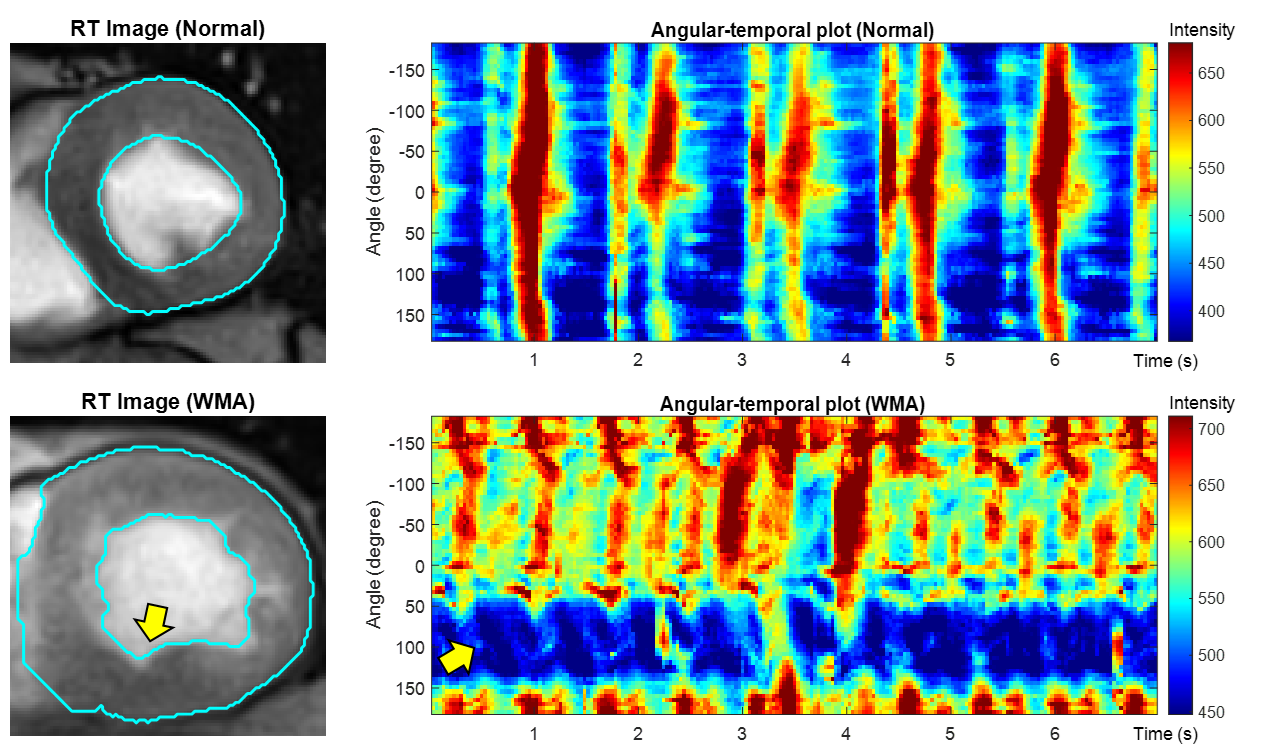
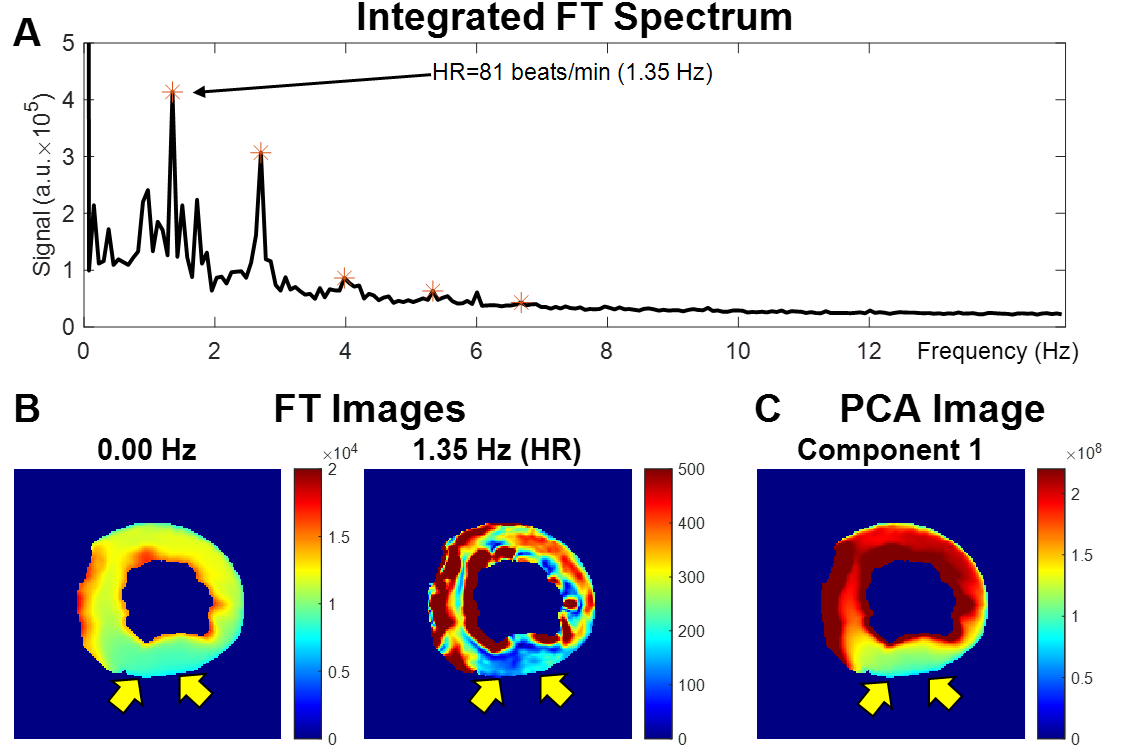
Figure 2A shows ROIs on a 55 fps (18 ms) sagittal image of the pharynx and brain. Figure 2B demonstrates FFT images reconstructed at different frequencies of motion (top), along with the FFT (middle) and STFT (bottom) spectra of the RT data acquired while the subject spoke. The lip, tongue, and soft palate exhibit different frequency patterns. Although the medulla area is not directly involved in speech, some physiological signal variations are evident. PCA analysis of RT cerebral images in Figure 3 shows components at the heart rate reflecting pulsatile blood flow (Figure 3A). Blood flow enhances the arterial signals in the spectral image extracted at the cardiac frequency (Figure 3B). Figure 4 demonstrates angular-temporal plots of 33 fps RT cardiac data of a normal subject and a patient with inferior-septal WMA (yellow arrows). The data are dynamically rich with the WMA presenting with low motility and signal in the angular-temporal plots (arrow, right bottom). Figure 5 (top) shows the integrated FT spectrum from this patient with peaks at the heart rate and its harmonics (top). In the FT and PCA images (bottom), the static, 1.35 Hz (heart rate) and principal components show reduced intensity in the vicinity of the WMA.Discussion and Conclusion
This is a preliminary study on the application of RT MRI at up to 100 fps to detect temporal functional physiological information. FT and PCA detected spectral patterns associated with the muscular kinematics of speech, the cerebral vascular response to pulsatile blood flow, and abnormal cardiac wall motility. While at this submission deadline, studies are limited to 6 cardiac and 3 speaking/brain studies, work is ongoing. The physiological/kinematic signals obtained from RT MRI are limited by signal-to-noise ratio and are intermingled with other physiological processes, including motion. Averaging can be applied either temporally with STFT segmented frames, or spatially within an ROI (for example, using angular-temporal plots).Acknowledgements
Supported in part by NIH grant R21 EY028353.References
1. Uecker M, Zhang S, Voit D, Karaus A, Merboldt K-D, Frahm J. Real-time MRI at a resolution of 20 ms. NMR Biomed. 2010;23:986–994.
2. Niebergall A, Zhang S, Kunay E, et al. Real-time MRI of speaking at a resolution of 33 ms: Undersampled radial FLASH with nonlinear inverse reconstruction. Magn Reson Med 2013;69:477–485.
3. Zhang S, Joseph AA, Voit D, et al. Real-time magnetic resonance imaging of cardiac function and flow—Recent progress. 2014 2014;4:313–329.
4. Frahm J, Voit D, Uecker M. Real-Time Magnetic Resonance Imaging: Radial Gradient-Echo Sequences With Nonlinear Inverse Reconstruction. Investigative Radiology 2019;54:757–766.
5. Bauman G, Puderbach M, Deimling M, et al. Non-contrast-enhanced perfusion and ventilation assessment of the human lung by means of fourier decomposition in proton MRI: Non-CE Functional Lung Imaging in 1 H MRI. Magn. Reson. Med. 2009;62:656–664.
6. Cox RW, Jesmanowicz A, Hyde JS. Real-Time Functional Magnetic Resonance Imaging. Magn. Reson. Med. 1995;33:230–236.
7. Zerhouni EA, Parish DM, Rogers WJ, Yang A, Shapiro EP. Human heart: tagging with MR imaging--a method for noninvasive assessment of myocardial motion. Radiology 1988;169:59–63.
Figures