0501
Characterization of B1+ Field Variation at 3 Tesla in 373 Healthy Brains over the Lifespan1Biomedical Engineering, University of Alberta, Edmonton, AB, Canada
Synopsis
To perform accurate T1 and T2 mapping, $$$B_1^+$$$ maps are usually required, but not always available. For these situations, a large dataset of $$$B_1^+$$$ maps may aid in predicting $$$B_1^+$$$. In this work, Bloch-Siegert $$$B_1^+$$$ maps in the brain are characterized from a dataset of 373 healthy participants on the same 3 T. After transforming all maps to the same standard space, we show that $$$B_1^+$$$ distribution is similar across subjects with a mean CoV of 3.65% across the whole brain; slight variations were found due to brain size, shape, CSF volume, head orientation and transmit power calibration.
Introduction
Accurate T1 and T2 mapping requires knowledge of the exact flip angles in each voxel, which is often achieved by measuring the transmit RF field, $$$B_1^+$$$. At field strengths of 3 T or greater, there is substantial $$$B_1^+$$$ inhomogeneity in the brain arising from the shortened wavelength1. $$$B_1^+$$$ inhomogeneity in the brain has been well studied1-4; however, there is a lack of large, experimental datasets on $$$B_1^+$$$ inhomogeneity in the brain. Such a dataset could provide a reference standard on $$$B_1^+$$$ spatial variations within the brain and provide a platform towards predicting $$$B_1^+$$$ in individuals to enable more widespread use of quantitative MRI in cases where $$$B_1^+$$$ maps are not available. Here, we characterize the $$$B_1^+$$$ field of the brain at 3 T in 373 healthy subjects through acquisition of Bloch-Siegert $$$B_1^+$$$ maps5.Methods
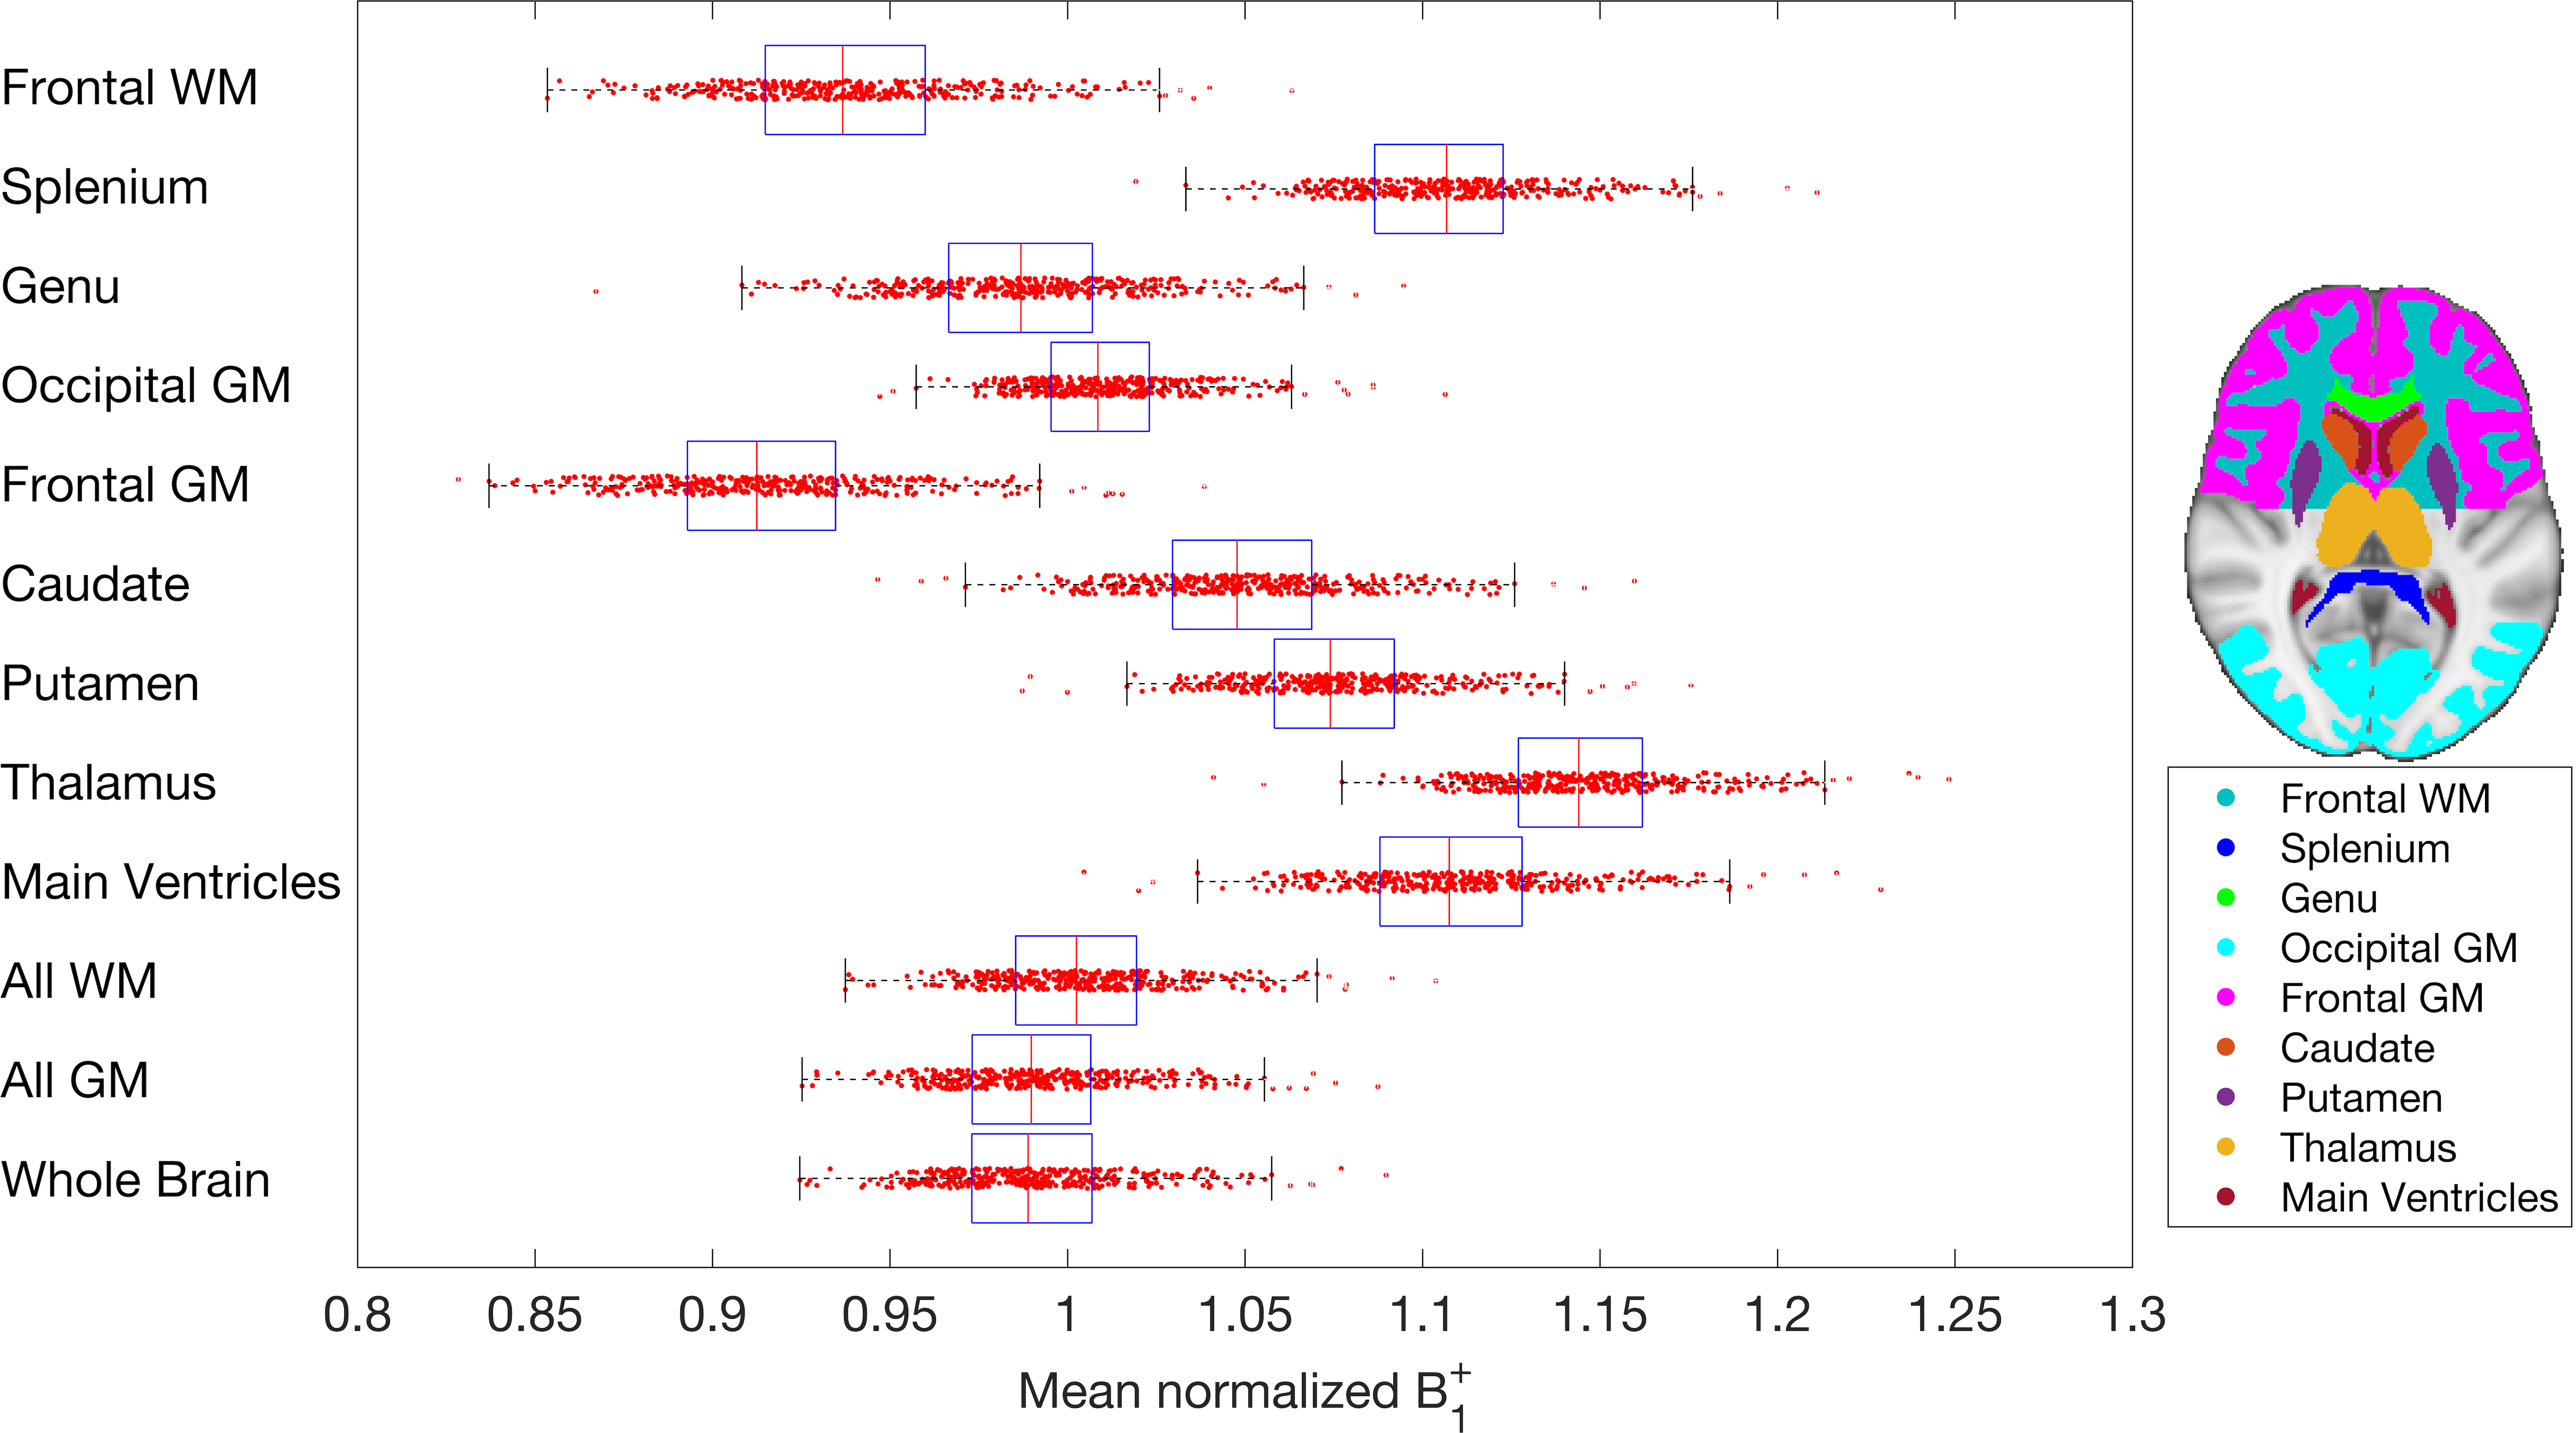
Acquisition: Bloch-Siegert $$$B_1^+$$$ maps of 373 healthy subjects (176M/197F, age 36 ± 22 years, range 5/90 years) were acquired on the same 3 T (Prisma, Siemens Medical Systems) using standard body coil transmission and a 64-channel head-neck receive coil. Each whole brain $$$B_1^+$$$ map was acquired in an axial-oblique orientation with 1.3x1.3x3.3 mm3, 40 slices, 240x240mm2 FOV in 39 sec. All subjects used the same standard RF shim values used in clinical MRI scans without additional RF shimming methods. The acquisition also included a T1-weighted sagittal magnetization prepared rapid acquisition gradient echo (MPRAGE) with TR/TE/TI = 1800/2.37/900 ms, 0.87x0.87x0.85 mm3, 208 slices, FOV 250x250 mm2 in 3:39 min sequence used for image segmentation and spatial normalization.Analysis: The resulting phase images from the Bloch Siegert maps were further processed to determine the normalized field variation. All $$$B_1^+$$$ maps were spatially normalized to the MNI ICBM 152 atlas template6 by applying FSL-FNIRT7 to the corresponding T1w images. This step allowed for a standard space comparison between $$$B_1^+$$$ maps by normalizing brain size and shape. In MNI space, global variations between subjects were measured using the voxelwise coefficient of variation, and regional variations were measured using the mean $$$B_1^+$$$ from several bilateral ROIs. Native space maps were used to study specific $$$B_1^+$$$ variations caused by extremes in age, brain shape and head orientation; this was done to avoid the distraction of any $$$B_1^+$$$ distortions that result from spatial normalization.
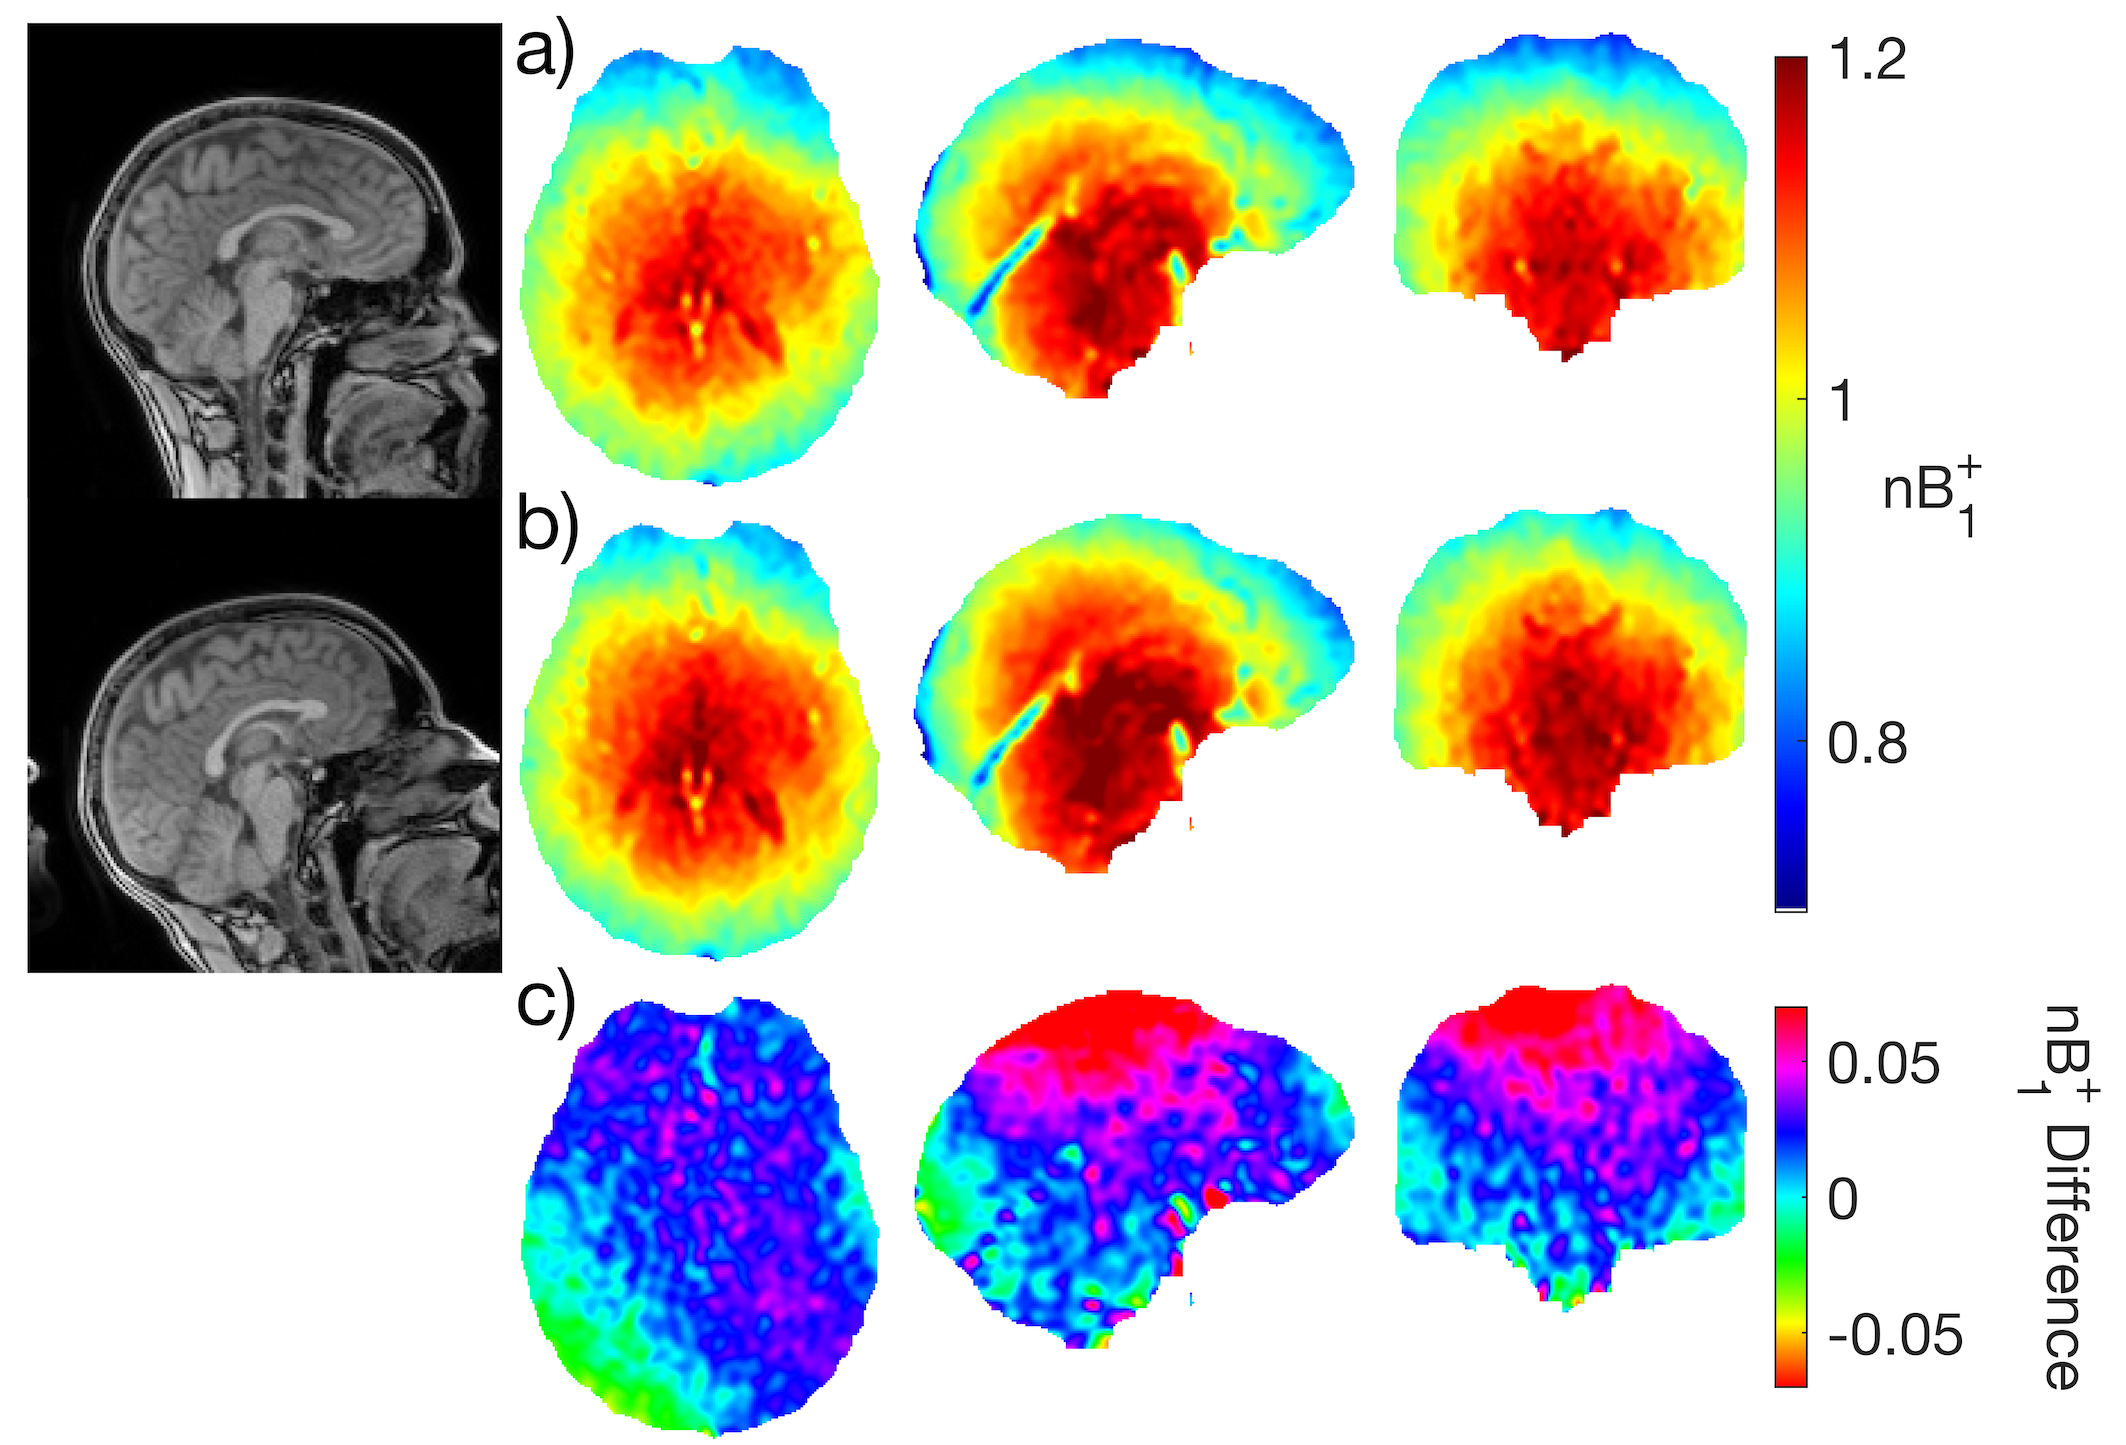
Results/Discussion
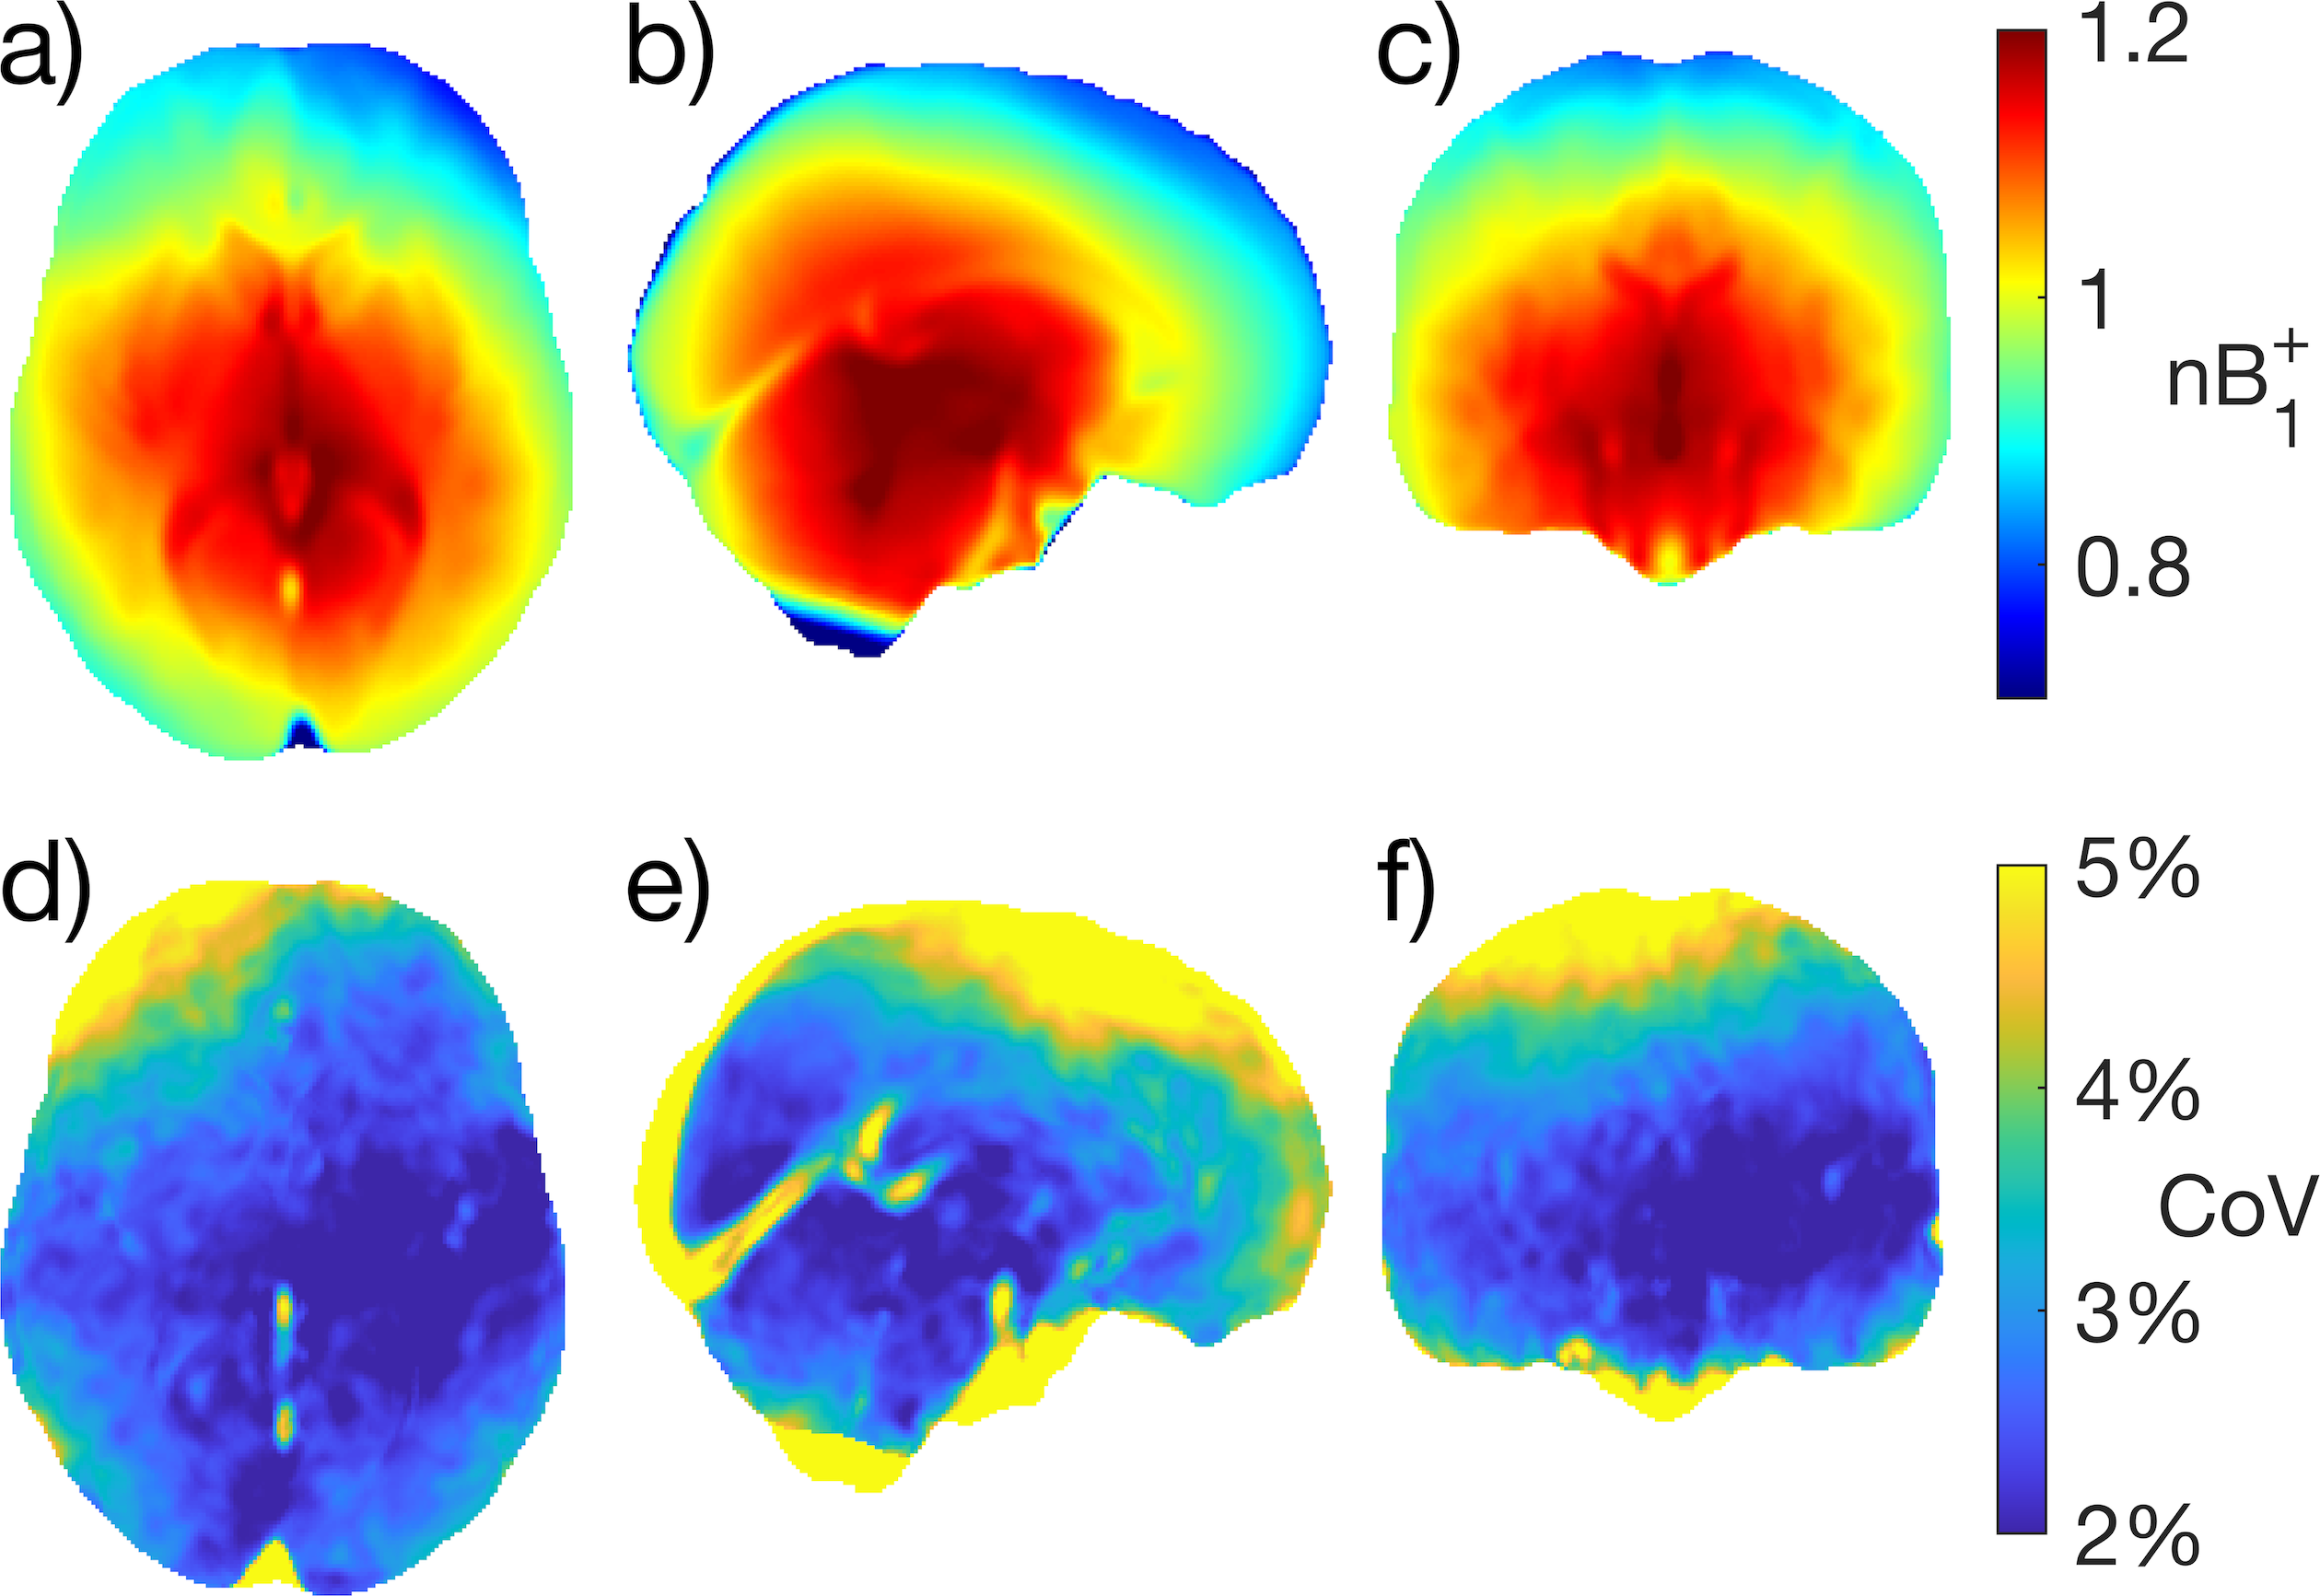
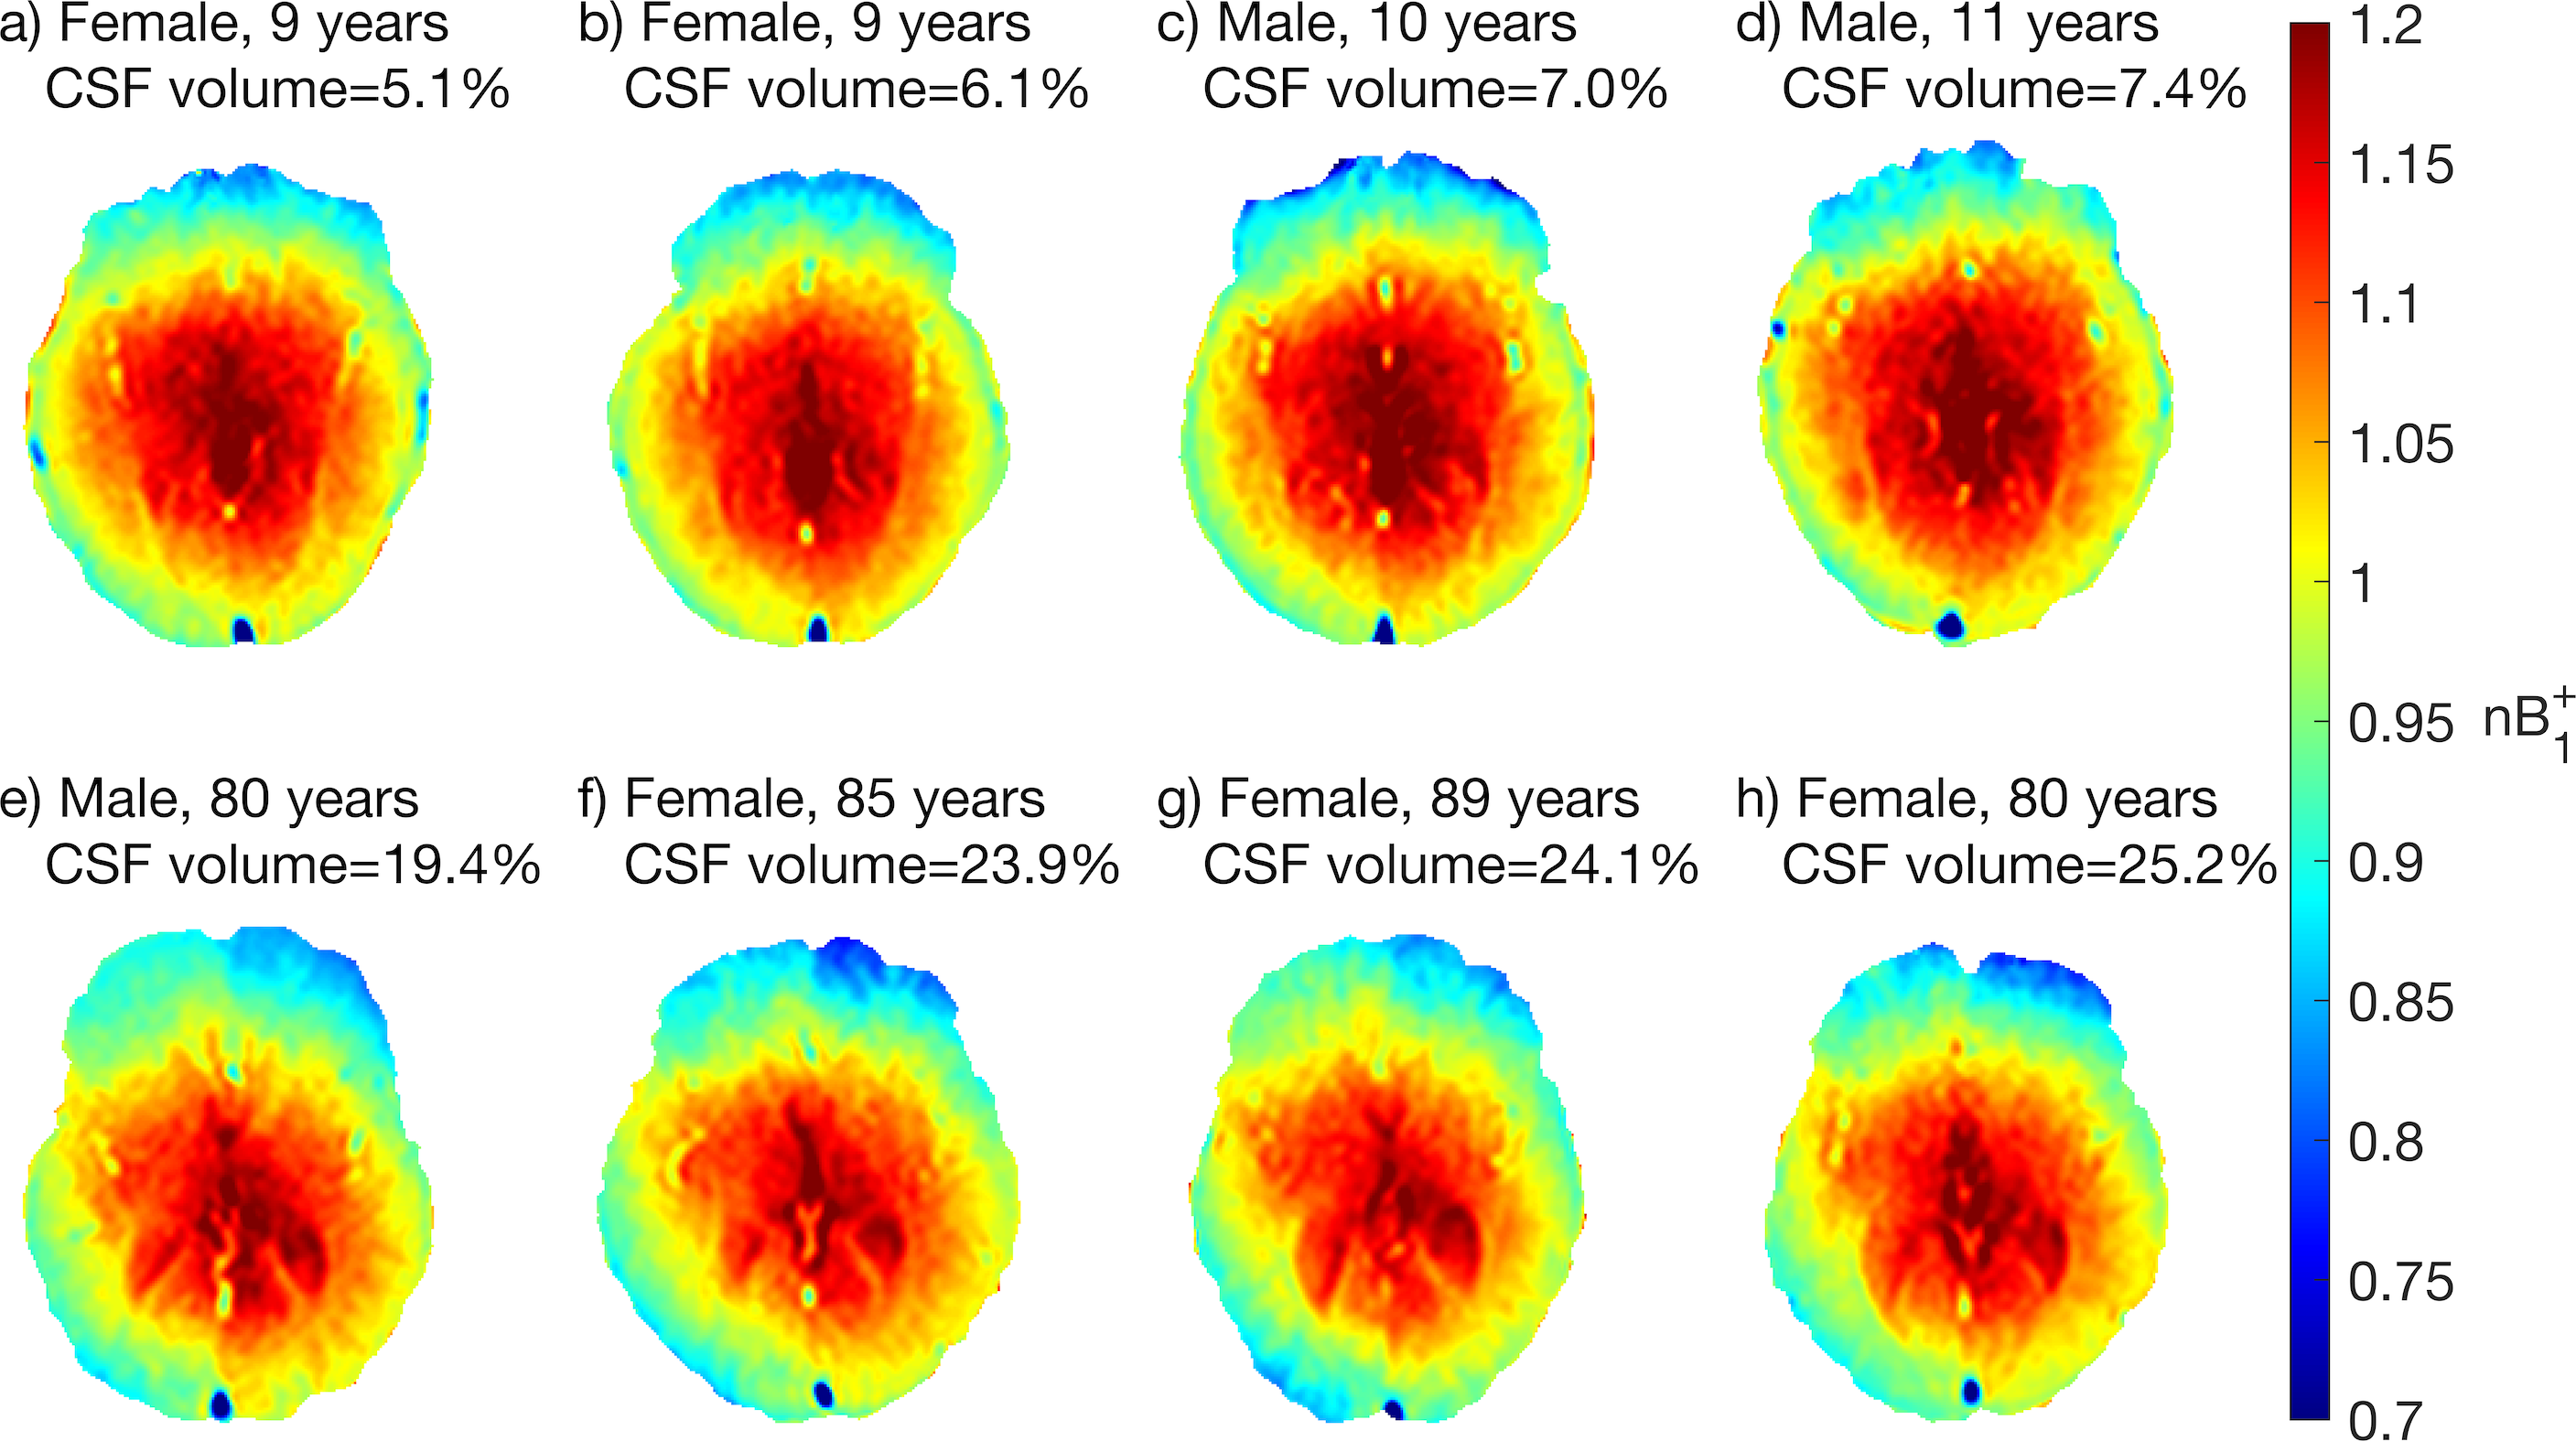
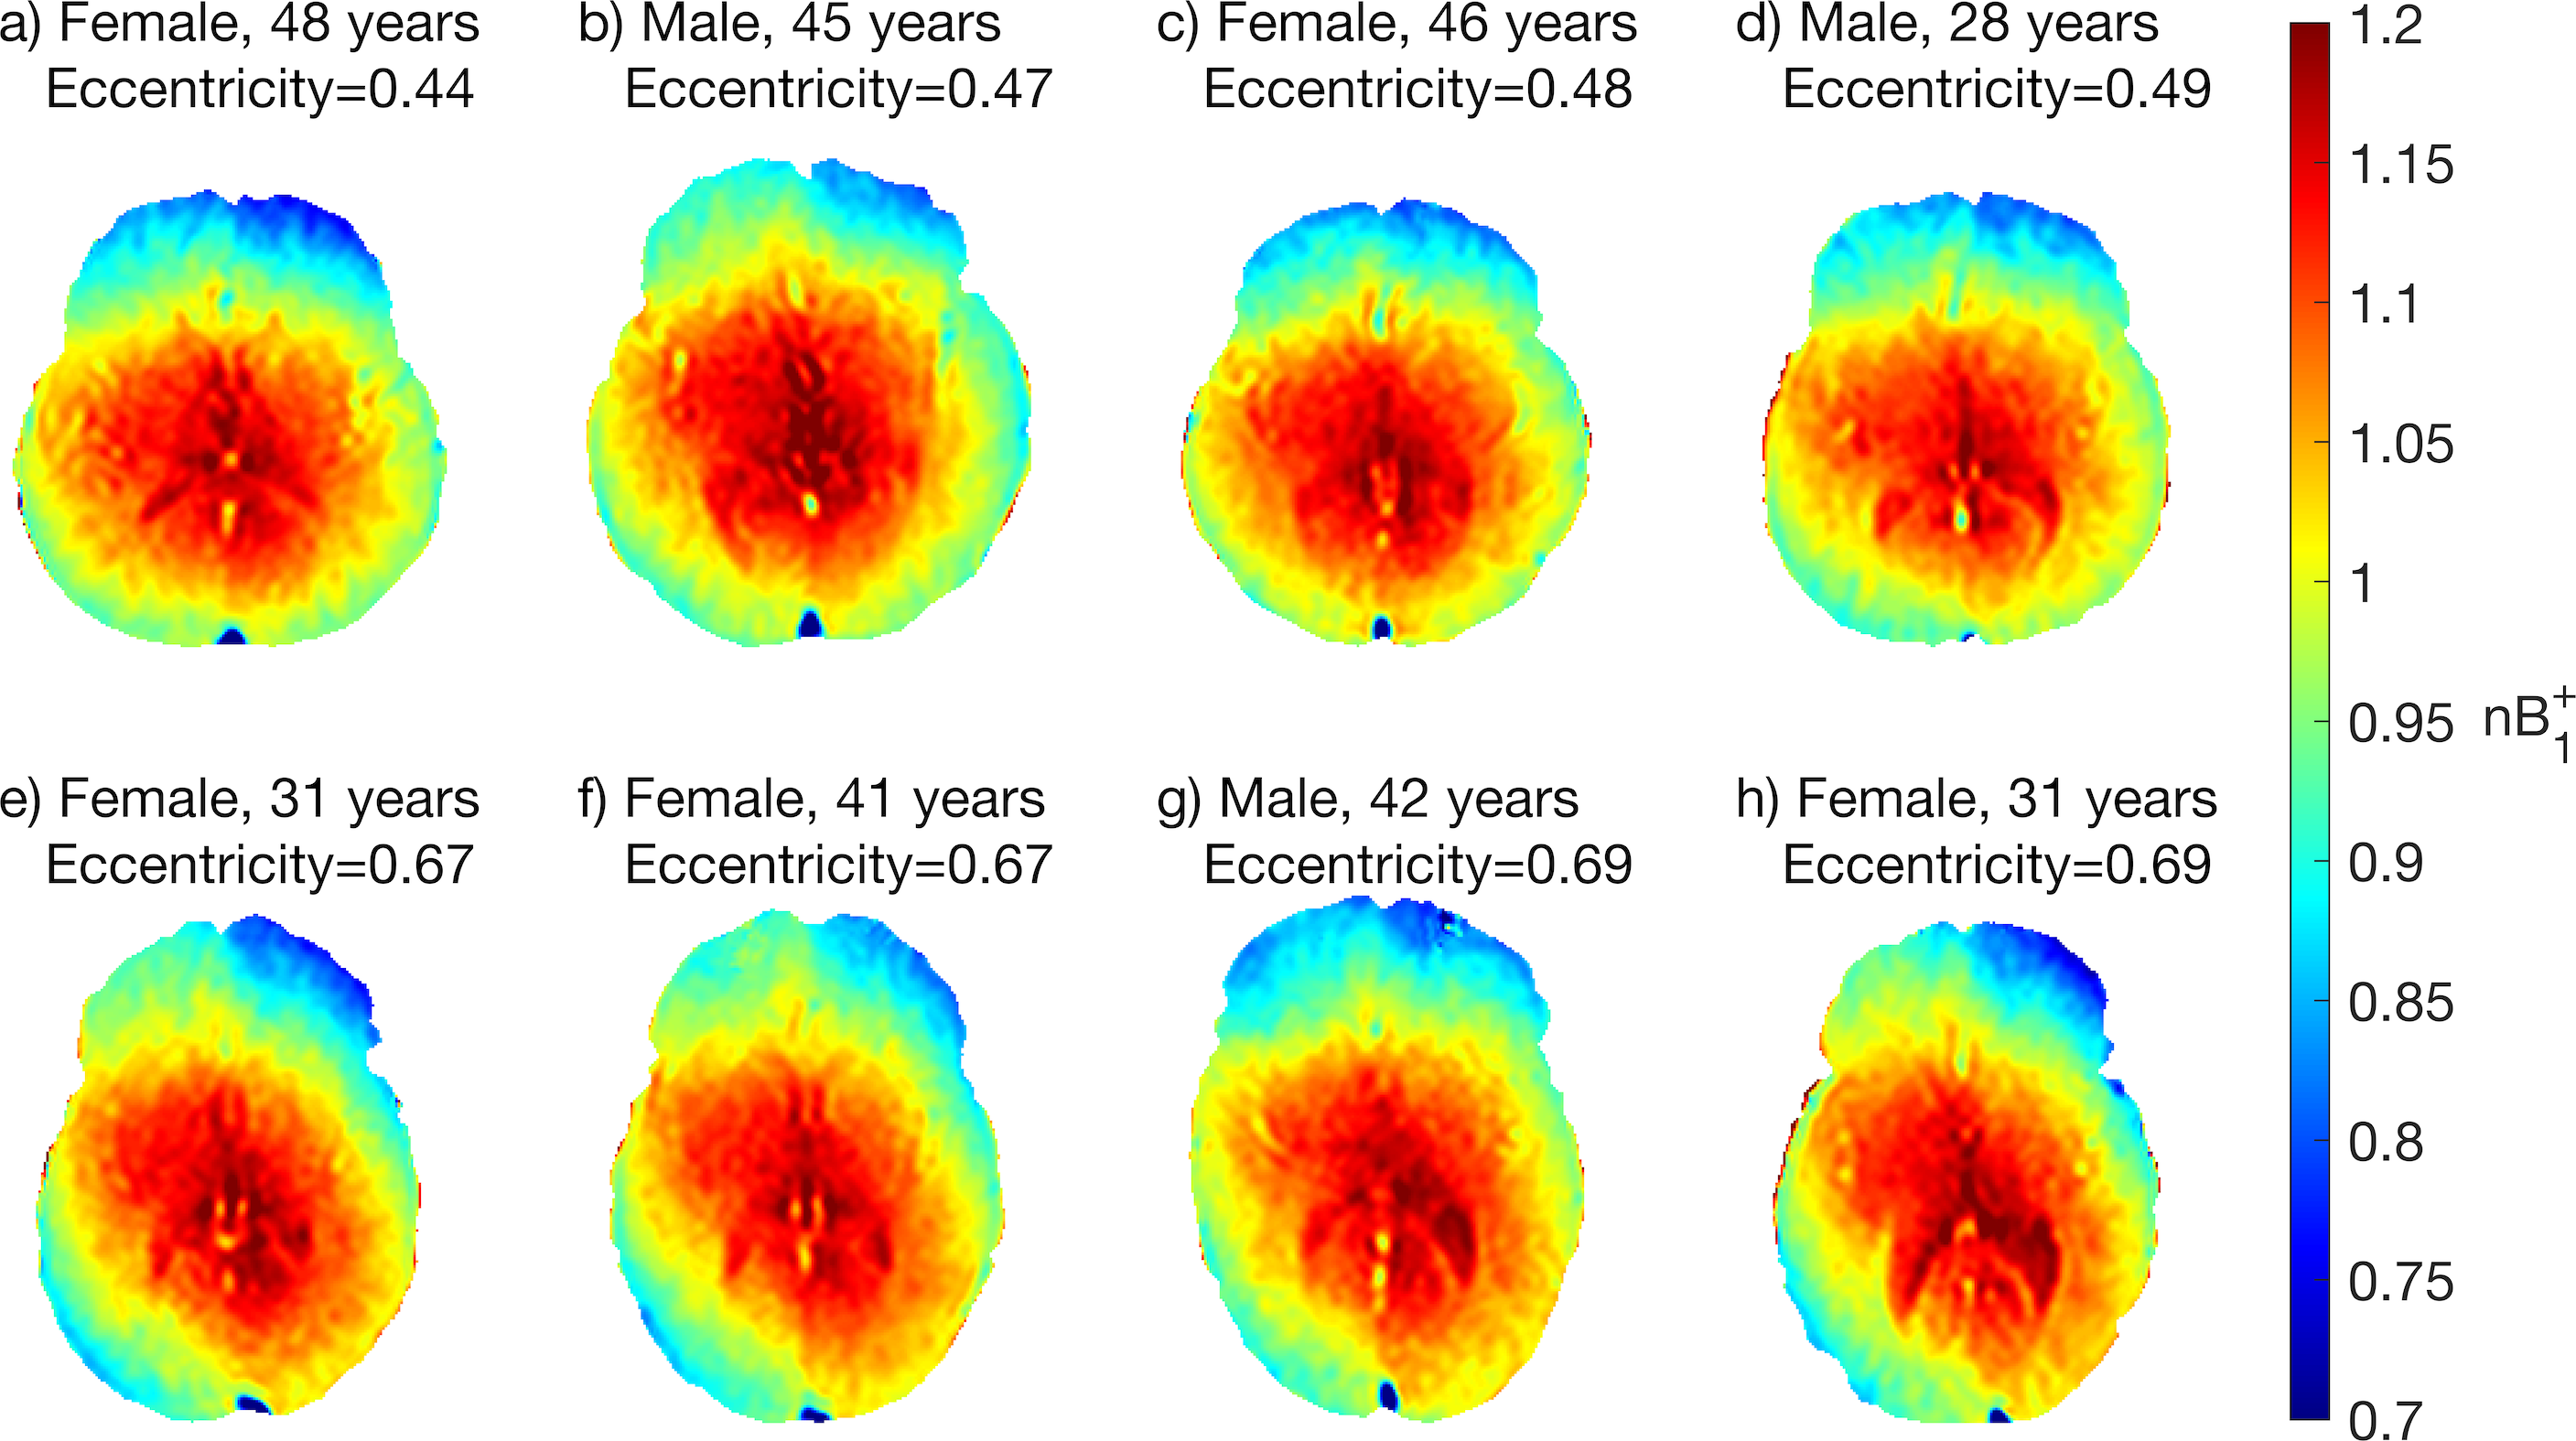
Figure 1 shows the mean $$$B_1^+$$$ map and voxelwise coefficient of variation in MNI space. Due to RF interference, the $$$B_1^+$$$ field falls off away from the central regions by more than 20% (Figure 1a-c), with larger brains exhibiting greater $$$B_1^+$$$ inhomogeneity due to a greater extent of destructive interference across the brain. $$$B_1^+$$$ variations in several ROIs are shown in Figure 2. Of the ROIs measured, $$$B_1^+$$$ was found to be lowest in the Frontal GM and highest in the Thalamus, with a 23% difference in mean $$$B_1^+$$$ between the two structures; the Frontal GM also showed the greatest standard deviation across subjects. Along with ROI variations in $$$B_1^+$$$, there were also variations in the mean $$$B_1^+$$$ of the whole brain due to transmit power calibration (mean whole brain $$$B_1^+$$$ = 0.991 ± 0.026, see bottom plot of Fig. 2). For the MRI system used, transmit power calibration was performed on a 10 cm coronal slab around isocenter, with body coil reception constraining and weighting the superior-inferior extent. The transmit calibration introduces slight deviation from the expected 1.0 (nominal) mean $$$B_1^+$$$ in the brain because the power required to achieve nominal flip angle in the calibration slab may vary slightly from that required in the brain region.Approximately 80% of the $$$B_1^+$$$ maps displayed an obvious twisting in the axial plane. This twisting arises from induced eddy currents that perturb $$$B_1^+$$$ with an oppositely polarized field3. Twisting effects varied with age due to differences in CSF volume (Figure 3), as CSF has a much higher conductivity (σ = 2.14 S/m) when compared to grey matter (σ = 0.59 S/m) or white matter (σ = 0.34 S/m)8. This twisting effect was also observed to be more visible in the most elliptical brains (Figure 4), as discussed in other studies2.
Due to the left-right constraint of the receive head coil, significant orientation differences between subjects were only observed in the pitch of the head. As demonstrated through prospective scanning (Figure 5), changing the pitch of the head will change the path length differences from different rungs of the RF transmit coil, thereby changing the interference pattern as well as the eddy current distribution within the brain.
Conclusion
Normalized $$$B_1^+$$$ maps were characterized across 373 healthy subjects aged 5-90 years after spatial normalization to an atlas space. Global $$$B_1^+$$$ distribution was found to be similar between subjects with a mean CoV of 3.65% across the whole brain. Likewise, regional $$$B_1^+$$$ was found to be similar between most subjects with slight differences observed due to brain size, shape, CSF volume, head orientation and transmit power calibration. In situations where $$$B_1^+$$$ maps are not available, the use of large experimental datasets may aid in predicting $$$B_1^+$$$ in the brain.Acknowledgements
References
1. Collins C, Liu W, Schreiber W, Yang Q, Smith M. Central brightening due to constructive interference with, without, and despite dielectric resonance. Journal of Magnetic Resonance Imaging 2005;21:192-196.
2. Sled J, Pike G. Standing-wave and RF penetration artifacts caused by elliptic geometry: an electrodynamic analysis of MRI. IEEE Transactions on Medical Imaging 1998;17:653-662.
3. Vaidya M, Collins C, Sodickson D, Brown R, Wiggins G, Lattanzi R. Dependence of B1− and B1+ field patterns of surface coils on the electrical properties of the sample and the MR operating frequency. Concepts in Magnetic Resonance Part B: Magnetic Resonance Engineering 2016;46:25-40.
4. Vaughan J, Garwood M, Collins C et al. 7T vs. 4T: RF power, homogeneity, and signal-to-noise comparison in head images. Magnetic Resonance in Medicine 2001;46:24-30.
5. Sacolick L, Wiesinger F, Hancu I, Vogel M. B1 mapping by Bloch-Siegert shift. Magnetic Resonance in Medicine 2010;63:1315-1322.
6. MNI ICBM152 non-linear – NIST. Nist.mni.mcgill.ca/?p=858 [Internet] 2009.
7. Jenkinson M, Beckmann C, Behrens T, Woolrich M, Smith S. FSL. NeuroImage 2012;62:782-790.
8. Dielectric Properties » IT'IS Foundation. Itis.swiss [Internet] 2020.
9. Katzman W, Wanek L, Shepherd J, Sellmeyer D. Age-Related Hyperkyphosis: Its Causes, Consequences, and Management. Journal of Orthopaedic & Sports Physical Therapy 2010;40:352-360.
Figures