0500
The variability of MR axon radii estimates in the human white matter1Center for Biomedical Imaging, NYU Grossman School of Medicine, New York, NY, United States, 2Max Planck Institute for Human Cognitive and Brain Sciences, Leipzig, Germany, 3Felix Bloch Institute for Solid State Physics, Leipzig University, Leipzig, Germany, 4School of Psychology, Cardiff University, Cardiff, United Kingdom, 5Mary MacKillop Institute for Health Research, Australian Catholic University, Melbourne, Australia
Synopsis
The accuracy of the quantification of axon radii in vivo using diffusion MRI has been promoted in recent years by hardware developments and novel biophysical modeling insights. The MR-derived effective radii are in good quantitative agreement with histology if one accounts for the intrinsic bias of diffusion MRI to larger axons. In this work, we show that the translation of MR axon diameter mapping to human neuroimaging is possible within acceptable scan times if strong diffusion-weighting gradients are available. Indeed, we demonstrate that the MR-derived effective axon radii is a reproducible and sensitive metric, with interesting inter- and along-tract variability.
Introduction
Axon diameter plays a crucial role in determining conductance velocity and, consequently, the timing and synchronization of neural activation [1]. Noninvasive measurement of axon diameters could have a significant impact on the understanding of healthy and diseased neural processes [e.g. 2]. A particularly relevant neuroimaging modality attuned to the microarchitecture of living brain tissue is diffusion-weighted MRI (dMRI) [3]. Reproducible biomarkers of axonal properties for studying disease onset and progression non-invasively and quantitatively in the entire brain would confer clear advantages. Recent developments in hardware [4] and biophysical modeling [5], i.e. suppression of extra-axonal signal by applying ultra-high b-values, have promted the accuracy of axon diameter mapping using dMRI. Since dMRI-derived axon diameters are - by virtue of the signal encoding - strongly biased towards the largest axons within the voxel [6], MR axon diameter mapping is particularly promising in species with relatively large brain sizes, e.g. humans [7]. In this study, we evaluate the variability and reproducibility of the effective MR axon radius across subjects, white matter tracts, scan sessions, and scanner sites.Methods
Data acquisition: Five adult healthy subjects underwent two sessions of MRI scanning on the Siemens Connectom 3T scanner of CUBRIC (Scanner 1). During each session, an optimized protocol consisting of two shells of $$$b=6000\,\mathrm{s/mm^2}$$$ and $$$b=30000\,\mathrm{s/mm^2}$$$ was acquired in 24 mins at a spatial resolution of $$$2.5\times2.5\times2.5\,\mathrm{mm}^3$$$. The protocol was optimized for precision in the estimation of the MR axon radius using a Cramer Rao Lower Bound analysis. Subjects were repositioned during a short break during the scan sessions. One subject was also scanned, two months later, with an identical protocol on the Connectom 3T scanner of the MPI-CBS (Scanner 2).Axon diameter estimation: The effective MR axon radius $$$r$$$ was estimated voxelwise from each multi-shell data set. In the experimental regime in which the extra-cellular signal can be assumed to be fully suppressed, the spherically-averaged signal $$$\bar{S}_\mu$$$ can be modeled as:
$$\bar{S}_\mu = \beta \frac{S_c^\perp(r | q, \delta, \Delta)}{\sqrt{b}},$$
with $$$b=q^2\delta^2\left(\Delta - \delta/3\right)$$$ [5]. The prefactor $$$\beta\approx\frac{f}{\sqrt{D_a^\parallel}}$$$ is a function of the intra-axonal signal fraction $$$f$$$ and the parallel intra-axonal diffusivity $$$D_a^\parallel$$$. The radial signal attenuation is modeled using the Gaussian phase approximation of the signal from protons trapped inside a cylinder with effective radius $$$r$$$ [8,9].
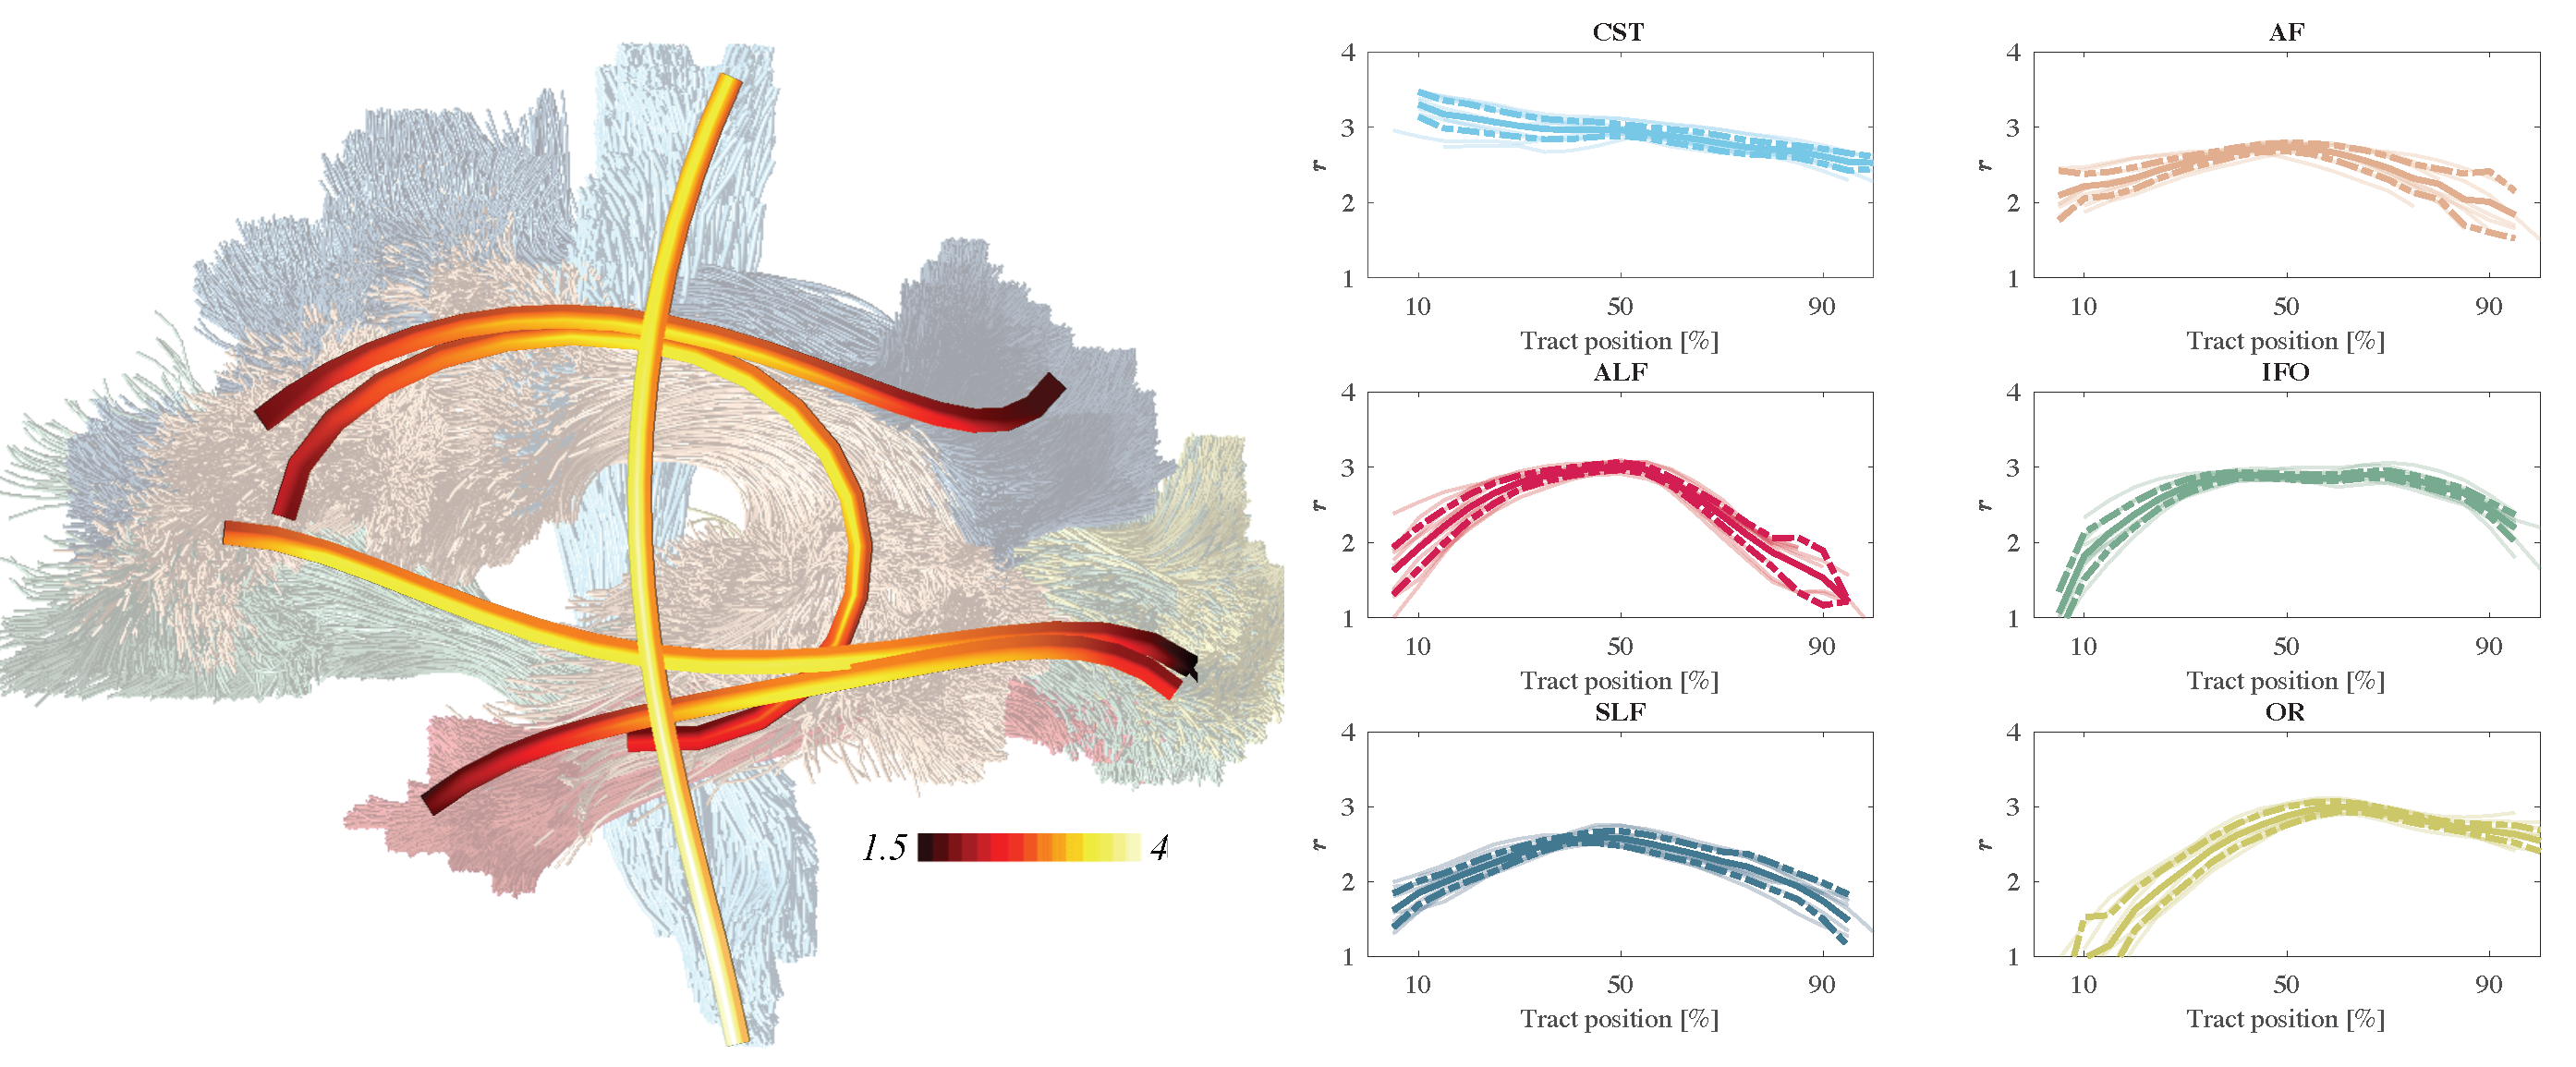
Tract-based analysis: In addition to a voxelwise estimation of the effective MR radii, we estimated the effective MR radius along the length of individual tracts [10]. Therefore, we introduce a strategy that is inspired by methods such as along fiber tract quantification [11]. The spherically-averaged signals were compressed in twenty interspaced segments per white matter tract prior to computing the effective MR radius to promote the precision of the estimator.
Results
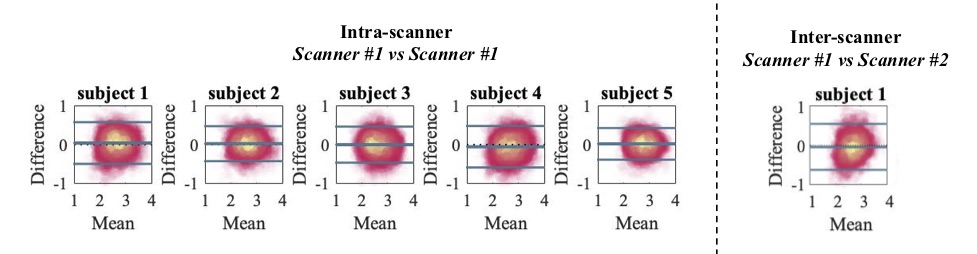
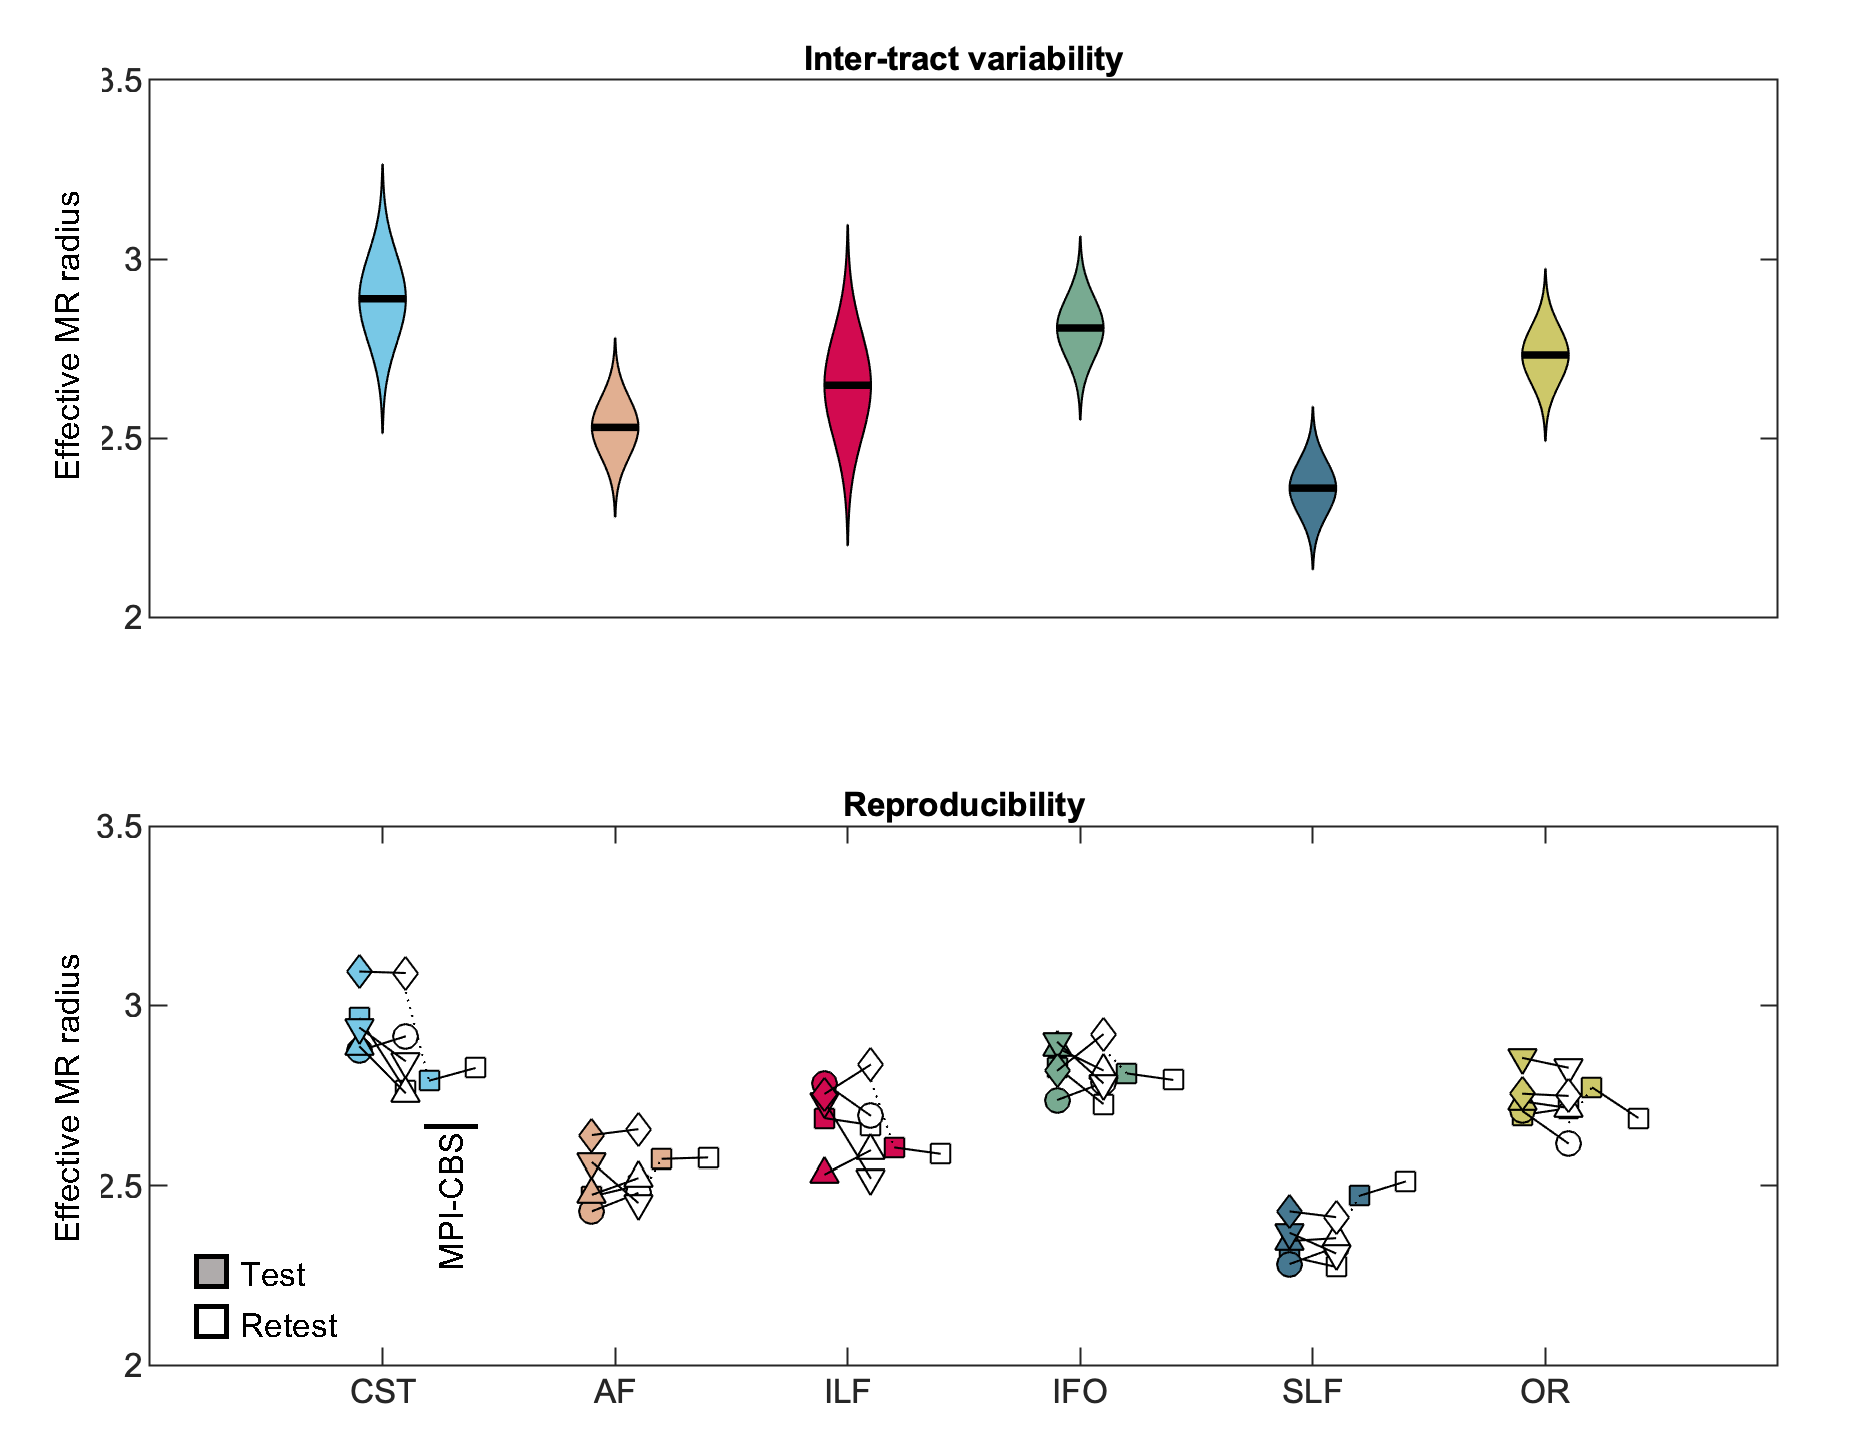
In Fig. 1, Bland-Altman plots show the agreement between repeated measurements [12]. We show the Bland-Altman plots for the five intra-scanner test-retest experiments and the single inter-scanner experiment. The absolute mean difference and its 95% confidence intervals are shown. The percentage differences were 1.51, 1.00, 0.65, -1.67, and 1.17% for the 5 subjects of the intra-scanner analysis. In comparison, the percentage difference for the inter-scanner repeatability was -1.19%. The test-retest reproducibility in the voxelwise estimation of the MR axon radius was quantified by the test-retest variability (TRV). When including all segmented white matter voxels, the TRV varied between 7.83 to 10.48% across the subjects on the first scanner. Hence, the TRV was slightly higher, yet of the same order of magnitude as conventional DTI metrics (approximately 4% in this study; data not shown). The inter-scanner reproducibility performance (TRV=10.16%) was similar to the intra-scanner reproducibility (TRV = 10.48 and 9.04%, for the CUBRIC and MPI-CBS scanner, respectively). We observed small fluctuations across tracts, but overall, the test-retest reliability was fairly homogeneous across the brain. A reduction of TRV, by on average a factor of four is observed when evaluating the TRV for along-tract segments instead of voxels.In Fig. 2, the distribution of effective MR radius per tract is shown. In addition, we show the tract-averaged effective MR radius per subject, and per tract, for the test and retest data to demonstrate that the inter-tract variability exceeds the inter-subject variability.
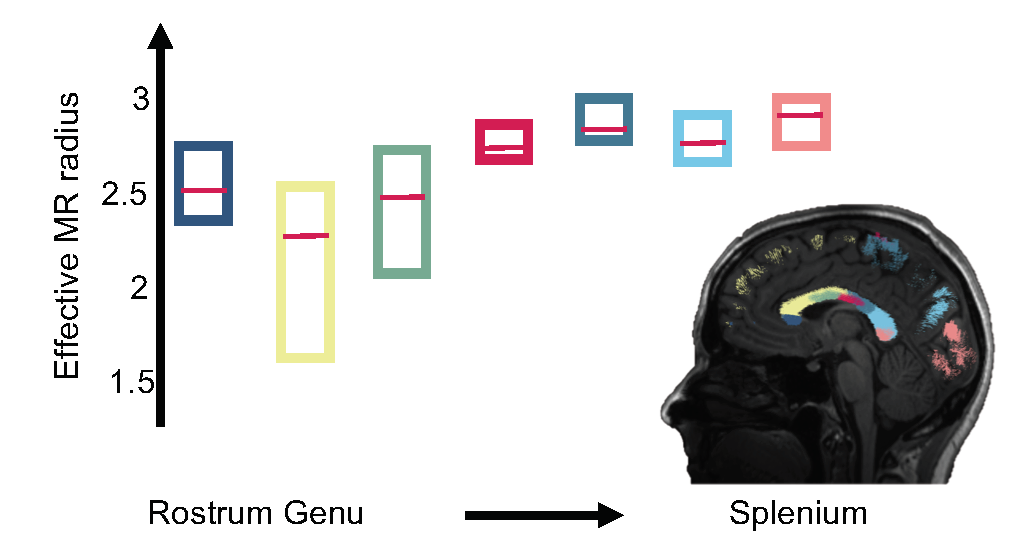
In Fig. 3, the trend of the effective MR radius in the midsagittal cross section of the CC is shown. This cross section covers the various bundles of the CC, including the rostrum, genu, body, and splenium of the CC. The box plots show the median and 95% confidence interval of the effective MR radius across the 5 subjects.
In Fig. 4, the along-tract analysis of the effective MR radius are shown. We show the average trend and its confidence interval, computed across all 5 subjects, including the test and retest data. The metric changes widely along and across the various tracts.
Conclusion
We demonstrated good to excellent reliability in the quantification of micron-sized effective MR radii using human dMRI if strong diffusion-weighted gradients are employed. As a result, we were able to observe the subtle inter- and along-tract variability that has previously been reported in histological studies [13-15]. However, further dedicated studies are warranted to gain insight into the contribution of potential confounding factors.Acknowledgements
Research was performed as part of the Center of Advanced Imaging Innovation and Research (CAI2R, www.cai2r.net), an NIBIB Biomedical Technology Resource Center (NIH P41 EB-017183) and was partially supported by the NINDS of the NIH (R01 NS088040). ER is a postdoctoral fellow supported by NICHD of the NIH (1F32HD103313-01). NW received funding from the European Research Council under the European Union's Seventh Framework Programme (FP7/2007-2013) / ERC grant agreement No 616905; from the European Union's Horizon 2020 research and innovation programme under the grant agreement No 681094; from the BMBF(01EW1711A & B) in the framework of ERA-NET NEURON. The Max Planck Institute for Human Cognitive and Brain Sciences has an institutional research agreement with Siemens Healthcare. NW was a speaker at an event organized by Siemens Healthcare and was reimbursed for the travel expenses. DKJ is supported by a Wellcome Trust Investigator Award (096646/Z/11/Z) and a Wellcome Trust Strategic Award (104943/Z/14/Z). The Connectom data were in part acquired at the UK National Facility for in vivo MR Imaging of Human Tissue Microstructure funded by the EPSRC (grant EP/M029778/1), and The Wolfson Foundation. We would like to thank Thomas Witzel for providing the Blipped-CAIPI SMS sequence to CUBRIC and MPI-CBS, and John Evans for his support of the MR Lab at CUBRIC.References
[1] Waxman SG. Determinants of conduction velocity in myelinated nerve fibers. Muscle & Nerve: Official Journal of the American Association of Electrodiagnostic Medicine. 1980; 3(2):141–150.
[2] Wegiel J, Kaczmarski W, Flory M, Martinez-Cerdeno V, Wisniewski T, Nowicki K, Kuchna I, Wegiel J. Deficit of corpus callosum axons, reduced axon diameter and decreased area are markers of abnormal development of interhemispheric connections in autistic subjects. Acta neuropathologica communications. 2018; 6(1):143
[3] Jones DK. Diffusion MRI: Theory, methods and applications. Oxford University Press; 2010.[4] McNab JA, Edlow BL, Witzel T, Huang SY, Bhat H, Heberlein K, Feiweier T, Liu K, Keil B, Cohen-Adad J, et al. The Human Connectome Project and beyond: initial applications of 300mT/m gradients. Neuroimage. 2013; 80:234–245.
[5] Veraart J, Fieremans E, Novikov DS. On the scaling behavior of water diffusion in human brain white matter. NeuroImage. 2019; 185:379–387.
[6] Burcaw LM, Fieremans E, Novikov DS. Mesoscopic structure of neuronal tracts from time-dependent diffusion. NeuroImage. 2015; 114:18–37.
[7] Olivares R, Montiel J, Aboitiz F. Species differences and similarities in the fine structure of the mammalian corpus callosum. Brain, behavior and evolution. 2001; 57(2):98–105.
[8] van Gelderen P, DesPres D, van Zijl, P, Moonen C. Evaluation of restricted diffusion in cylinders. phosphocreatine in rabbit leg muscle. Journal of Magnetic Resonance, Series B 1994;103 (3), 255–260.
[9] Neuman C. Spin echo of spins diffusing in a bounded medium. The Journal of Chemical Physics 1974; 60 (11), 4508–4511.
[10] Wasserthal J, Neher P, Maier-Hein KH. TractSeg-Fast and accuratewhite matter tract segmentation. NeuroImage 2018; 183, 239–253
[11] Yeatman JD, Wandell BA, Mezer AA. Lifespan maturation and degeneration of human brain white matter. Nature communications 2014;5 (1),1–12
[12] Altman DG, Bland JM Measurement in medicine: the analysis of method comparison studies. The Statistician. 1983, 32 (3): 307–317
[13] Liewald D, Miller R, Logothetis N, Wagner HJ, Schuz A. . Distribution of axon diameters in cortical white matter: an electron-microscopic study on three human brains and a macaque. Biological cybernetics 2014; 108 (5),541–557
[14] Aboitiz F, Scheibel AB, Fisher RS, Zaidel E. Fiber composition of the human corpus callosum. Brain research 1992; 598 (1), 143–153.
[15] Tomasi S, Caminiti R, Innocenti GM. Areal differences in diameter and length of corticofugal projections. Cerebral Cortex 2012; 22 (6), 1463–1472.
Figures