0498
On the variability of single-point MPF mapping in the human brain using different Variable Flip Angle T1 mapping protocols1Aix Marseille Univ, CNRS, CRMBM, Marseille, France, 2APHM, Hôpital Universitaire Timone, CEMEREM, Marseille, France, 3Siemens Healthcare SAS, Saint-Denis, France
Synopsis
Fast macromolecular proton fraction (MPF) mapping based on single-point (SP) quantitative MT method has shown great promises for the evaluation of myelin-related studies while allowing for acceptable scan times. The SP method requires a T1 map, which is inherently biased by magnetization transfer effects. In this work, we investigate the effect of T1 maps derived from different Variable Flip Angle (VFA) protocols on the computed MPF maps. It is shown that VFA-T1 is highly variable because of MT effects, hence biasing SP-MPF maps values. The SP-MPF methodology should therefore consider MT effects in VFA-T1 estimation, especially for cross-vendor applications.
Introduction
Fast macromolecular proton fraction mapping (MPF)1-3 derived from the two-pool model of quantitative magnetization transfer (qMT)4 imaging achieved with a single point (SP) method has shown great promises for the evaluation of myelin-related disorders5,6 and brain development7. The SP-qMT method allows for an accelerated protocol comprising B1 and water proton T1 mappings, along with a couple of MT-weighted and non-saturated images, making an MPF protocol acceptable in terms of scan time in neuro-applications.Whereas B1 mapping methods are nowadays accessible in clinical routine, MPF computation also requires a T1 map as a prerequisite, for which several methods are available. Originally, the Variable Flip Angle (VFA) method was considered because of its efficiency for fast spatial coverage and wide availability. However, MT effects (due to on-resonance saturation of the macromolecular pool and cross-relaxation) have recently been shown to significantly bias the T1 values in healthy tissues with such sequence8. In this work, we aim at comparing the T1 and corresponding MPF values in the adult human white matter (WM) using different VFA-T1 mapping protocols.
Methods
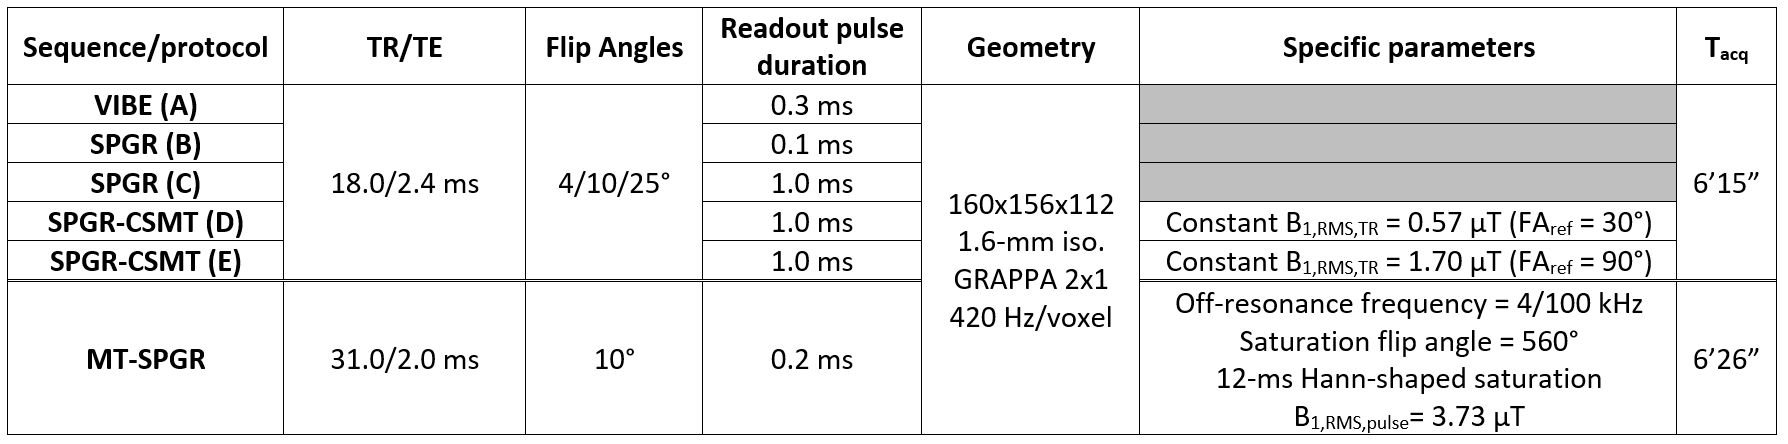
Experiments were performed on one healthy volunteer on a 3T clinical system (Vida, Siemens Healthineers, Erlangen, Germany) with body coil transmission and a 32-channel receive head coil. The protocol included a 3D anatomical sequence (MPRAGE) as well as a B1+ mapping sequence (pre-saturated turbo FLASH).Different T1 mapping protocols based on non-selective 3D sagittal spoiled gradient-echo (SPGR) were investigated (Table 1): (A) the product VIBE sequence (providing inline B1-corrected T1 mapping reconstruction), (B) the product SPGR sequence, (C) a custom SPGR sequence allowing for modulation of the readout pulse duration, (D,E) a custom SPGR sequence with Controlled Saturation Magnetization Transfer (CSMT) pulses (Hann-shaped, Δf = 6 kHz, controlled by a reference FA; FAref)9. These five T1 mapping methods were evaluated and subsequently used as prior for SP-MPF mapping. Two additional MT-prepared and reference volumes used for SP-MPF computation were acquired as described in Table 1.
All T1 mapping protocols were simulated with their respective sequence parameters with an Extended Phase Graph10 framework including diffusion11 and on-resonance MT effects12 to evaluate whether the investigated method tends to under- or overestimate T1 values. The following parameters were considered: T1=1/R1f=1/R1b=1000 ms, R=19 s-1, T2b=10 µs, MPF=15%, T2f=70 ms, TR=18 ms, RF spoiling phase increment of 50°, gradient spoiler moment Gτ=16 mT/m.ms and diffusion coefficient D=0.8 µm²/ms.
T1 maps and output simulated signals were estimated following the VFA model14, and SP-MPF using Yarnykh’s model1, with R1fT2f=0.022, R=19 s-1, T2b=10 µs and R1f=R1b=1/T12. All reconstructions were B1-corrected3.
A paired anatomical MPRAGE image was non-linearly registered in the MNI space to retrieve WM masks from the JHU probabilistic atlas13, and to assess T1 and MPF values in selected regions. Univariate ANOVA analyses were performed to assess inter-protocol differences for both T1 and MPF (significance for p<0.05, corrected for multiple comparisons).
Results
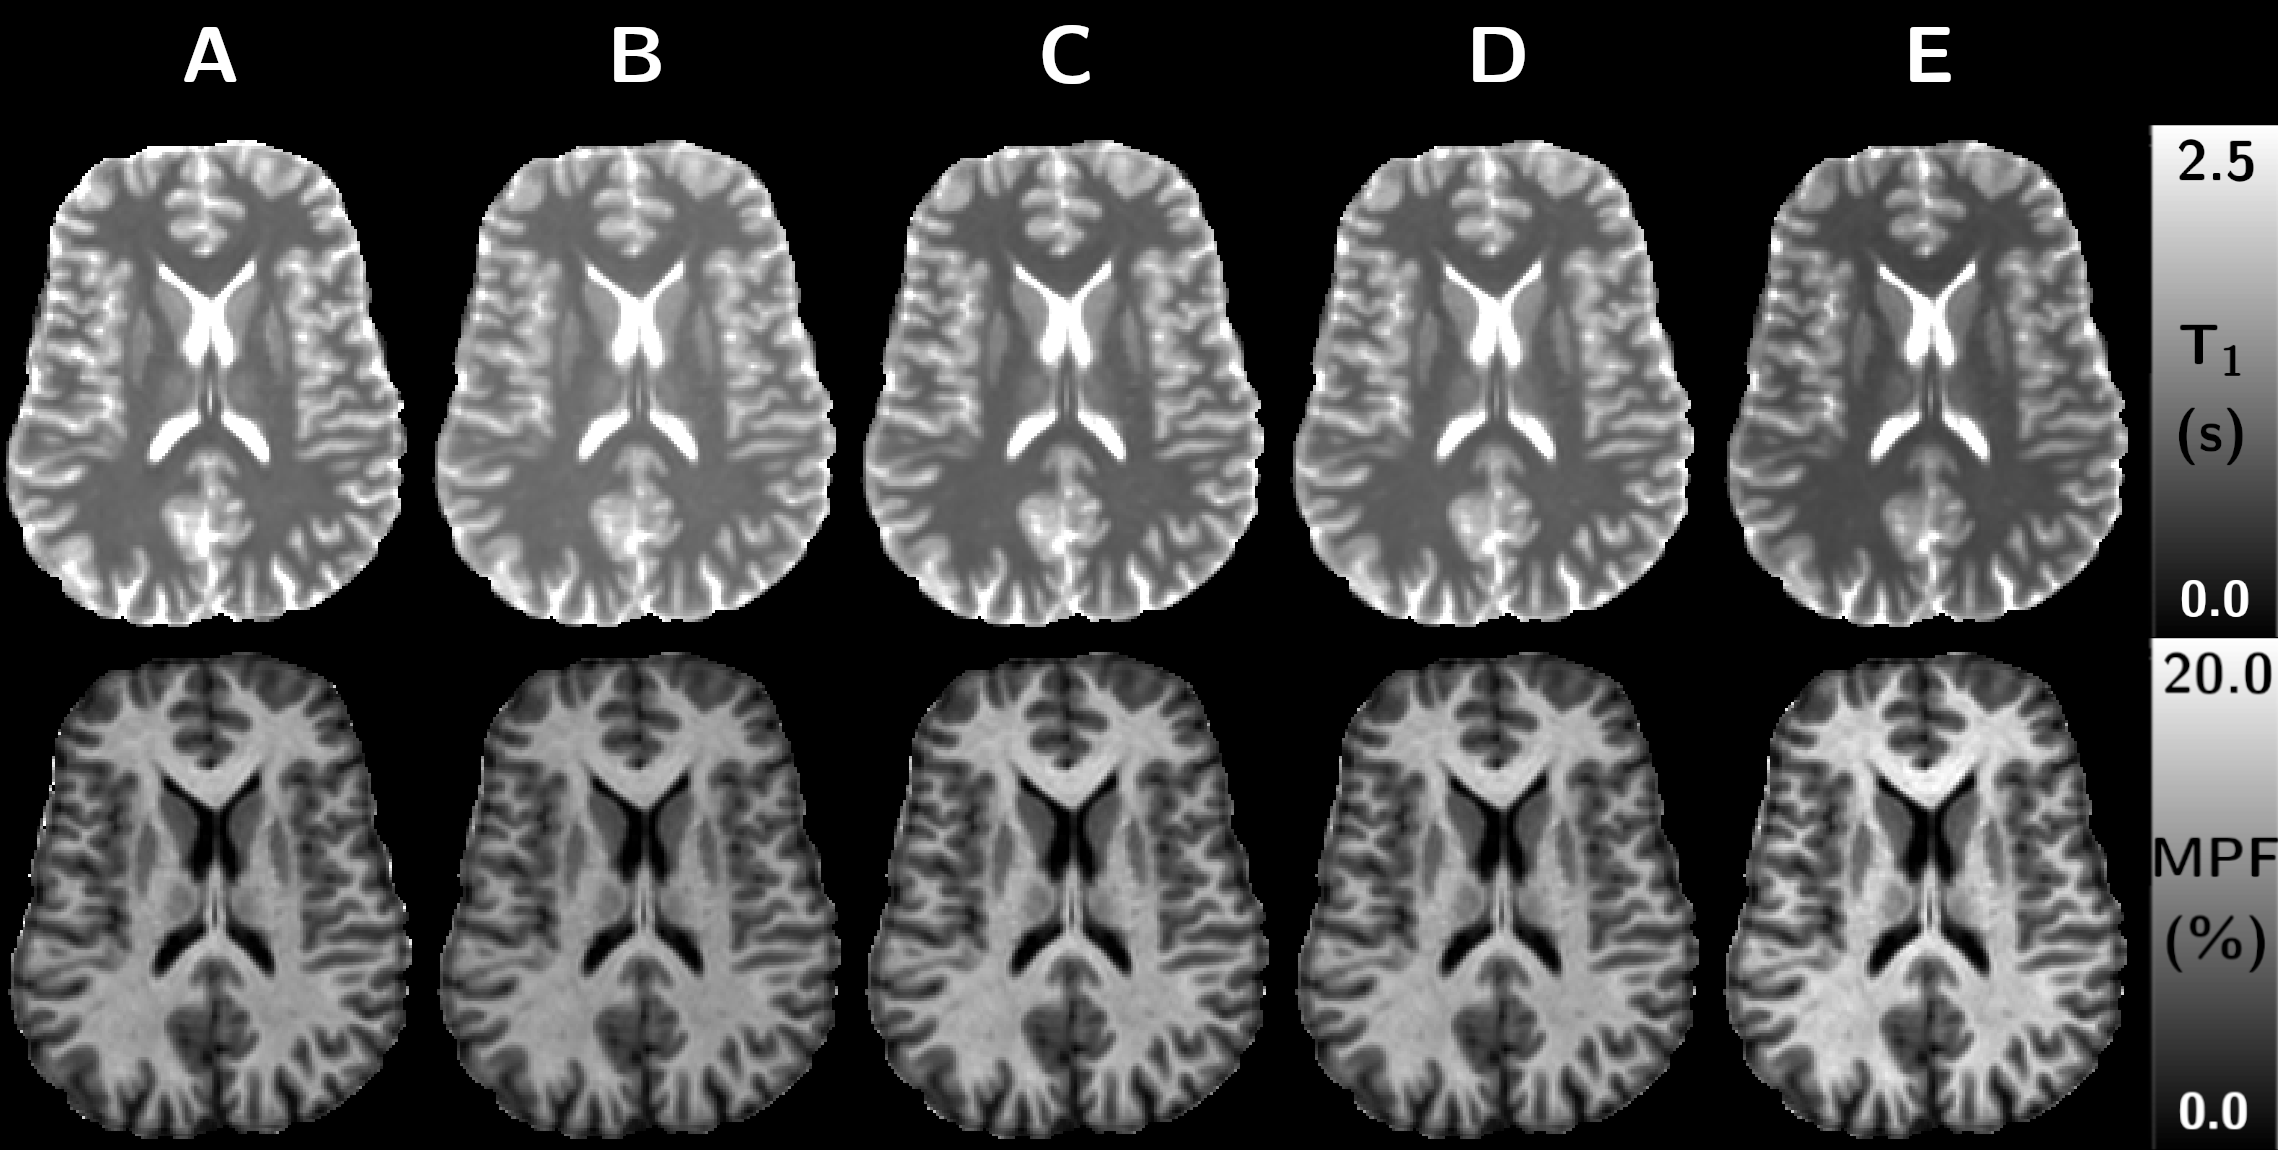
Figure 1a shows simulations of the bias (ΔT1) between simulated and estimated T1 as a function of the readout pulse width. When no MT effects are included, the only bias is due to imperfect spoiling conditions (orange vs. yellow curves). Accounting for MT effects, such as obtained in realistic conditions, the SPGR presents a behavior with a transition from a T1 over-estimating regime (PW<0.14 ms) to an under-estimating one (PW>0.14 ms) due to varying MT saturation across flip angle experiments. CSMT pulses expectedly yielded under-estimated T1 values as a constant and controlled MT saturation effect is applied; the absolute ΔT1 nonetheless decreases as the pulse duration increases since the constant pulse B1,RMS decreases.Figure 2 shows T1 and MPF maps from a representative brain slice, and Figure 3 shows barplots of T1 and MPF values estimated in WM structures, depicting the variability of estimated T1 from the various MT effects, as well as a dependency of subsequently derived MPF maps. Significant differences were obtained between each protocol for T1, except between protocols C and D. For MPF, differences were not significant between protocols A and B and C, as well as between C and D.
Discussion and conclusion
We have shown that SP-MPF estimation varies with the input T1 map, acquired in the current study from different VFA-based protocols. In addition, the T1-VFA model is itself inherently biased by MT effects (induced by on-resonance saturation of the macromolecular pool) in dedicated implementations. This makes the T1 estimation rather variable, with additional degrees of freedom related to the sequence TR and pulse characteristics impacting MT effect rates. Given the high correlation between T1 and MPF (the lower the T1, the higher the MPF5), T1 should be jointly estimated from both VFA and qMT protocols by considering all MT effects. It is especially important for the SP-qMT methodology in which the output MPF map accuracy and reproducibility depend on the T1 prerequisite. Most importantly, cross-vendor applications should consider these aspects as SPGR sequence implementations may differ (e.g., on-resonance pulse duration).Further investigations will consist in jointly estimating T1 and SP-MPF while correcting for cross-relaxation and on-resonance saturation, and including other T1 mapping methods (e.g., MP2RAGE15).
Acknowledgements
This work was supported by the SATT Sud-Est (France), and the French National Research Agency, ANR [ANR‐17‐CE18‐0030].References
1. Yarnykh VL. Fast macromolecular proton fraction mapping from a single off-resonance magnetization transfer measurement. Magn. Reson. Med. 2012;68:166–178 doi: 10.1002/mrm.23224 SMASH.
2. Yarnykh VL. Time-efficient, high-resolution, whole brain three-dimensional macromolecular proton fraction mapping. Magn. Reson. Med. 2016;75:2100–2106 doi: 10.1002/mrm.25811 SMASH.
3. Yarnykh VL, Kisel AA, Khodanovich MY. Scan–Rescan Repeatability and Impact of B0 and B1 Field Nonuniformity Corrections in Single‐Point Whole‐Brain Macromolecular Proton Fraction Mapping. J. Magn. Reson. Imaging 2020;51:1789–1798 doi: 10.1002/jmri.26998 SMASH.
4. Henkelman RM, Huang X, Xiang Q-S, Stanisz GJ, Swanson SD, Bronskill MJ. Quantitative interpretation of magnetization transfer. Magn. Reson. Med. 1993;29:759–766 doi: 10.1002/mrm.1910290607 SMASH.
5. Yarnykh VL, Bowen JD, Samsonov A, et al. Fast Whole-Brain Three-dimensional Macromolecular Proton Fraction Mapping in Multiple Sclerosis. Radiology 2015;274:210–220 doi: 10.1148/radiol.14140528 SMASH.
6. Soustelle L, Antal MC, Lamy J, Harsan L, Loureiro de Sousa P. Determination of optimal parameters for 3D single‐point macromolecular proton fraction mapping at 7T in healthy and demyelinated mouse brain. Magn. Reson. Med. 2021;85:369–379 doi: 10.1002/mrm.28397 SMASH.
7. Yarnykh VL, Prihod’ko IY, Savelov AA, Korostyshevskaya AM. Quantitative Assessment of Normal Fetal Brain Myelination Using Fast Macromolecular Proton Fraction Mapping. Am. J. Neuroradiol. 2018;39:1341–1348 doi: 10.3174/ajnr.A5668 SMASH.
8. A. G. Teixeira RP, Neji R, Wood TC, Baburamani AA, Malik SJ, Hajnal J V. Controlled saturation magnetization transfer for reproducible multivendor variable flip angle T1 and T2 mapping. Magn. Reson. Med. 2020;84:221–236 doi: 10.1002/mrm.28109 SMASH.
9. A.G. Teixeira RP, Malik SJ, Hajnal J V. Fast quantitative MRI using controlled saturation magnetization transfer. Magn. Reson. Med. 2019;81:907–920 doi: 10.1002/mrm.27442 SMASH.
10. Weigel M. Extended phase graphs: Dephasing, RF pulses, and echoes - pure and simple. J. Magn. Reson. Imaging 2015;41:266–295 doi: 10.1002/jmri.24619 SMASH.
11. Weigel M, Schwenk S, Kiselev VG, Scheffler K, Hennig J. Extended phase graphs with anisotropic diffusion. J. Magn. Reson. 2010;205:276–285 doi: 10.1016/j.jmr.2010.05.011 SMASH.
12. Malik SJ, Teixeira RPAG, Hajnal J V. Extended phase graph formalism for systems with magnetization transfer and exchange. Magn. Reson. Med. 2018;80:767–779 doi: 10.1002/mrm.27040 SMASH.
13. Wakana S, Caprihan A, Panzenboeck MM, et al. Reproducibility of quantitative tractography methods applied to cerebral white matter. Neuroimage 2007;36:630–644 doi: 10.1016/j.neuroimage.2007.02.049 SMASH.
14. Chang L-C, Koay CG, Basser PJ, Pierpaoli C. Linear least-squares method for unbiased estimation of T1 from SPGR signals. Magn. Reson. Med. 2008;60:496–501 doi: 10.1002/mrm.21669 SMASH.
15. Marques JP, Kober T, Krueger G, van der Zwaag W, Van de Moortele P-F, Gruetter R. MP2RAGE, a self bias-field corrected sequence for improved segmentation and T1-mapping at high field. Neuroimage 2010;49:1271–1281 doi: 10.1016/j.neuroimage.2009.10.002 SMASH.
Figures