0496
Inhomogeneous Magnetization Transfer (ihMT): theoretical characterization of T1D-filtering and experimental validation1Aix Marseille Univ, CNRS, CRMBM, Marseille, France, 2APHM, Hôpital Universitaire Timone, CEMEREM, Marseille, France, 3Aix Marseille Univ, CNRS, IBDM, Marseille, France, 4Aix Marseille Univ, CNRS, ICR, Marseille, France, 5Division of MR Research, Radiology, Beth Israel Deaconess Medical Center, Harvard Medical School, Boston, MA, United States
Synopsis
Inhomogeneous magnetization transfer (ihMT) signal originates from the residual dipolar interactions and is weighted by the associated dipolar relaxation time T1D. The resulting signal can be modulated by filtering the contribution of short T1D components to emphasize the contrast between different structures, or to enhance the specificity for myelin imaging. In this study, the dependency of ihMTR to T1D is investigated theoretically for different T1D-filtering strengths. Experimental WM/GM relative contrasts for the same configurations are put in perspective with theoretical contrasts resulted from single-T1D and bi-T1D biophysical model simulations.
Introduction
The ihMT signal depends on the dipolar order relaxation time (T1D)1 and can be modulated by filtering the signal of short T1D components2 (e.g. < 1 ms) so as to increase the contrast between various structures.Our main objective was to establish a general understanding of the response of the ihMTR signal to different filtering strengths. Single- and bi-T1D biophysical models were used to derive the theoretical ihMT signal as a function of T1D, for 4 different filters. Experimental White Matter/Grey Matter (WM/GM) relative contrast measurements were compared with simulated contrasts. This allowed us to confirm the bi-T1D theoretical model as a suitable model to describe the increase in WM/GM relative contrast with increasing filtering strengths.
Methods
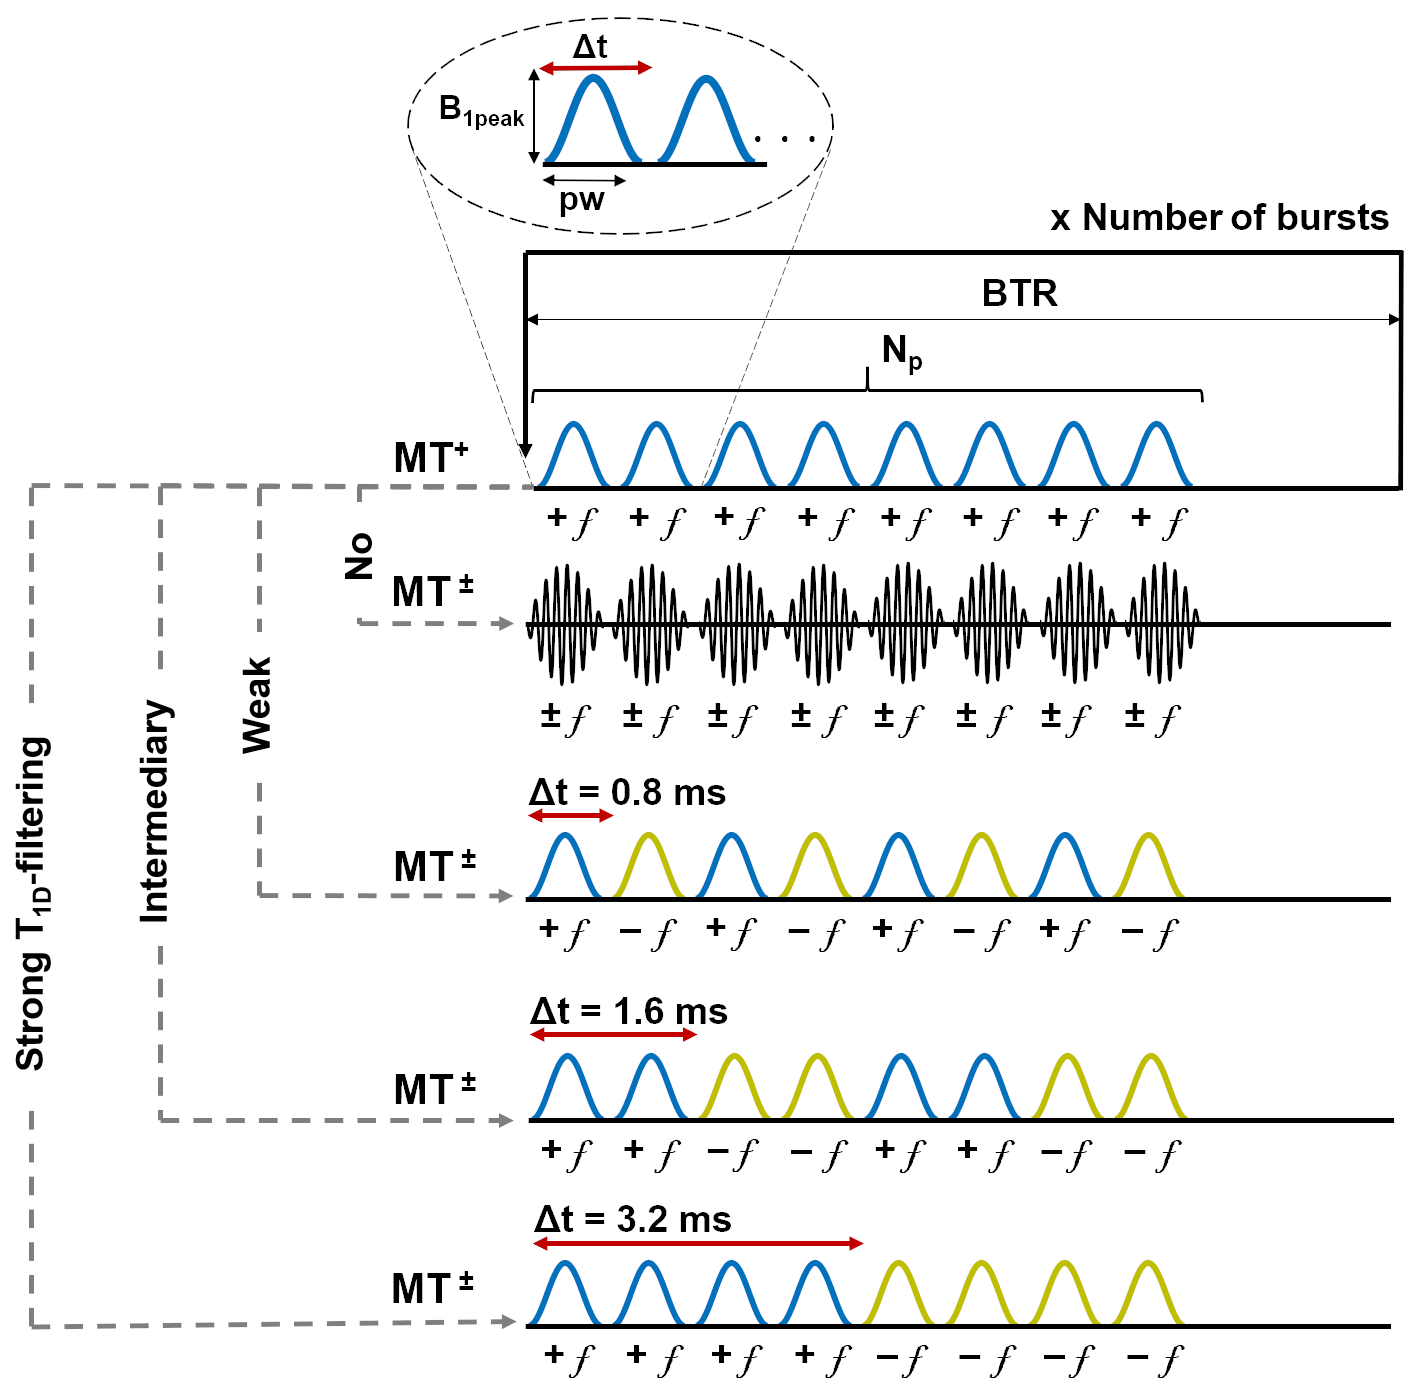
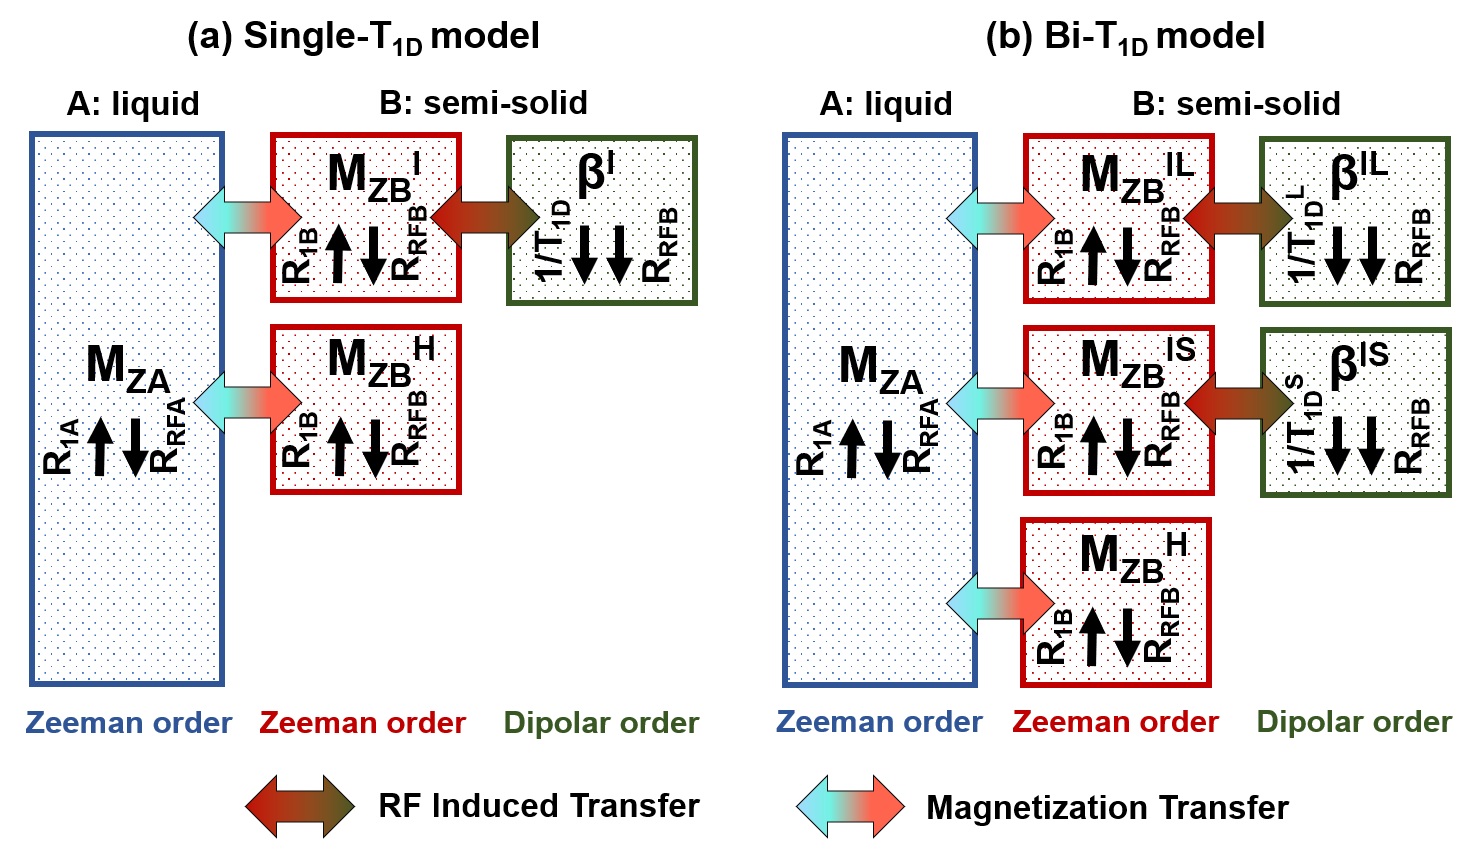
MRI experiments were performed on a preclinical 7T Bruker scanner. Sixteen control mice C57Bl/6J were scanned with a 3D ihMT-RAGE3 sequence (TR/TE = 2200/2.1 ms, 100x100x750 µm3 resolution) and a protocol including 4 ihMT configurations with different T1D-filterings (Figure 1): the single-frequency (MT+) saturation is identical for all filters, whereas for the dual-frequency (MT±) saturation, the Δt switching time between pulses at alternated frequency was increased (Δt = 0.8 ms; 1.6 ms; 3.2 ms) to strengthen the filtering toward higher T1D values. Zero T1D-filtering was obtained using dual-band cosine-modulated (CM) pulses, which allow irradiation at both positive and negative frequencies simultaneously. The use of this modified-ihMT approach4 granted an increase in Δt values while keeping RF pulses parametrization constant across all configurations.The theoretical dependency of ihMTR with respect to T1D was calculated according to the formula $$$\text{ihMTR} = 2\times\frac{\text{MT}^{+}-\text{MT}^{\pm}}{\text{M}_{0}}$$$, where the magnetization of the distinct compartments was simulated according to the Bloch-McConnell-Provotorov equations solved in the matrix formalism5. The biophysical models associated with the theory of ihMT, encompassing single- or bi-T1D component(s) are depicted in Figure 2. The single-T1D model was simulated over a large range of T1D values [10 µs; 20 ms]. The bi-T1D model was simulated by fixing the long T1D component at 6.0 ms for WM4 and 5.8 ms for GM4 and varying the short T1D components in the [10 µs; 1 ms] range5. The total pool size ratios for WM and GM were fixed at 10% and 3.5%, respectively6, and were distributed among the homogeneous (T1D=0) and inhomogeneous (T1D≠0) compartments. Other MT parameters, such as relaxation and exchange rates were fixed to values reported in the literature6.
Results
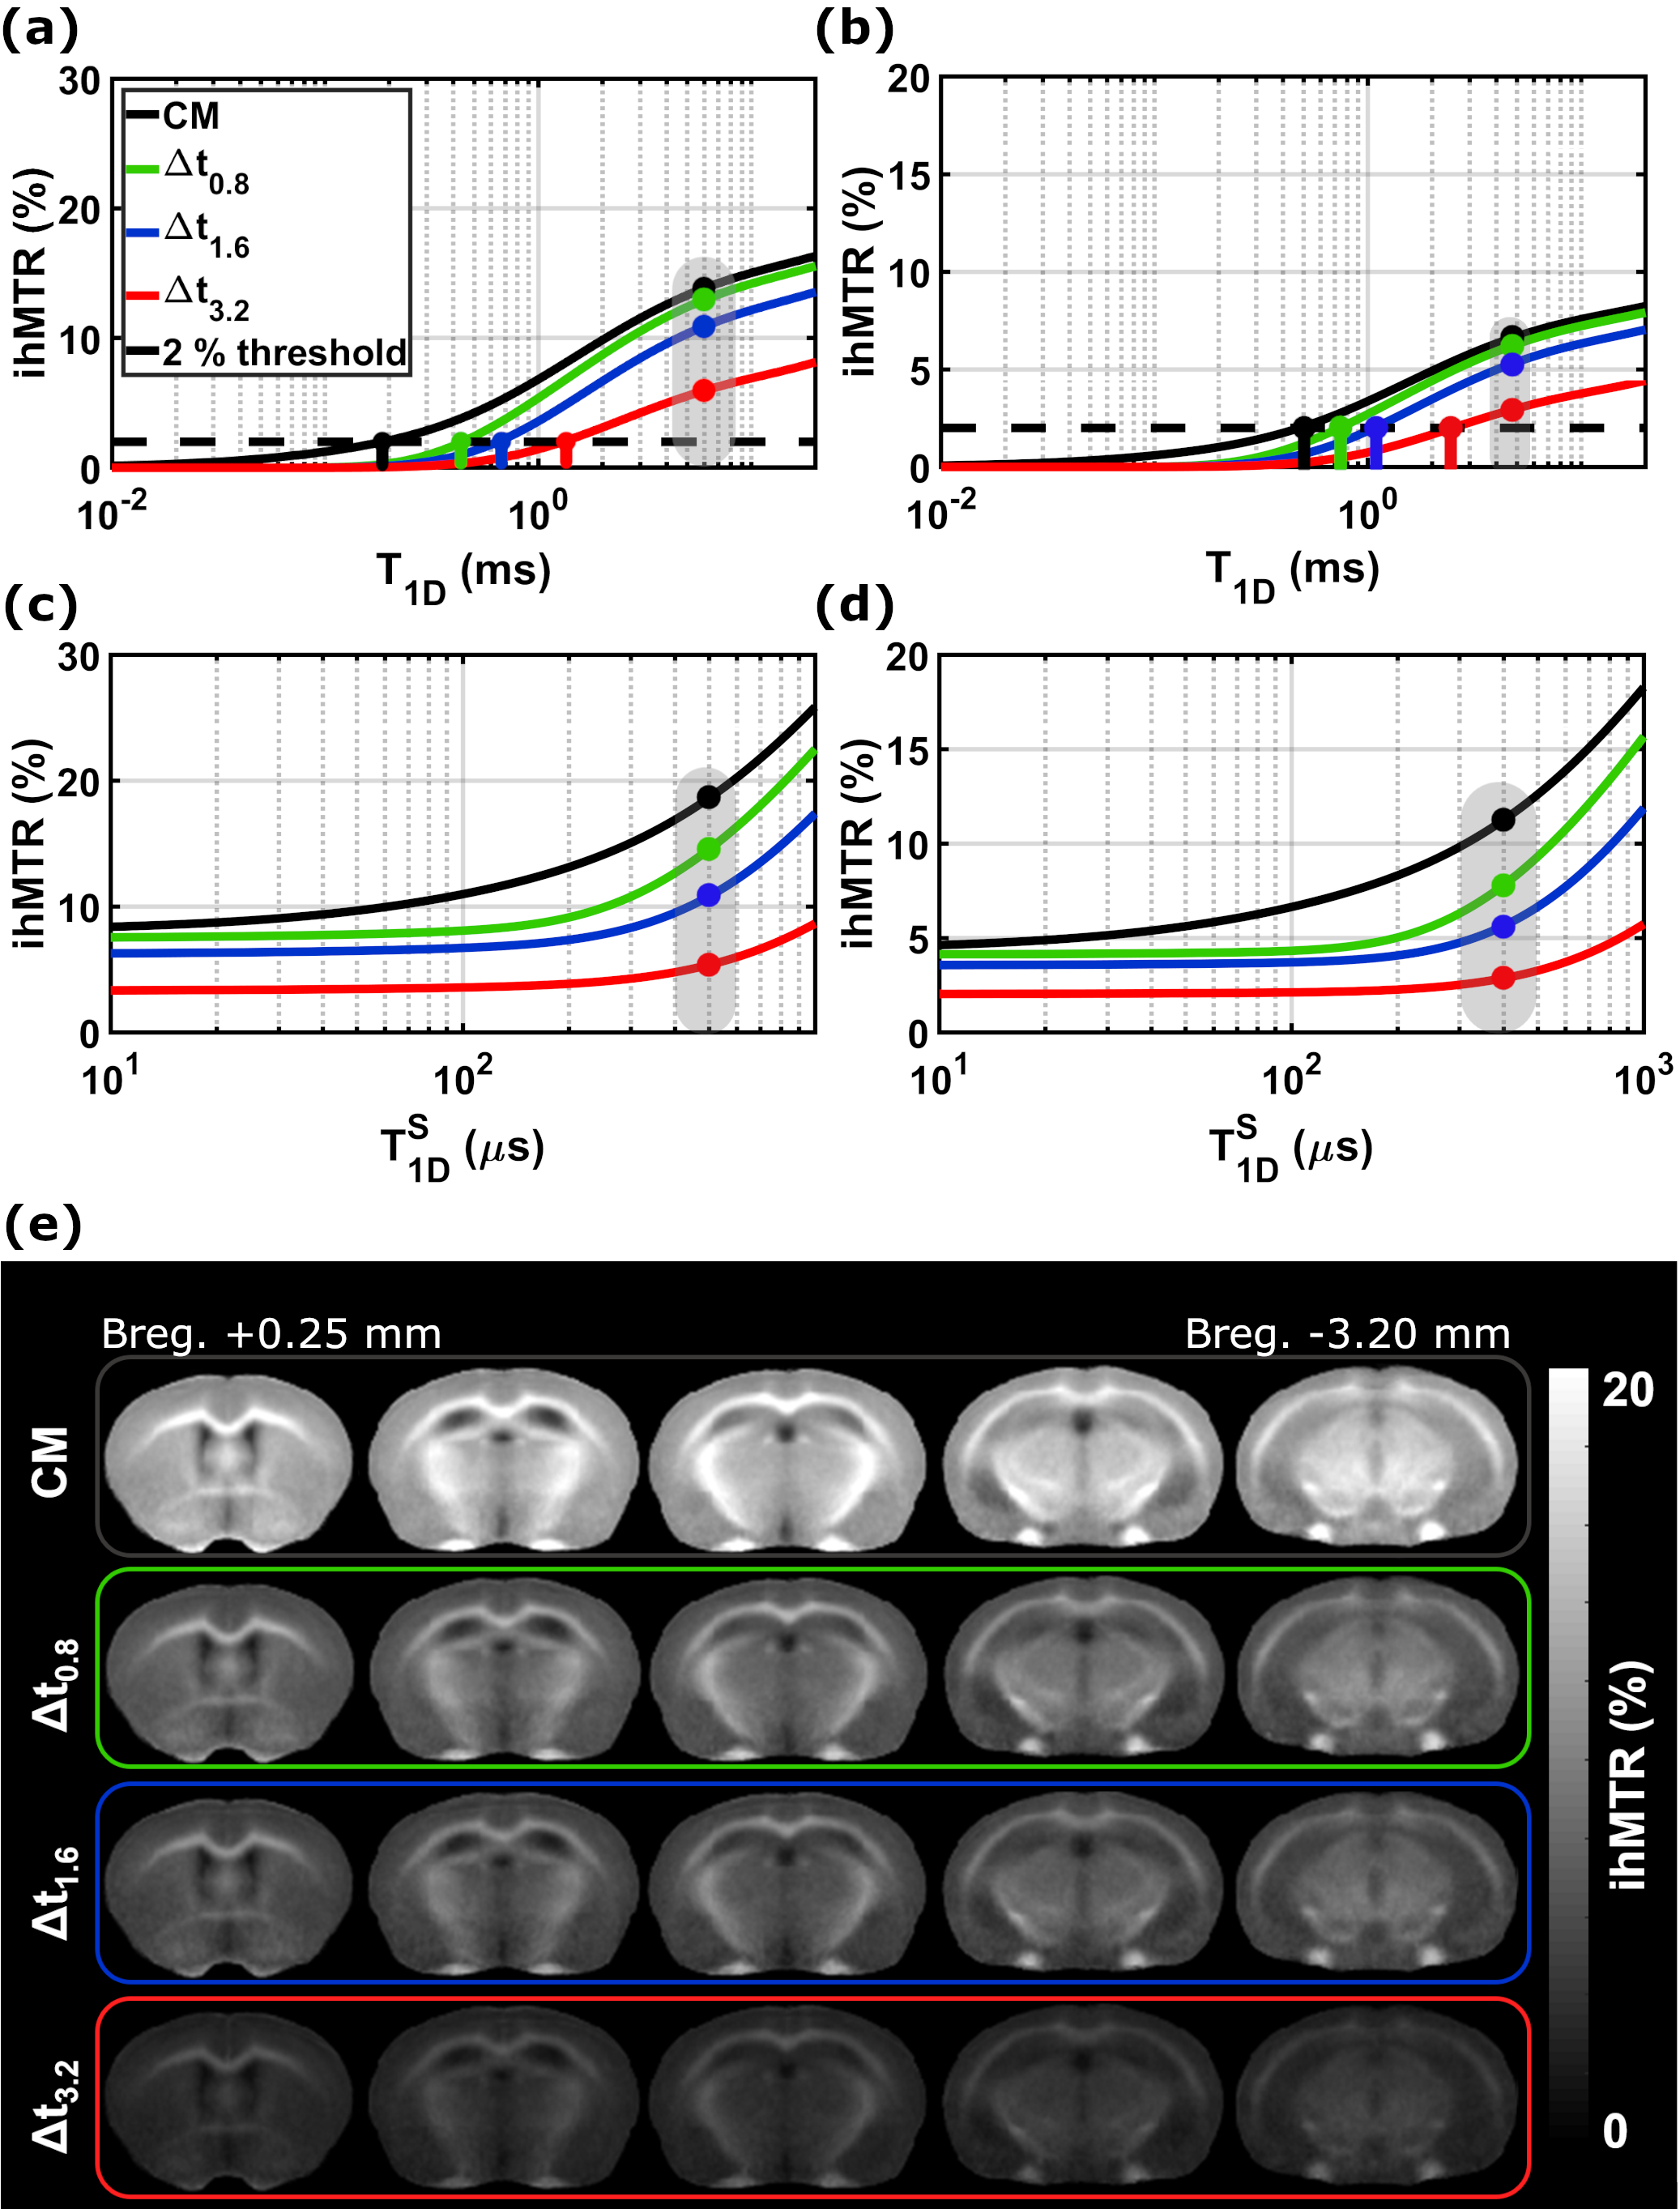
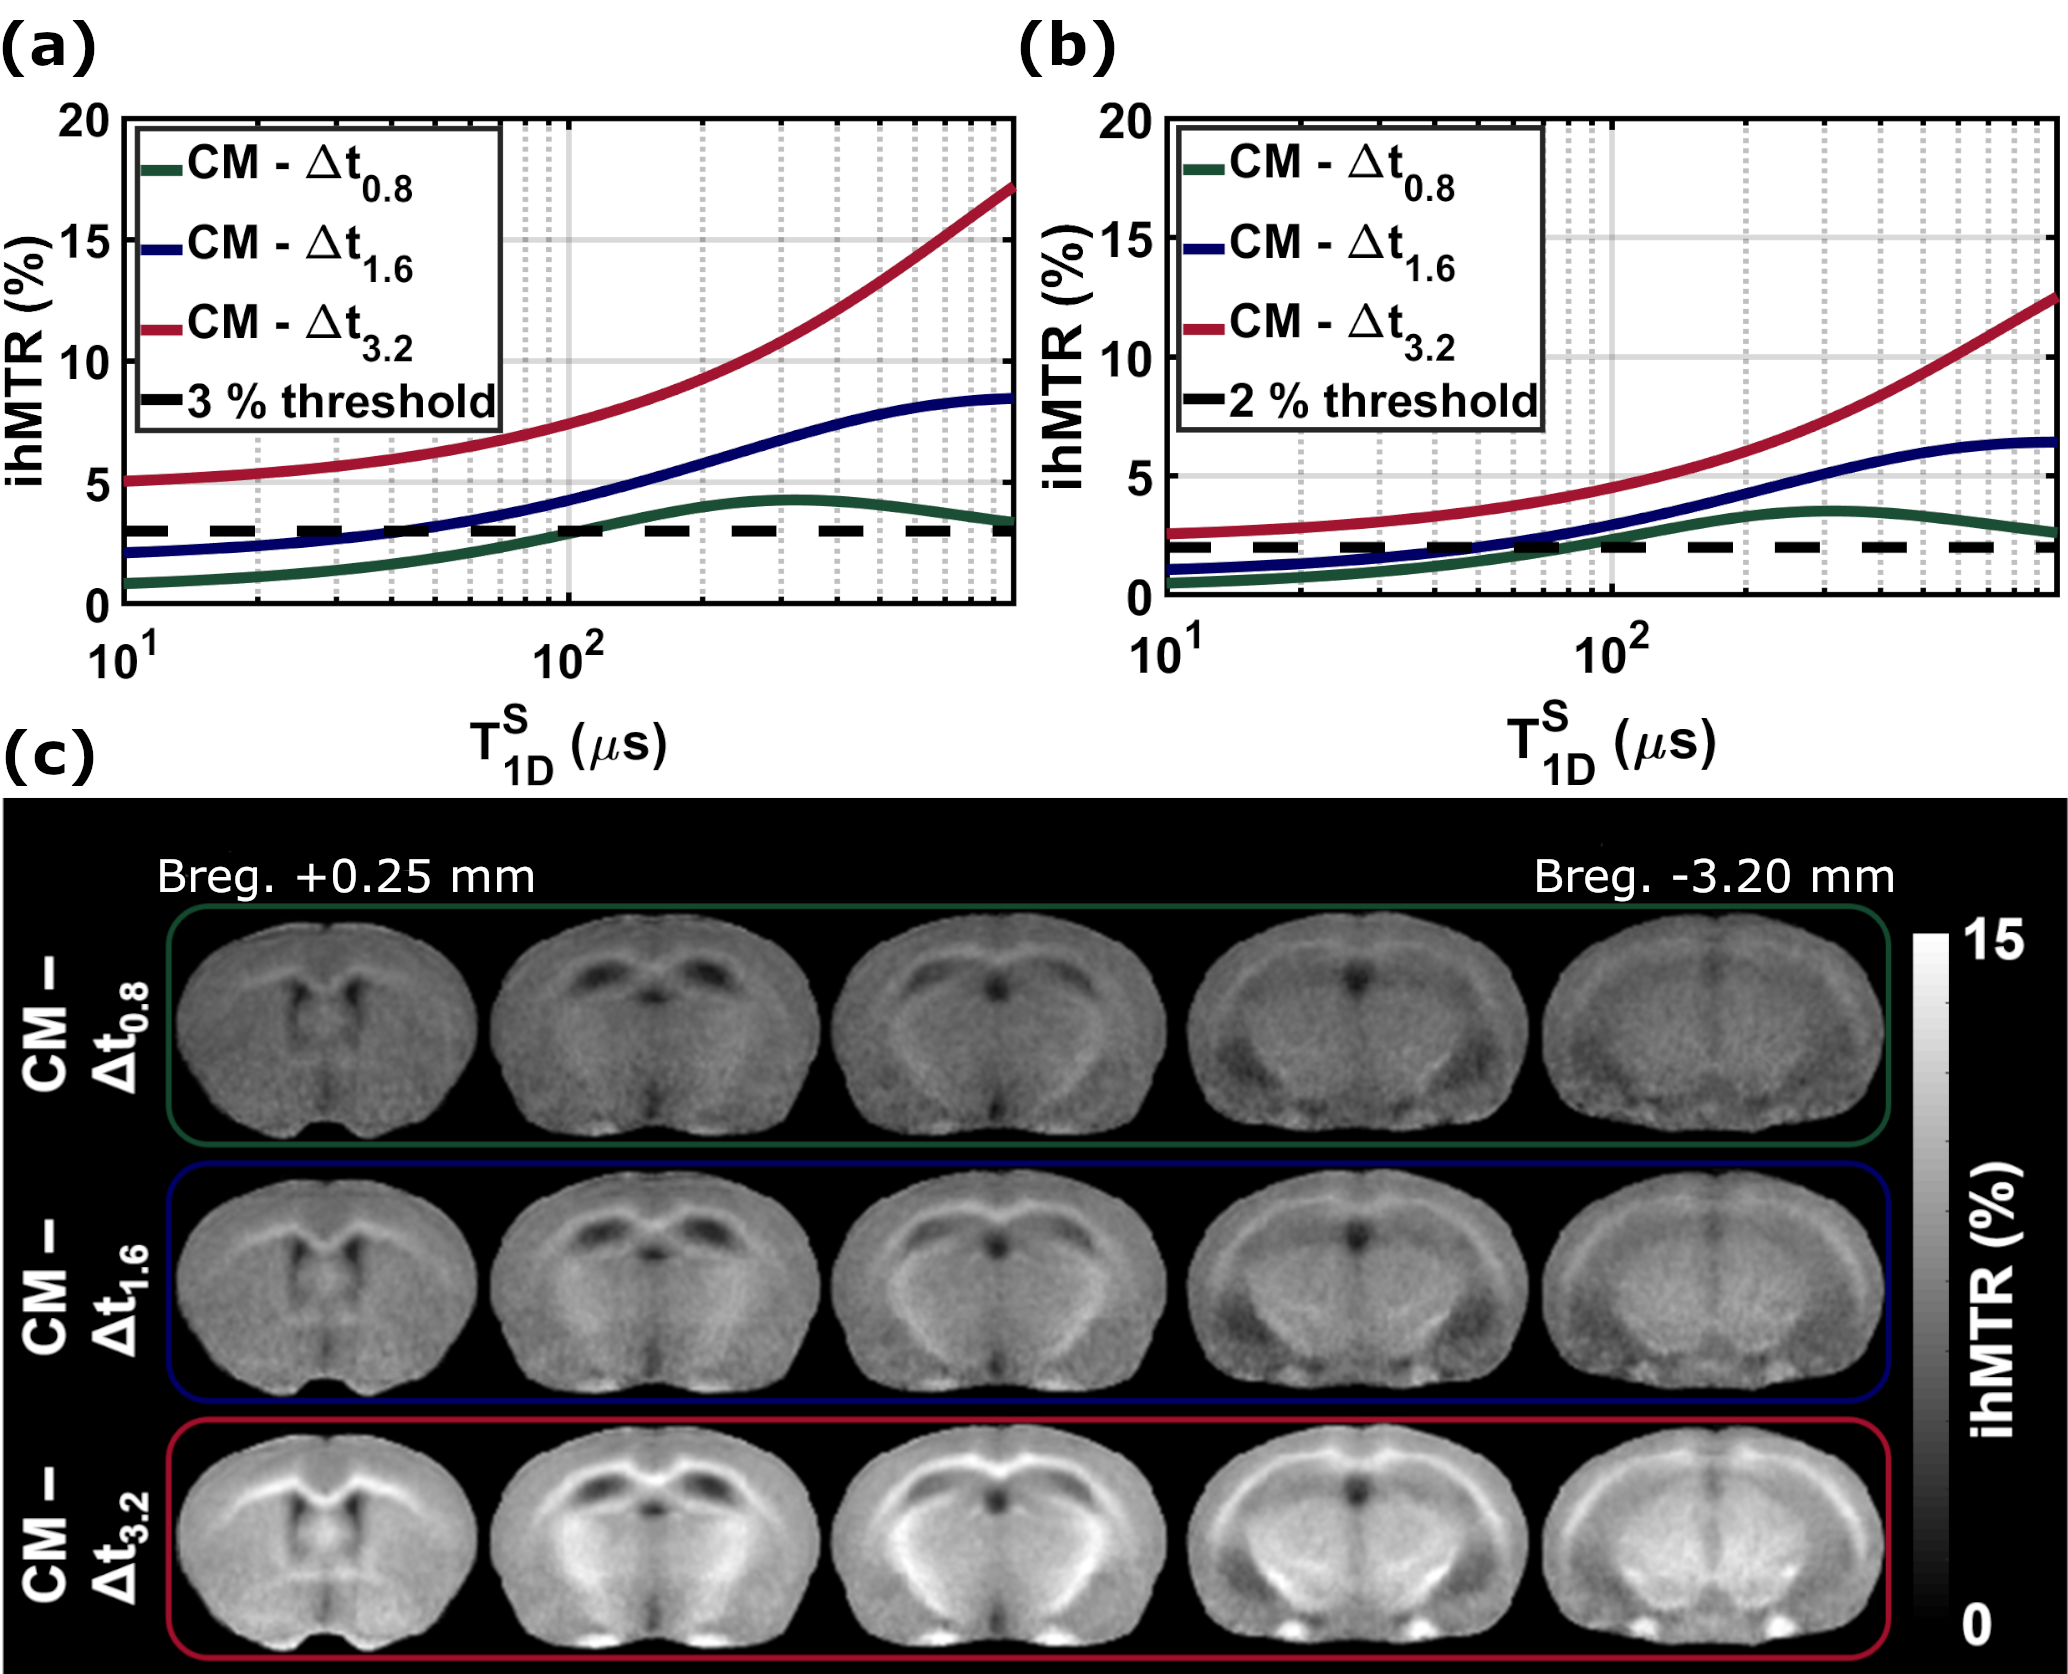
Single-T1D model (Figure 3a, b): The sensitivity threshold (arbitrarily fixed at 2%) was reached in WM (resp. GM) for higher T1D values as Δt increased. CM was sensitive to T1Ds > 0.19 ms (resp. 0.49 ms), Δt0.8 to T1Ds > 0.44 ms (resp. 0.75 ms), Δt1.6 to T1Ds > 0.64 ms (resp. 1.97 ms) and Δt3.2 to T1Ds > 1.30 ms (resp. 2.54 ms). Long T1D components were also attenuated with increasing Δt. For T1D = 6.0 ms, an attenuation of 6%, 21% and 57% was observed for Δt0.8, Δt1.6 and Δt3.2 respectively, relative to the non-filtered CM signal.Bi-T1D model (Figure 3c, d): By increasing Δt, ihMTR decreases and the threshold beyond which ihMTR increases considerably with T1D is shifted toward higher T1D values (e.g., 70 μs for Δt0.8 and 130 μs for Δt3.2). A differential in ihMTR values between CM and Δt0.8 configurations was obtained for T1Ds in the [100 µs; 1 ms] range (Figure 4a, b, green curve), whereas outside this range, the two configurations show a clear tendency for converging ihMTR values. Consequently, the ihMTR signal built upon the difference between these two configurations results in a bandpass shape (albeit associated with reduced sensitivity) and may represent the means to isolate the ihMTR signal of short T1D components.
Experiments: Representative slices of the 3D ihMTR images for the four different filters and the difference images obtained by subtraction between the non-filtered and filtered configurations are displayed in Figures 3e and 4c along with the simulated curves to illustrate the obtained contrasts.
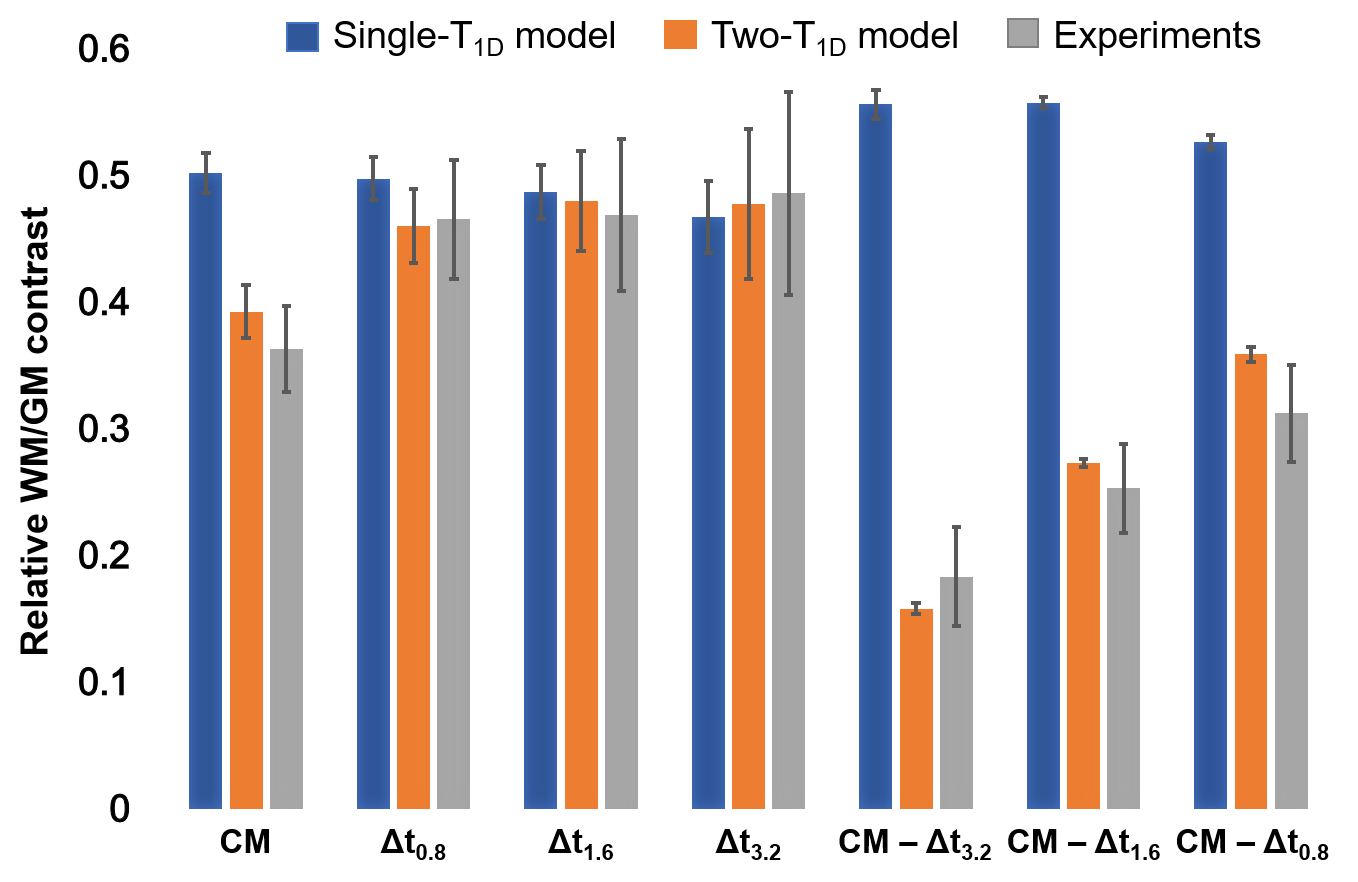
Comparison (Figure 5): Comparison between quantitative theoretical values and experimental data shows that the single-T1D model overestimates the WM/GM relative contrast, while the bi-T1D model provides values compatible with the experimental ones.
Discussion
The single-T1D model provided a general understanding of the ihMT signal response to T1D and demonstrated the efficacy of increasing Δt to attenuate/eliminate the signal associated with short T1D components. The bi-T1D model provided a better description of the WM/GM relative contrast, particularly for the CM configuration which was highly overestimated by the single-T1D model, consistent with a recent publication5 that demonstrated the existence of at least two T1D components in WM and GM tissues.Additionally, the difference between the non-filtered (CM) and the filtered (Δt0.8) configurations proved to be a viable solution for the isolation of a small range of short-T1D components [100 µs; 1 ms]. The WM/GM relative contrast for the range of short T1D components (CM – Δt0.8) was the lowest, whereas the contrast of the most filtered configuration (Δt3.2) was the highest, emphasizing an important difference in the distribution of long T1D components between the two tissues.
Conclusion
A reliable description of the WM/GM relative contrast can be obtained by using a biophysical model which includes at least two distinct T1D components.Acknowledgements
This work was performed by a laboratory member of France Life Imaging network (grant ANR‐17‐ CE18‐0030, VERISMO project).References
1. Varma, G. et al. Interpretation of magnetization transfer from inhomogeneously broadened lines (ihMT) in tissues as a dipolar order effect within motion restricted molecules. J. Magn. Reson. 260, 67–76 (2015).
2. Prevost, V. H. et al. Optimization of inhomogeneous magnetization transfer (ihMT) MRI contrast for preclinical studies using dipolar relaxation time (T1D) filtering. NMR Biomed. 30, e3706 (2017).
3. Varma, G. et al. Three‐dimensional inhomogeneous magnetization transfer with rapid gradient‐echo (3D ihMTRAGE) imaging. Magn. Reson. Med. (2020) doi:10.1002/mrm.28324.
4. Varma, G. et al. In vivo measurement of a new source of contrast, the dipolar relaxation time, T 1 D , using a modified inhomogeneous magnetization transfer (ihMT) sequence: In Vivo Measurement of T 1D Using ihMT. Magn. Reson. Med. 78, 1362–1372 (2017).
5. Carvalho, V. N. D. et al. MRI assessment of multiple dipolar relaxation time ( T 1 D ) components in biological tissues interpreted with a generalized inhomogeneous magnetization transfer (ihMT) model. J. Magn. Reson. 311, 106668 (2020).
6. Varma, G. et al. Low duty-cycle pulsed irradiation reduces magnetization transfer and increases the inhomogeneous magnetization transfer effect. J. Magn. Reson. 296, 60–71 (2018).
Figures