0495
Sensitivity of cortical kurtosis measurement to diffusion time in KINSA modeling assessed with Connectome scanner diffusion MRI1Department of Radiology, Children's Hospital of Philadelphia, Philadelphia, PA, United States, 2Department of Bioengineering, University of Pennsylvania, Philadelphia, PA, United States, 3Department of Radiology, Harvard Medical School, Boston, MA, United States, 4Massachusetts General Hospital, Boston, MA, United States, 5Department of Radiology, University of Pennsylvania, Philadelphia, PA, United States
Synopsis
Unlike diffusion in the white matter which can be well characterized by Gaussian diffusion, substantial non-Gaussian diffusion occur in the cerebral cortical mantle featured by widespread barriers of both somas and neurites. We have developed a non-Gaussian compartmental model Kurtosis-based Imaging of Neurite and Soma Architecture (KINSA) in previous studies. Here, we demonstrate the sensitivity of cortical kurtosis to diffusion time in KINSA modeling with both simulated data and in-vivo dMRI data from Connectome scanner. The mean kurtosis sensitivity to diffusion time allows for precisely delineating neurite and soma architecture such as neuronal density and soma radius.
Purpose
Unlike diffusion in the white matter which can be well characterized by Gaussian diffusion, substantial non-Gaussian diffusion takes place in the cerebral cortical mantle featured by widespread barriers of both somas (cell membranes, organelles) and neurites. Non-Gaussian diffusion can be measured by 4th order diffusion kurtosis. We have developed a non-Gaussian compartmental model Kurtosis-based Imaging of Neurite and Soma Architecture (KINSA) and showed the sensitivity of mean kurtosis (MK) from diffusion kurtosis imaging to cortical microstructure1,2,3. In this study, we estimated the sensitivity of cortical kurtosis measurement to diffusion time in KINSA model with both simulated data and in-vivo data from Connectome scanner. We argue that the sensitivity to diffusion time of MK offers a unique chance to precisely delineate neurite and soma architecture and estimate important microstructural properties such as neuronal density and soma radius in normal and diseased (such as Alzheimer’s) populations.Methods
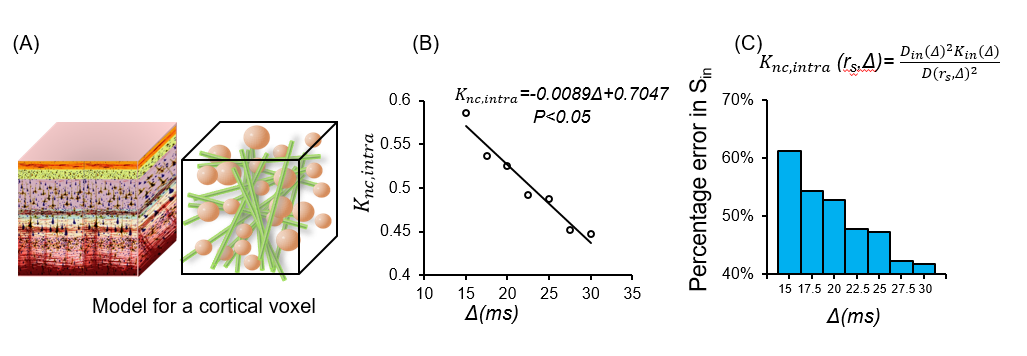
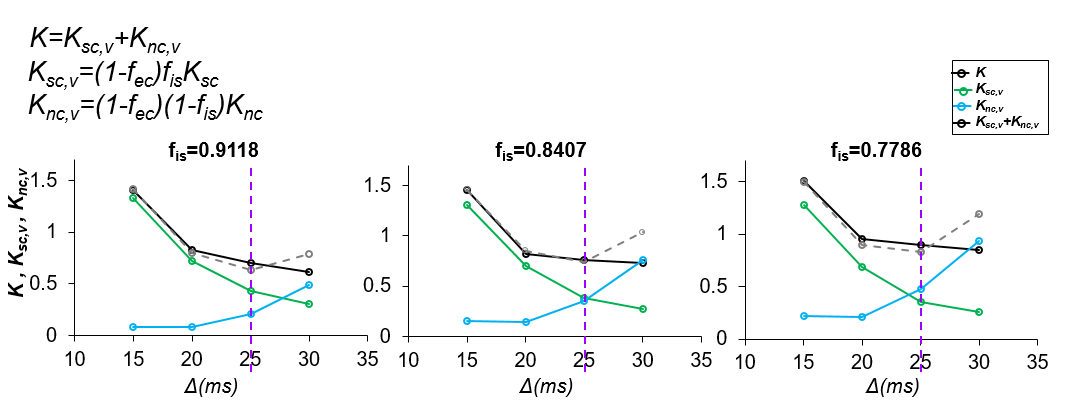
Theory: Diffusion MRI (dMRI) signal model: The signal comes from two restricted compartments, soma and neurite and one Gaussian extracellular compartment: $$S(b,D_{app},K_{app})=(1-f_{ec})(f_{is}S_{is}(b,D_{is,app},K_{is,app})+(1-f_{is})S_{in}(b,D_{in,app},K_{in,app}))+f_{ec}S_{ec}(b,D_{ec,app}) (1)$$ Where fec is the extra-cellular relative signal fraction; fis and fin are the soma and neurite relative signal fractions satisfying the condition fis+fin=1. b is the b-value in dMRI measurements. Sis, Sin are the normalized signals for restricted diffusion within soma and neurites, respectively and Sec is the normalized signal of the extra-cellular space. S is the normalized signal along a gradient direction. Dis,app, Kis,app, Din,app, Kin,app are the apparent diffusivity and kurtosis in soma and neurite compartments respectively. Dec,app is the apparent diffusivity in the extracellular compartment. We assume no exchange between compartments. Based on the definition of diffusivity and kurtosis: $$D(r_s,Δ)=(1-f_{ec})(f_{is}D_{is}(r_s,Δ)+(1-f_{is})D_{in}(Δ))+f_{ec}D_{ec} (2) $$ Where D(rs,Δ) is the total mean diffusivity at diffusion time Δ, Dis(rs,Δ), Din(Δ) are the mean diffusivity inside somas and neurites respectively. rs is the average soma radius in a voxel. Further assuming the total apparent diffusivity Dapp is isotropic: $$K(r_s,Δ)=(1-f_{ec})(f_{is}K_{sc}(r_s,Δ)+(1-f_{is})K_{nc}(r_s,Δ))+f_{ec}K_{ec}(r_s,Δ) (3)$$ Where $$K_{sc}(r_s,Δ)= \frac{(D_{is} (r_s, Δ)^2 K_{is} (r_s,Δ)+3(D_{is} (r_s,Δ)-D(r_s,Δ))^2)}{D(r_s, Δ)^2} (4)$$ $$K_{nc}(r_s,Δ)= \frac{(D_{in} (Δ)^2 K_{in} (Δ)+3(D_{in} (Δ)-D(r_s,Δ))^2)}{D(r_s, Δ)^2} (5)$$ $$K_{ec}(r_s, Δ)= \frac{(3(D_{ec}-D(r_s,Δ))^2)}{D(r_s,Δ)}^2 (6)$$ Where K(rs,Δ) is the total mean kurtosis, Ksc(rs,Δ), Knc(rs,Δ), Kec(rs,Δ) are the soma, neurite, and extracellular contribution to mean kurtosis respectively. Kis(rs,Δ),Kin(Δ)are the mean kurtosis inside somas and the mean kurtosis inside neurites respectively.Simulation of dMRI of somas and neurites: We simulated the intracellular dMRI signal (fec=0) using Camino4.Somas were represented as spheres, and neurites were represented as cylinders with diameter 1μm and length 60μm. Diffusion simulation of the intracellular signal were performed on the digital cells according to the pipeline5. Each simulation used 1x10⁴ spins with Monte Carlo time step 20μs and intracellular diffusivity 2 x10⁻³ mm2/s. For the dMRI sequences, G=56.6mT/m, 61.3mT/m, δ =11.7ms, 13.2ms, TE=78ms, Δ varied from 15ms to 35ms .Thirty-two uniformly distributed gradient directions, including b0, were employed. K, Ksc, Knc values were obtained.
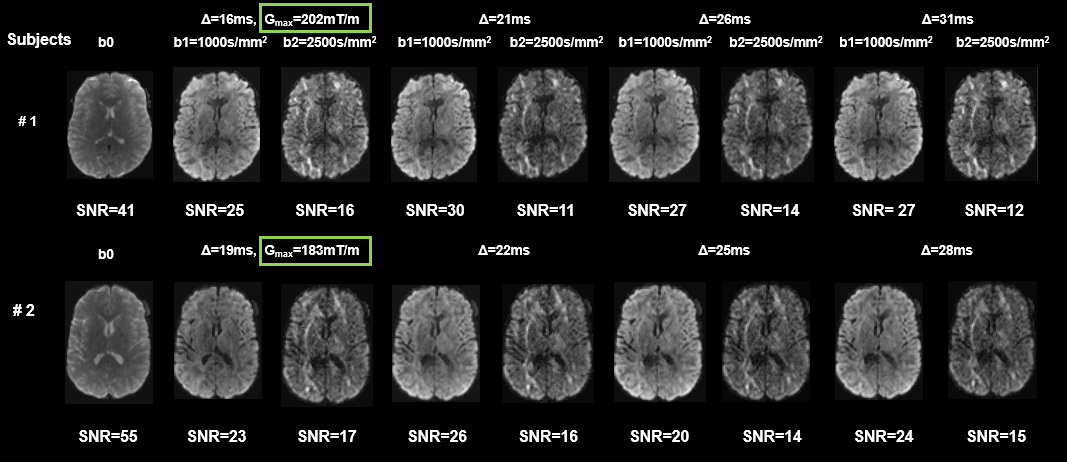
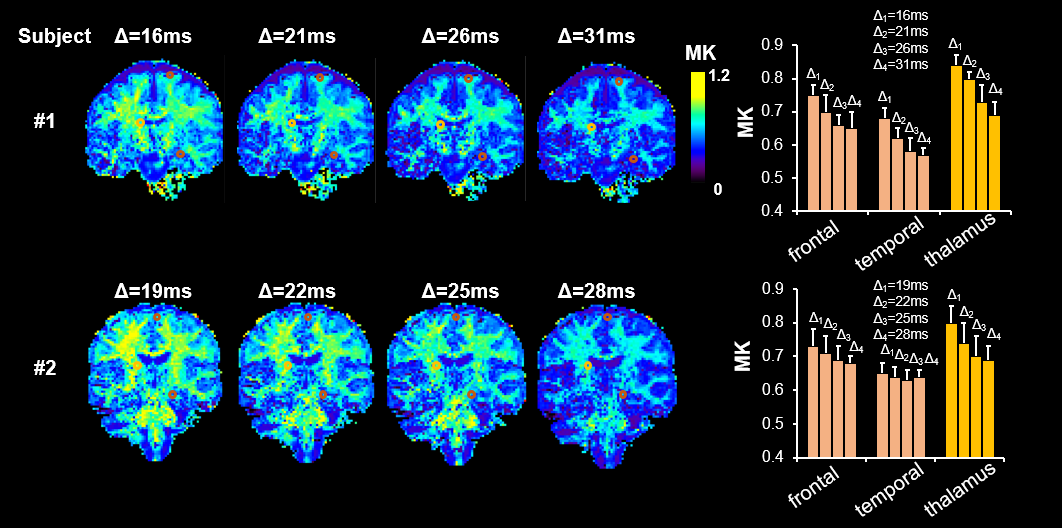
Multi-diffusion time dMRI data acquisition from Connectome Scanner: With approval from the institutional review board, 2 healthy volunteers were scanned on a dedicated high-gradient 3T Connectome scanner (MAGNETOM CONNECTOM, Siemens Healthcare) with maximum gradient strength of 300mT/m6. DMRI sequence parameters were: 2 mm isotropic resolution, four diffusion times Δ = 16, 21, 26, 31ms for one subject and 19, 22, 25, 28ms for another subject, δ = 8ms, maximum gradient=202mT/m, 32 diffusion-encoding gradient directions. For each Δ, two b-values 1000s/mm2 and 2500s/mm2 were acquired for kurtosis fitting.
Results
Fig 1 shows significant non-Gaussian diffusion in a KINSA model cortical voxel. (Fig 1A), sensitivity of Knc,intra to diffusion times (P<0.05) (Fig 1B) and the large percentage error (~50%) in Sin if non-Gaussian term in estimating neurite signals is missed (Fig 1C). Fig 2 shows that both soma (green lines) and neurite (blue lines) contribute to kurtosis across diffusion times and various soma volume fractions. Ksc,v decreases with Δ while Knc,v increases with Δ. Furthermore, as demonstrated by the vertical purple dashed lines, Ksc,v+Knc,v=K as expected for 25ms in the case fec=0, verifying equation (3). For 25ms, Ksc,v+Knc,v>K is possibly due to the breakdown of the non-exchange assumption between compartments7. Fig 3 shows the high SNR human subject dMRI data acquired with high diffusion gradient and multiple diffusion times. Fig 4 shows the significant total MK change across relevant diffusion times 15-31ms for both subjects, consistent with simulation Fig 2. For both gray and white matter, the values drop significantly. Bar plots with MK values measured in regions of interest (ROIs) in the frontal, temporal, thalamus also quantified significant MK drop.Discussion and Conclusion
Significant non-Gaussian diffusion in the compartmental diffusion signal model indicates that the KINSA model incorporating compartmental kurtosis contribution is needed. Both simulated data and real in vivo dMRI data from Connectome scanner demonstrated sensitivity of kurtosis to the diffusion time, making it possible to delineate kurtosis contribution from soma and neurite. Kurtosis changes sensitive only to shorter diffusion time demonstrates importance high diffusion gradient enabling short diffusion time. These results pave the way for KINSA to be used for more in-depth and accurate estimation of cortical microstructure in normal and diseased (such as Alzheimer’s) populations from the aspect of non-Gaussian diffusion.Acknowledgements
This study is funded by NIH MH092535, MH092535-S1 and HD086984.References
1. Zhu T, Huang H. Quantification of soma compartment in cerebral cortical mean kurtosis with diffusion MRI. In Proceedings of the 28th Annual Meeting of ISMRM, Virtual Conference, 2020. p. 4439. 69.
2. Zhu T, Huang H. Neuroanatomical underpinning of cerebral cortical mean kurtosis from diffusion MRI. In Proceedings of the 28th Annual Meeting of ISMRM, Virtual Conference, 2020. p.4457.
3. Zhu, T., Peng, Q., Ouyang, A., & Huang, H. (2020). Neuroanatomical underpinning of diffusion kurtosis measurements in the cerebral cortex of healthy macaque brains. Magnetic Resonance in Medicine. 28548
4. Hall, M. G., & Alexander, D. C. (2009). Convergence and parameter choice for Monte-Carlo simulations of diffusion MRI. IEEE transactions on medical imaging, 28(9), 1354-1364.
5. Palombo, M., Alexander, D. C., & Zhang, H. (2019). A generative model of realistic brain cells with application to numerical simulation of the diffusion-weighted MR signal. NeuroImage, 188, 391-402.
6. Huang, S. Y., Tian, Q., Fan, Q., Witzel, T., Wichtmann, B., McNab, J. A., ... & Wald, L. L. (2020). High-gradient diffusion MRI reveals distinct estimates of axon diameter index within different white matter tracts in the in vivo human brain. Brain Structure and Function, 225(4), 1277-1291.
7. Palombo, M., Ianus, A., Guerreri, M., Nunes, D., Alexander, D. C., Shemesh, N., & Zhang, H. (2020). SANDI: a compartment-based model for non-invasive apparent soma and neurite imaging by diffusion MRI. NeuroImage, 116835.
8. Hong-Hsi Lee, Antonios Papaioannou, Dmitry S. Novikov, Els Fieremans,(2020) In vivo observation and biophysical interpretation of time-dependent diffusion in human cortical gray matter, NeuroImage 222,117054.
Figures