0492
Relayed nuclear Overhauser effect (rNOE) imaging identifies multiple sclerosis: an initial human study1Department of Biomedical Engineering, City University of Hong Kong, Hong Kong, China, 2F.M. Kirby Research Center for Functional Brain Imaging, Kennedy Krieger Research Institute, Baltimore, MD, United States, 3Russell H. Morgan Department of Radiology and Radiological Science, The Johns Hopkins University School of Medicine, Baltimore, MD, United States, 4Department of Diagnostic Radiology, Li Ka Shing Faculty of Medicine, The University of Hong Kong, Hong Kong, China, 5Department of Medicine, Li Ka Shing Faculty of Medicine, The University of Hong Kong, Hong Kong, China, 6City University of Hong Kong Shenzhen Research Institute, Shenzhen, China
Synopsis
Multiple sclerosis (MS) is demyelinating disease of the central nervous system (CNS), which affects more than two million people globally. Here we applied our optimized pulsed-CEST MRI method to acquire relayed nuclear Overhauser effect weighted (rNOEw) images for detecting the pathology changes regarding myelin lipid/protein in human brain with neuromyelitis optica (NMO) and MS on clinical 3T scanner. We found that rNOEw signal of MS brains was significantly lower than that of NMO and NC brains. Our proposed rNOEw imaging method has great potential to assist MS diagnosis and specifically identify MS patients from NMO patients.
Introduction
Multiple sclerosis (MS) is an autoimmune inflammatory disease of the central nervous system (CNS), which affects more than two million people globally.1,2 Dehydrated myelin consists of 75–80% lipid and 20–25% protein by weight.3 Hence, demyelination could result in the lipid/protein-related changes in the brain. Chemical exchange saturation transfer (CEST) is an promising MRI technique that can detect low concentration lipid/protein and metabolites through their exchangeable protons.4,5 Among endogenous CEST contrasts, relayed nuclear Overhauser effect (rNOE) in mobile proteins and lipids, contributing to Z-spectrum at 0-5 ppm upfield from the water signal, have been applied in imaging diseases in the brain, such as Alzheimer’s disease (AD)6 and brain tumor.7-10 rNOE imaging has high specificity of imaging mobile lipids/protein, thus can be potentially used for detecting MS demyelination.11 Recently we have optimized rNOE weighted (rNOEw) imaging scheme using a pulsed-CEST sequence12,13 to detect mobile lipid/protein changes at a 3T MRI preclinical scanner.14 Here we applied the optimized rNOEw imaging method to detect the myelin lipid/protein changes in human MS brain at clinical 3T scanner. The rNOEw brain images of healthy subjects and neuromyelitis optica (NMO) patients were acquired for comparison. This is the first time that rNOEw imaging is used for imaging demyelination of human MS brain.Methods
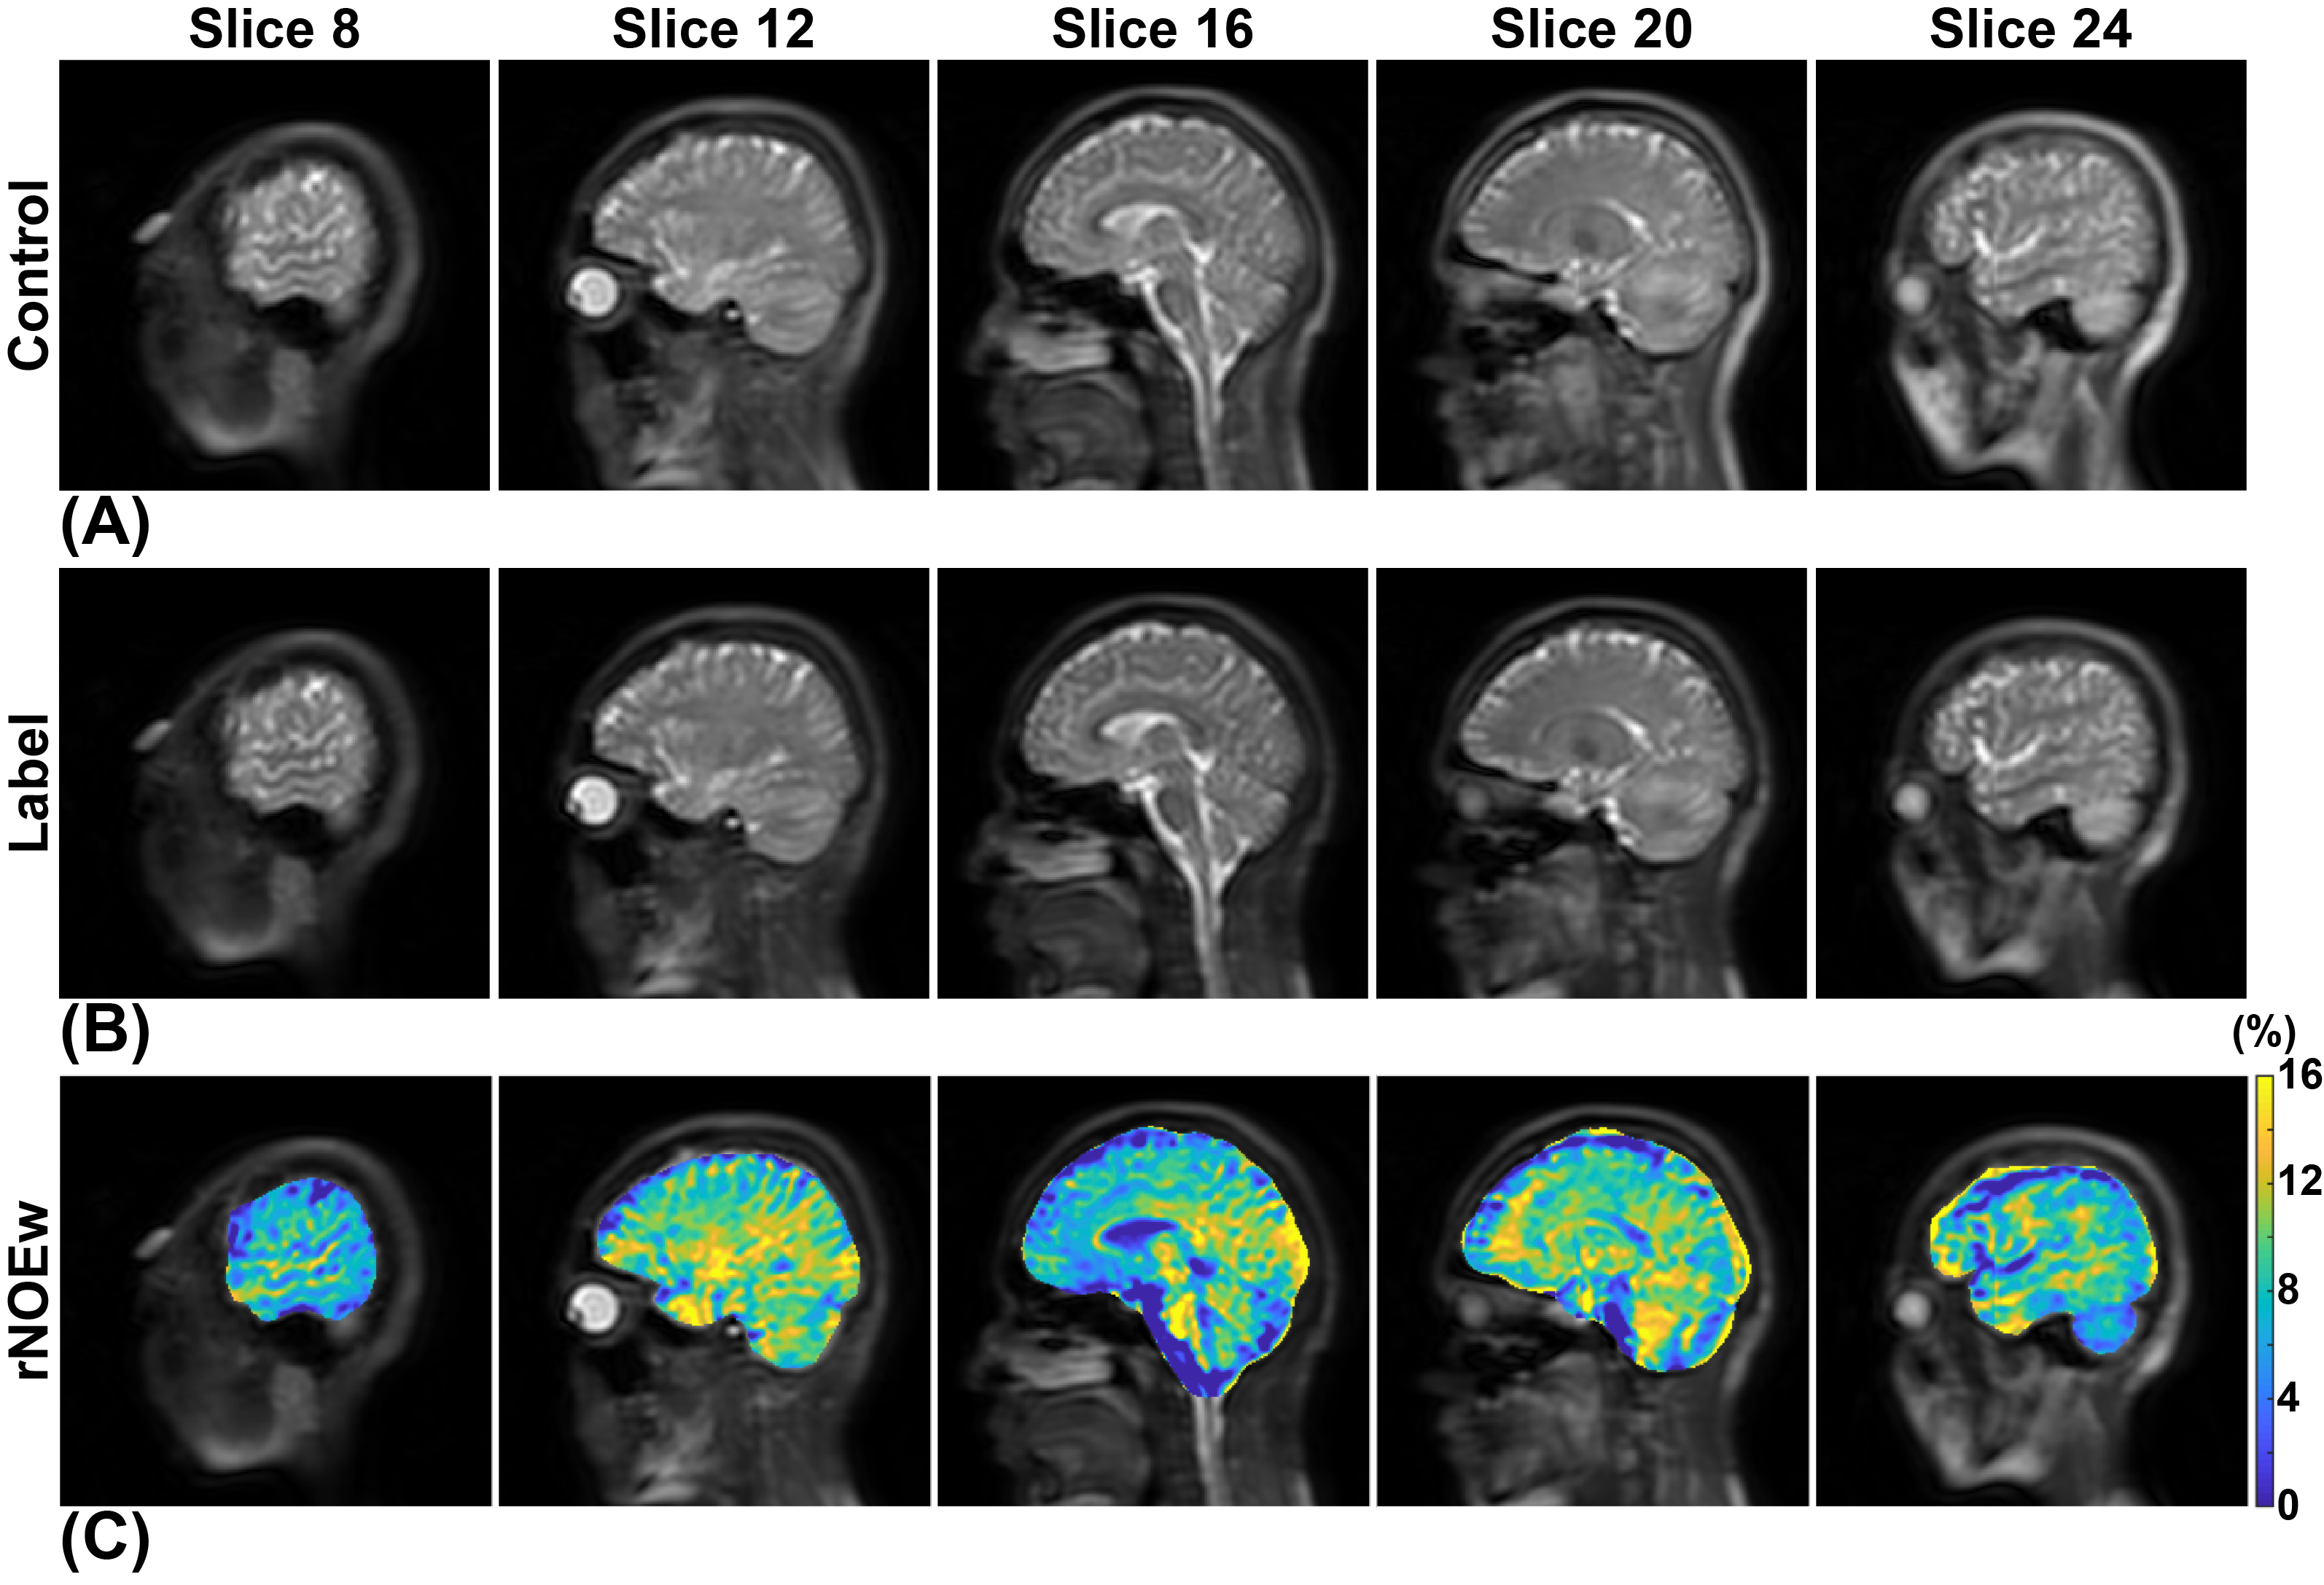
All procedures were carried out in accordance with operational guidelines of Human Research Ethics Committee, and all protocols were approved by the local Institutional Review Board. Subjects in this study include: 20 normal control (NC) participants (mean age, 50 years ± 12; age range, 26–67 years); 15 NMO patients (mean age, 52 years ± 11; age range, 29–72 years); 20 MS patients (mean age, 41 years ± 13; age range, 23–64 years). All scans were performed using a Philips 3 T scanner (Achieva, Philips Healthcare, Best, The Netherlands). Pulsed-CEST sequence, which was modified based on the turbo spin echo (TSE) sequence, was used to acquire the rNOEw images. The saturation parameters optimized in previous animal study on a 3T MRI scanner were applied here (14): saturation power (B1)=0.8 μT, pulse duration (tp)=40 ms, mixing time (tmix)=60 ms. Other MRI parameters are as followings: repetition time (TR) = 3 s; echo time (TE) = 56 ms; flip angle (FA) = 90°; number of average (NA) = 1; Field of view (FOV) = 230 × 230 ×198 mm3; acquisition matrix = 224 × 224 × 33; slice thickness = 6 mm. Scanning time of an image set was 1 min 48 s. A label image set at -3.5 ppm and a control imaging set at -8 ppm were acquired, resulting in a total scanning time of 3 min 36 s for each subject.Image processing were performed using MATLAB (MathWorks) and FMRIB Software Library (FSL). For rNOE calculation, the label image Ilab and the control image Icon were obtained during MRI acquisition. Thus, the rNOEw image can be calculated as:$$rNOEw=\frac{I_{con}-I_{lab}}{I_{con}}$$Brain region of each data set were extracted from corresponding control image using BET in FSL and then segmented into white matter (WM) and grey matter (GM) regions using FAST in FSL.Results and Discussion
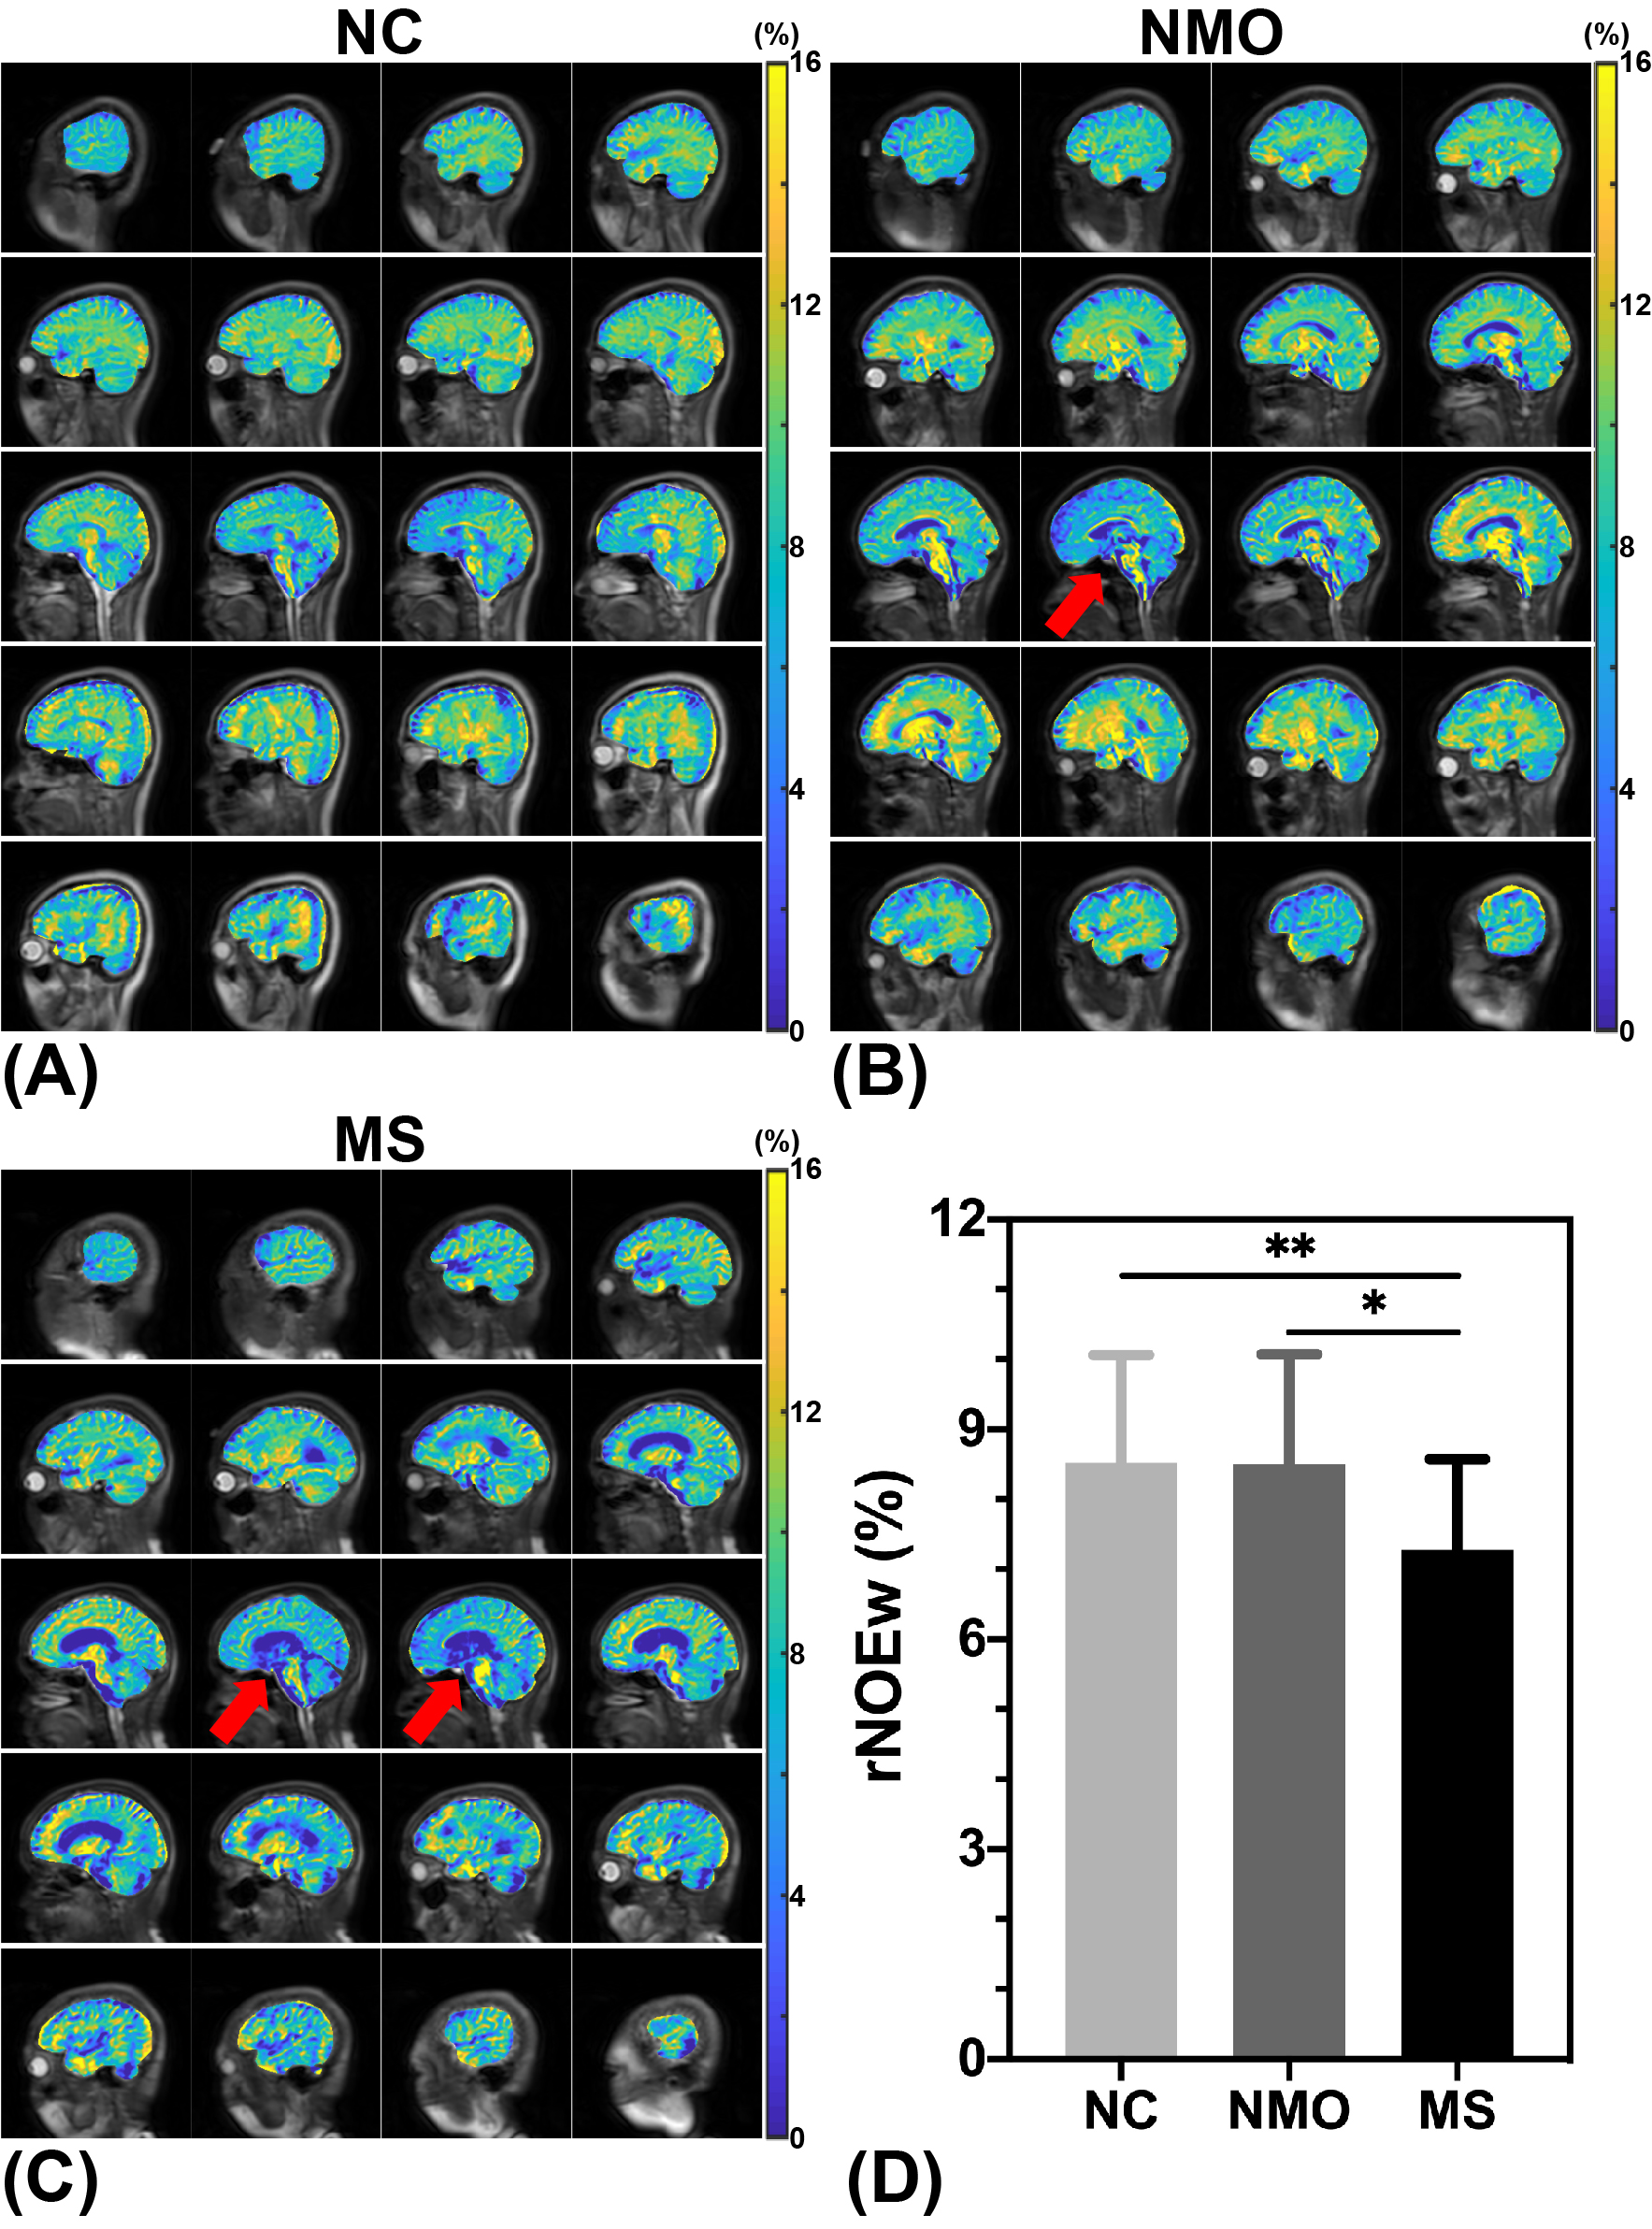
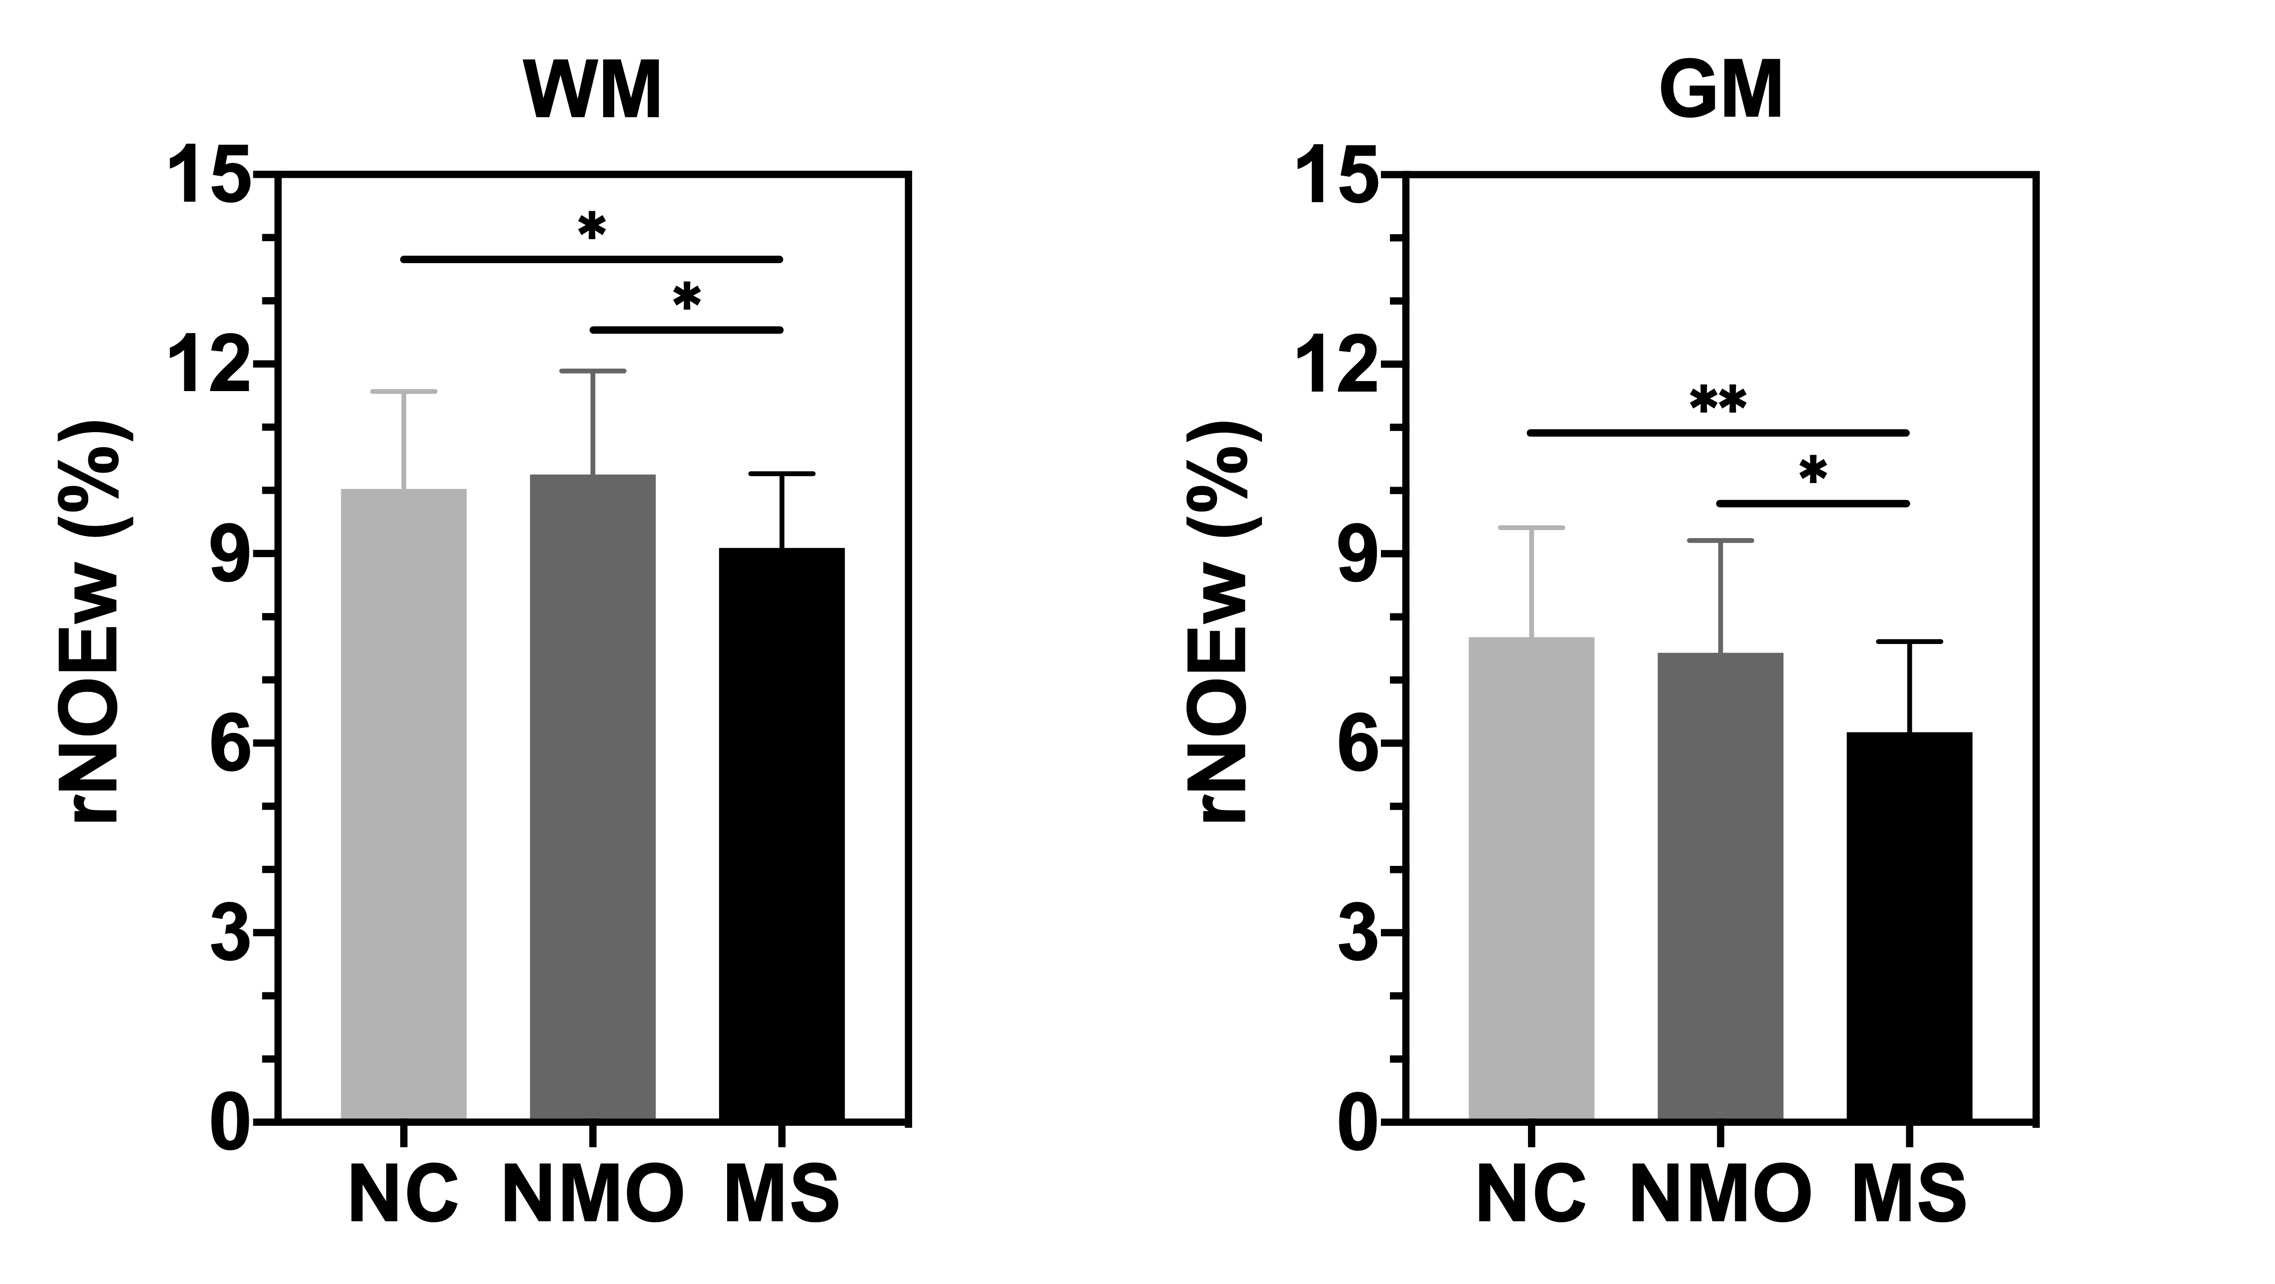
Figure 1 showed high-quality rNOEw images of the whole human brain, which can be quickly generated just using control and label images acquired by the optimized pulsed-CEST (14). In rNOEw images of NMO brain, regional hypointensity was mainly found in the central slice (Figure 2B, indicated by red arrow) while similar rNOEw contrast was observed in other slices of the whole brain compared to NC brain (Figure 2A). In contrast, hypointensity was observed in all slices of rNOEw images from MS brain (Figure 2C) compared to NC brain. Multiple-subject comparison results (Figure 2D) showed that the rNOEw signal of MS brains was significantly lower than that of NC brains (7.28 ± 1.30% versus 8.52 ± 1.54%, P = 0.009) and NMO brains (7.28 ± 1.30% versus 8.50 ± 1.57%, P = 0.016), indicating a severe decrease in myelin lipids/proteins in MS. However, no significant difference was found between NC group and NMO group (P = 0.978). The regional rNOEw signal comparison of WM and GM for three cohorts were shown in Figure 3. Significantly lower rNOEw signal was found in these two regions of MS brains compared to NC and NMO brains, which was consistent with the whole-brain results. Compared to NC brains, the lower rNOE signal of MS brains was more significant in GM (P = 0.005) than WM (P = 0.038).Conclusion
We applied our optimized pulsed-CEST imaging scheme at 3T to acquire brain rNOEw images within a few minutes for studying myelin lipid/protein changes in MS and NMO. Selective regional decrease in rNOEw signal was observed in NMO, however it is not significant compared to NC brains. While a significantly lower rNOEw signal was found in multiple regions in MS brains compared to NMO and NC brains. Our proposed rNOEw imaging scheme has great potential to assist MS diagnosis. Moreover, it can be used to differentiate MS patients from NMO patients.Acknowledgements
Research Grants Council: 11102218; City University of Hong Kong: 7005210, 9680247, 9667198 and 6000660; National Natural Science Foundation of China: 81871409.References
1. Sospedra M, Martin R. Immunology of multiple sclerosis. Annu Rev Immunol 2005;23:683-747.
2. Browne P, Chandraratna D, Angood C, Tremlett H, Baker C, Taylor BV, Thompson AJ. Atlas of multiple sclerosis 2013: a growing global problem with widespread inequity. Neurology 2014;83(11):1022-1024.
3. Min Y, Kristiansen K, Boggs JM, Husted C, Zasadzinski JA, Israelachvili J. Interaction forces and adhesion of supported myelin lipid bilayers modulated by myelin basic protein. Proc Natl Acad Sci USA 2009;106(9):3154-3159.
4. Ward K, Aletras A, Balaban RS. A new class of contrast agents for MRI based on proton chemical exchange dependent saturation transfer (CEST). J Magn Reson 2000;143(1):79-87.
5. Van Zijl PC, Yadav NN. Chemical exchange saturation transfer (CEST): what is in a name and what isn't? Magn Reson Med 2011;65(4):927-948.
6. Chen L, Wei Z, Chan KW, Cai S, Liu G, Lu H, Wong PC, van Zijl PC, Li T, Xu J. Protein aggregation linked to Alzheimer's disease revealed by saturation transfer MRI. Neuroimage 2019;188:380-390.
7. Goerke S, Soehngen Y, Deshmane A, Zaiss M, Breitling J, Boyd PS, Herz K, Zimmermann F, Klika KD, Schlemmer HP. Relaxation-compensated APT and rNOE CEST-MRI of human brain tumors at 3 T. Magn Reson Med 2019;82(2):622-632.
8. Zhang XY, Wang F, Li H, Xu J, Gochberg DF, Gore JC, Zu Z. Accuracy in the quantification of chemical exchange saturation transfer (CEST) and relayed nuclear Overhauser enhancement (rNOE) saturation transfer effects. NMR Biomed 2017;30(7):e3716.
9. Zaiss M, Deshmane A, Schuppert M, Herz K, Glang F, Ehses P, Lindig T, Bender B, Ernemann U, Scheffler K. DeepCEST: 9.4 T Chemical exchange saturation transfer MRI contrast predicted from 3 T data–a proof of concept study. Magn Reson Med 2019;81(6):3901-3914.
10. Jones CK, Huang A, Xu J, Edden RA, Schär M, Hua J, Oskolkov N, Zacà D, Zhou J, McMahon MT. Nuclear Overhauser enhancement (NOE) imaging in the human brain at 7 T. Neuroimage 2013;77:114-124.
11. Baumann N, Pham-Dinh D. Biology of oligodendrocyte and myelin in the mammalian central nervous system. Physiol Rev 2001;81(2):871-927.
12. Xu J, Yadav NN, Bar‐Shir A, Jones CK, Chan KW, Zhang J, Walczak P, McMahon MT, Van Zijl PC. Variable delay multi-pulse train for fast chemical exchange saturation transfer and relayed-nuclear overhauser enhancement MRI. Magn Reson Med 2014;71(5):1798-1812.
13. Xu X, Yadav NN, Zeng H, Jones CK, Zhou J, van Zijl PC, Xu J. Magnetization transfer contrast–suppressed imaging of amide proton transfer and relayed nuclear overhauser enhancement chemical exchange saturation transfer effects in the human brain at 7T. Magn Reson Med 2016;75(1):88-96.
14. Huang J, Han X, Chen L, Xu X, Xu J, Chan KW. Relayed nuclear Overhauser enhancement imaging with magnetization transfer contrast suppression at 3 T. Magn Reson Med 2020;85(1):254-267.
Figures