0491
An investigation of the sensitivity of diffusion-based microstructure combined with network analysis in multiple sclerosis
Sara Bosticardo1, Simona Schiavi1, Sabine Schaedelin2, Po-Jui Lu3,4, Muhamed Barakovic2,3, Matthias Weigel2,3,5, Ludwig Kappos3,4, Jens Kuhle3,4, Alessandro Daducci1, and Cristina Granziera2,3,4
1Department of Computer Science, University of Verona, Verona, Italy, 2Departments of Medicine, Clinical Research and Biomedical Engineering, Neurology, University Hospital Basel and University of Basel, Basel, Switzerland, 3Department of Medicine and Biomedical Engineering, University Hospital Basel and University of Basel, Neurologic Clinic and Policlinic, Translational Imaging in Neurology (ThINk), Basel, Switzerland, 4Research Center for Clinical Neuroimmunology and Neuroscience, Basel, Switzerland, 5Department of Radiology, Division of Radiological Physics, University Hospital Basel, Basel, Switzerland
1Department of Computer Science, University of Verona, Verona, Italy, 2Departments of Medicine, Clinical Research and Biomedical Engineering, Neurology, University Hospital Basel and University of Basel, Basel, Switzerland, 3Department of Medicine and Biomedical Engineering, University Hospital Basel and University of Basel, Neurologic Clinic and Policlinic, Translational Imaging in Neurology (ThINk), Basel, Switzerland, 4Research Center for Clinical Neuroimmunology and Neuroscience, Basel, Switzerland, 5Department of Radiology, Division of Radiological Physics, University Hospital Basel, Basel, Switzerland
Synopsis
Graph measures derived from structural connectomes are widely used to study neurodegenerative diseases such as multiple sclerosis (MS). Usually, the connection strength is assessed by counting the number of streamlines connecting pairs of grey-matter regions. Here we used different ways to weight the edges to compare the sensitivity to MS structural disruptions of three diffusion-based microstructural models and their derived maps combined with network analysis. We found that the most sensitive are those whose derived maps are associated to intra-axonal signal fraction. Moreover, the segregation of the network appeared to be the most important in explaining clinical motor disability.
Introduction
The map of brain structural connections (connectome) can be modeled as a network where nodes correspond to gray-matter regions and edges represent white-matter links between them. This formalism allows characterizing brain connectivity in vivo and studying a wide range of neurological diseases using graph theory1. Graph theory permits analyzing the networks at the topological level by extracting some metrics to capture pathology-related alterations2. The most common strategy to weight the connectome edges is based on the number of streamlines (NOS) connecting the regions. However, recent works have highlighted that this approach is not quantitative1,3,4. To overcome this issue, we have used tractometry5 to weight the connections obtained from tractography by averaging along their paths the tissue properties estimated from classical diffusion-based microstructural models. The aims of this work were to investigate (i) which microstructural maps and (ii) which global network metrics extracted from them are most sensitive to alterations in the structural connectivity of multiple sclerosis (MS) patients. We also assessed how these metrics could explain MS patients’ clinical disability.Methods
Sixty-six MS patients (39 females, 43.9±14.5yrs) and sixty-five healthy controls (HC) (38 females, 36.8±12.7yrs) were enrolled in this study. Images were acquired on a 3T MR system (Siemens Magnetom Prisma, Erlangen, Germany). The protocol included: 3D FLAIR (TR/TE/TI=5000/386/1800ms), 3D MP2RAGE (TR/TI1/TI2=5000/700/2500ms) 1mm3 isotropic; multi-shell diffusion (TR/TE /resolution=4.5s/75ms) 1.8mm3 isotropic with b-values 0/700/1000/2000/3000s/mm2 with 12/6/20/45/66 measurements per shell as well as 12 measurements of b-value 0s/mm2 with reversed phase encoding. The MP2RAGE images were segmented into 85 regions using FreeSurfer6; diffusion images were pre-processed to remove noise and eddy induced distortions7,8. Then, anatomically constrained tractography was performed using iFOD2 algorithm of MRTrix39. For each subject, the connectomes were built by counting the NOS connecting the regions as well as by weighting them according to fractional anisotropy (FA), radial diffusivity (RD) and mean diffusivity (MD) maps from Diffusion Tensor Imaging (DTI)10; intra-cellular volume fraction (ICVF) and isotropic volume fraction (ISOVF) maps extracted using Neurite Orientation Dispersion and Density Imaging (NODDI)11,12; intra-neurite volume fraction (INTRA), extra-neurite transverse microscopic diffusivity (EXTRATRANS) and extra-neurite microscopic mean diffusivity (EXTRAMD) maps extracted using Spherical Mean Technique (SMT)13,14. From each connectome, 5 global network metrics were extracted: Density (ratio between actual and possible connections), Efficiency (capability to transfer and process information), Modularity (network segregation), Clustering coefficient (degree on which nodes tends to cluster) and Mean strength (average of the edges weights connected to a node).Because of the presence of white-matter lesions in MS patients, tractography might not recover some pathways resulting in an artificial density reduction and recent studies showed that it is not correct to compare connectomes with discrepancies in density2. Density was significantly different between HC and MS patients ($$$p<0.001$$$). Thus, to compare the two groups, we accounted for age, gender and density as covariates in our statistical analysis. Moreover, we employed a robust linear model to account for outliers. We tested two main null hypotheses: no network metrics extracted from a given map are sensitive to MS and no network metrics extracted from all maps of every model are sensitive to the pathology. We report p-values adjusted for multiple comparisons with Holm test15 for both cases. Finally, those metrics that significantly differed between MS patients and HC were evaluated in a robust linear model adjusted for gender, age and disease-duration to identify their contributions in explaining clinical disability measured through the Expanded Disability Status Scale (EDSS). The flowchart in Figure 1 illustrates the analysis approach described above.
Results and Discussion
Results of the groups comparisons are reported in Table 1. Values that have reached statistical significance are highlighted in bold, and the corresponding boxplots are in Figure 2. The most sensitive microstructural model to MS pathology appeared to be NODDI with ICVF, and SMT with the extra-cellular sensitive maps. DTI found less differences among the network metrics but with higher significance. In particular, MS patients showed a significant reduction in global efficiency, clustering coefficient and mean strength as well as increased modularity. As expected, after accounting for discrepancies in density, the connectomes weighted by NOS didn’t show significant differences. This supports previous observations that NOS is non-quantitative and may not be sensitive to disease-related alterations16.Among the maps that were significantly different between groups, we found that network metrics computed by weighting by ICVF and INTRA well explained the EDSS (adj $$$R^2=0.560$$$ and adj $$$R^2=0.545$$$, respectively). Although age seemed to drive the significance, modularity also contributed significantly ($$$p=0.019$$$ and $$$p=0.020$$$ respectively). These findings suggest that the segregation of the networks weighted by maps sensitive to axonal damage reflects well the worsening of the pathology.
Conclusions
For the first time, we compared the sensitivity of different diffusion-based microstructural models to capturing disruptions in structural connectivity caused by MS disease. Our analyses confirmed that NOS is a non-quantitative method and revealed a higher sensitivity of NODDI and SMT models than DTI to pathology. Finally, with NODDI and SMT maps sensitive to intra-axonal signal fraction, we found that the network segregation contributes significantly to explaining motor disability.Acknowledgements
No acknowledgement found.References
- S.N. Sotiropoulos, A. Zalesky. Building connectomes using diffusion MRI: why, how and but. NMR in Biomedicine 32.4, 2020.
- S. Schiavi, M. Petracca, M. Battocchio, M. M. El Mendili, S. Paduri, L. Fleysher, M. Inglese, A. Daducci. Sensory‐motor network topology in multiple sclerosis: Structural connectivity analysis accounting for intrinsic density discrepancy. Human Brain Mapping, 2020.
- D.K. Jones, T.R. Knösche, R. Turner. White matter integrity, fiber count, and other fallacies: The do's and don'ts of diffusion MRI. NeuroImage, 73, 2018.
- C-H Yeh, D.K Jones, X. Liang, M. Descoteaux, A. Connelly. Mapping Structural Connectivity Using Diffusion MRI: Challenges and Opportunities. Journal of Magnetic Resonance Imaging, 2020.
- S. Bells, M. Cercignani, S. Deoni, Y. Assaf, O. Pasternak, C.J. Evans, A. Leemans, D.K. Jones. Tractometry Comprehensive Multi-modal Quantitative Assessment of White Matter Along Specific Tracts. Proc. Intl. Soc. Mag. Reson. Med. 19, 2011.
- R.S. Desikan, F. Ségonne, B. Fischl, B. T. Quinn, B. C. Dickerson, D. Blacker, R. L. Buckner, A. M. Dale, R. P. Maguire, B. T. Hyman, M. S. Albert, R. J. Killiany. An automated labeling system for subdividing the human cerebral cortex on MRI scans into gyral based regions of interest. Neuroimage 31.3, 2006.
- H. Yamada, O.Abe, T. Shizukuishi, J. Kikuta, T.Shinozaki, K. Dezawa, A. Nagano, M. Matsuda, H. Haradome, Y. Imamura. Efficacy of distortion correction on diffusion imaging: comparison of FSL eddy and eddy_correct using 30 and 60 directions diffusion encoding. PloS one 9.1, 2014.
- M. A. Horsfield. Mapping eddy current induced fields for the correction of diffusion-weighted echo planar images. Magnetic resonance imaging 17.9, 1999.
- J.-D. Tournier, R.E. Smith, D. Raffelt, R. Tabbara, T. Dhollander, M. Pietsch, D. Christiaens, B. Jeurissen, C.-H. Yeh, A. Connelly. MRtrix3: A fast, flexible and open software framework for medical image processing and visualisation. NeuroImage 202, 2019.
- C Pierpaoli, P Jezzard, P J Basser, A Barnett, G Di Chiro. Diffusion tensor MR imaging of the human brain. Radiology 201:3, 1996.
- H. Zhang, T. Schneider, C. A. Wheeler-Kingshott, D. C. Alexander. NODDI: practical in vivo neurite orientation dispersion and density imaging of the human brain. Neuroimage, 2012.
- A. Daducci, E. J. Canales-Rodríguez, H. Zhang, T. B. Dyrby, D. C. Alexander, J-P Thiran. Accelerated microstructure imaging via convex optimization (AMICO) from diffusion MRI data. NeuroImage 105, 2015.
- E. Kaden, N. D. Kelm, R. P. Carson, M. D. Does, D. C. Alexander. Multi-compartment microscopic diffusion imaging. NeuroImage 139, 2016.
- E. Kaden, F. Kruggel, D. C. Alexander. Quantitative mapping of the per-axon diffusion coefficients in brain white matter. Magnetic resonance in medicine 75.4, 2016.
- M. Aickin, H. Gensler. Adjusting for multiple testing when reporting research results: the Bonferroni vs Holm methods. American journal of public health 86.5, 1996.
- K. Kamagata, A. Zalesky, K. Yokoyama, C. Andica, A. Hagiwara, K. Shimoji, K. K. Kumamaru, M. Y. Takemura, Y. Hoshino, K. Kamiya, M. Hori, C. Pantelis, N. Hattori, S. Aoki. MR g-ratio-weighted connectome analysis in patients with multiple sclerosis. Scientific reports, 2019.
Figures
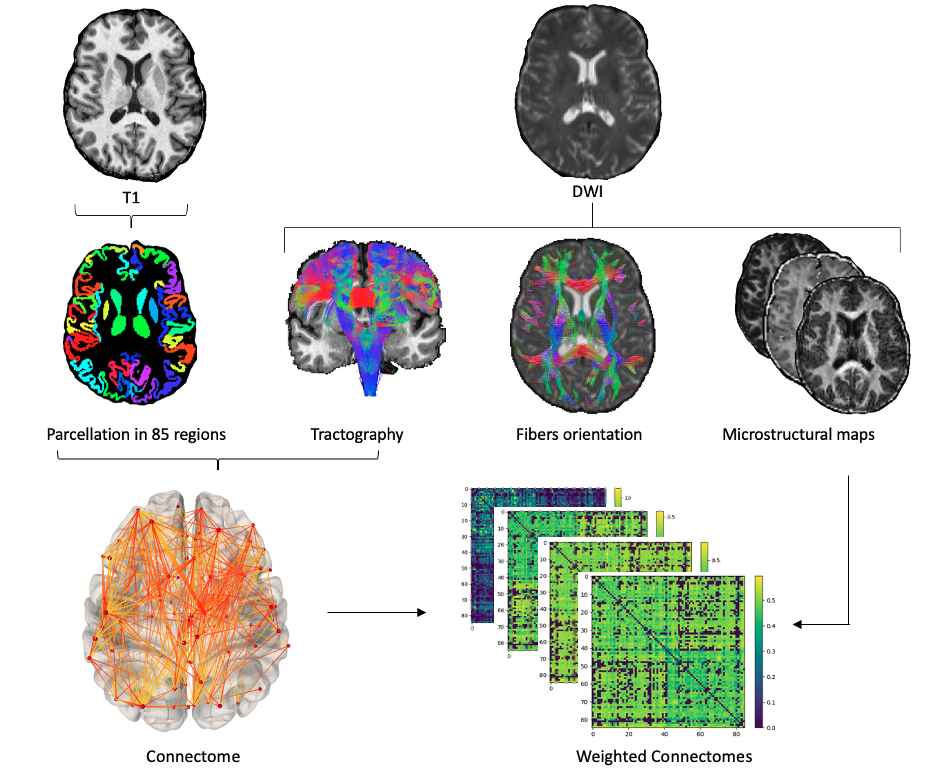
Figure 1: Flowchart for the construction of structural connectivity networks based on tractometry. Combining the T1 parcellation, the tractogram and 3 different diffusion models, we built the connectomes weighted by different microstructural maps and we compared their topological properties.
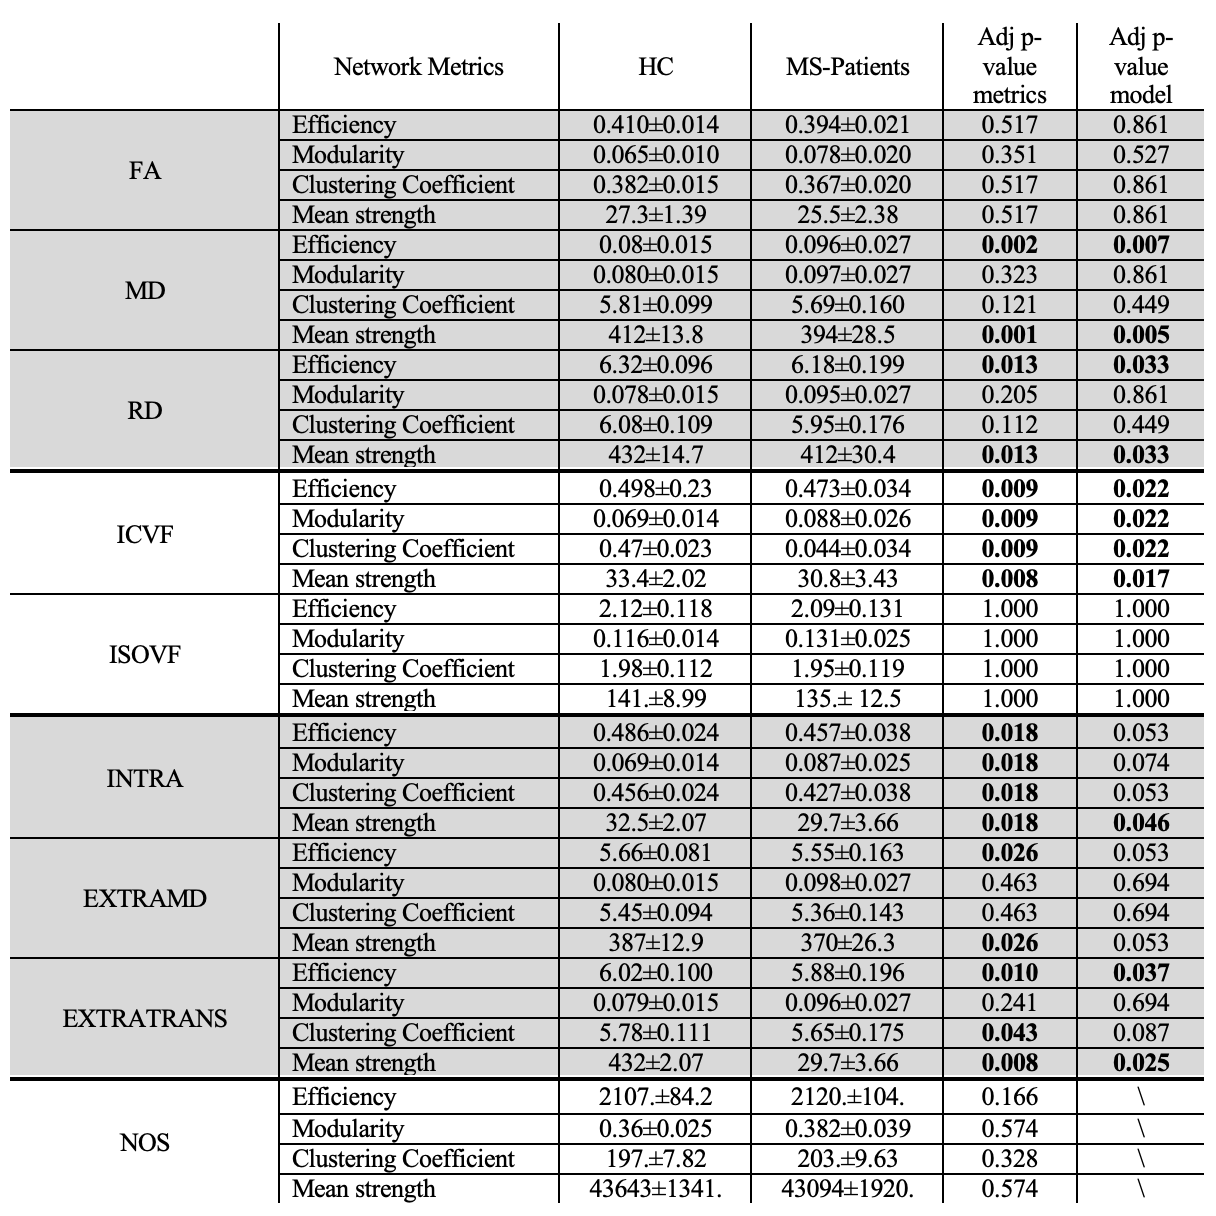
TABLE 1: Group comparison performed with the linear robust model, where Gender, Age and Density are covariates. A Holm Post-Hoc correction was applied (i) for each network metrics of each microstructural map (Adj p-value metrics) and (ii) for each network metrics extracted from all microstructural maps of every diffusion model (Adj p-value model) to account for multiple comparison. Statistically significant results are highlighted in bold.
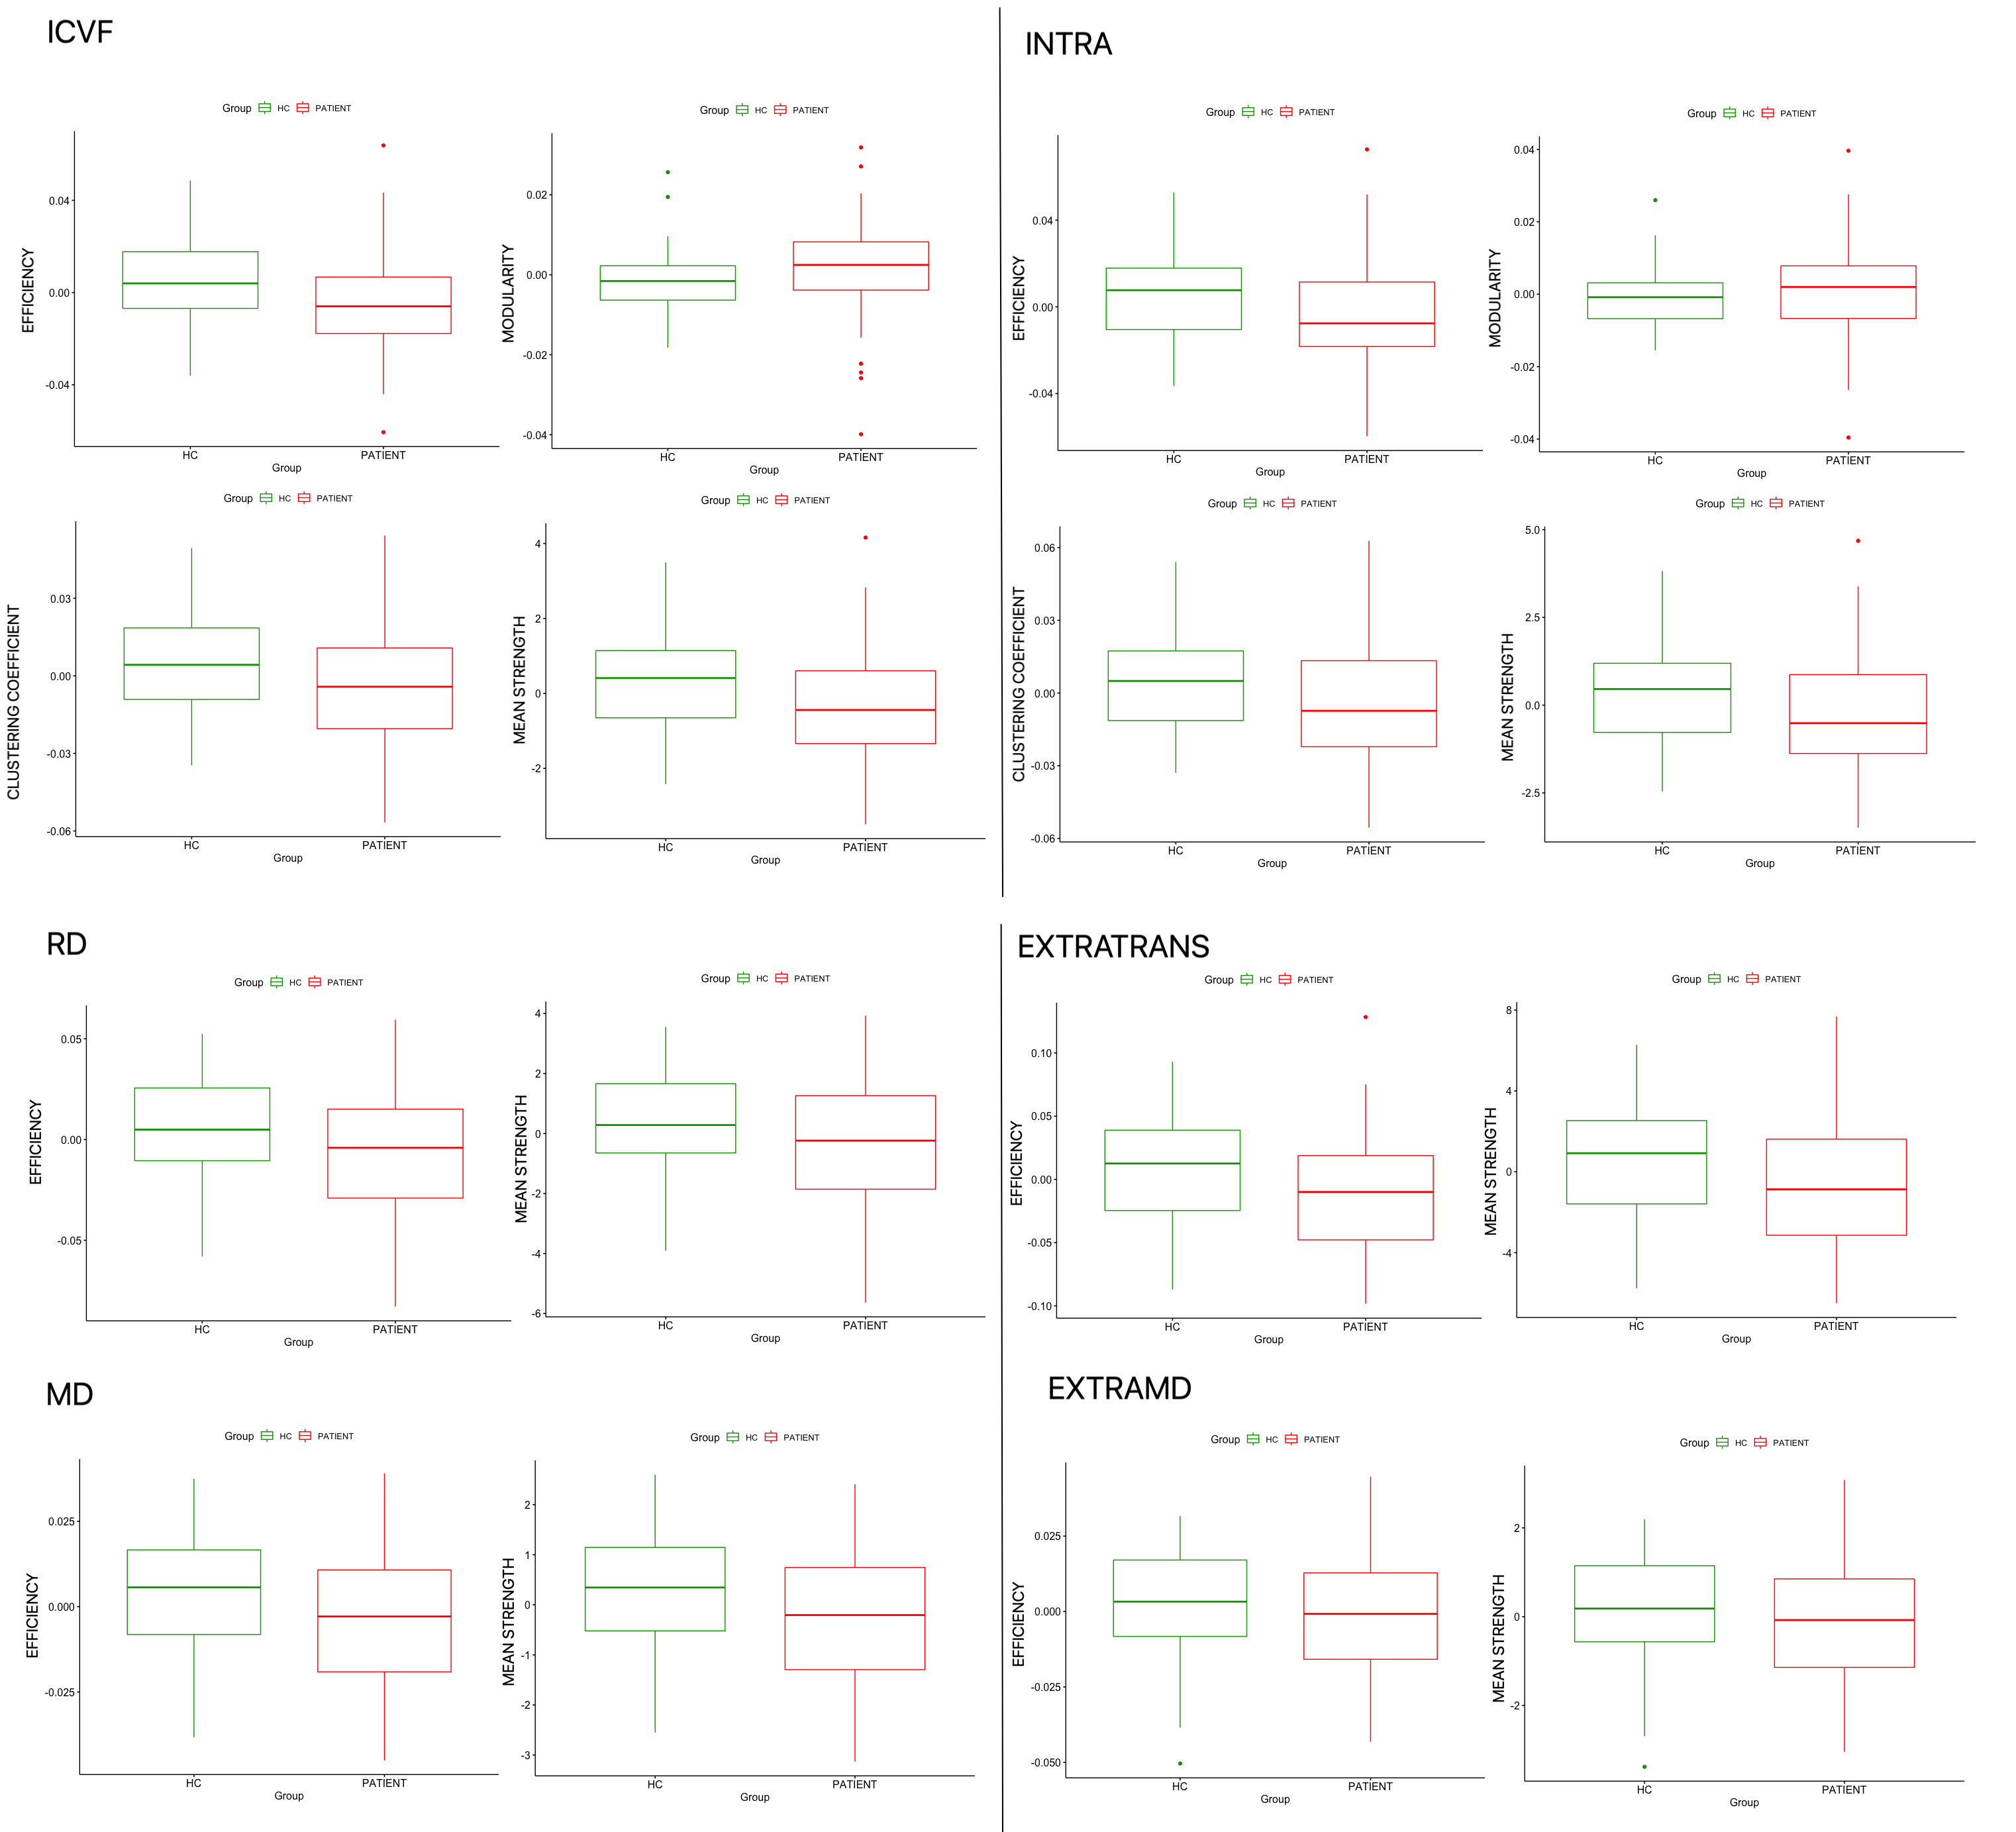
Figure 2: Boxplots for the metrics that showed statistically significant differences between healthy controls (HC in green) and multiple sclerosis patients (MS in red). In the upper part we show efficiency, modularity, clustering coefficient and mean strength resulting from the weighting using ICVF and INTRA which reflects intra-axonal damage. In the bottom we show efficiency and mean strength from the weighting using RD, EXTRATRANS, MD and EXTRAMD which reflects extra-axonal behavior.
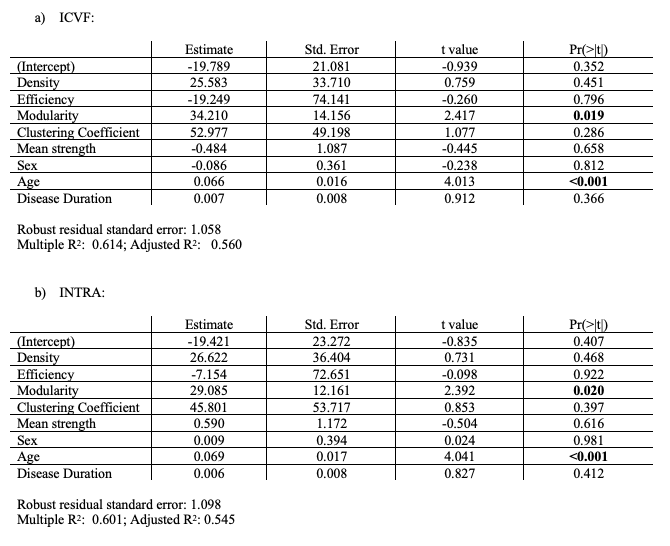
Table 2: Robust linear models to identify the importance of each network metrics to describe the EDSS. Age, Gender and Disease Duration are included as covariates. On the upper part we have the model corresponding to ICVF and on the bottom the one corresponding to INTRA. Both models explain about 55% of our data. In both model large part of the EDSS is explained by age, but also the modularity shows significant contribution highlighting that EDSS is related to network segregation.