0490
Multiparametric quantitative postmortem 3T-MRI of histopathological lesion types in multiple sclerosis1Neurology Clinic and Policlinic, Departments of Medicine, Clinical Research and Biomedical Engineering, University Hospital Basel and University of Basel, Basel, Switzerland, Basel, Switzerland, 2Translational Imaging in Neurology (ThINk) Basel, Department of Biomedical Engineering, University Hospital Basel and University of Basel, Basel, Switzerland, Basel, Switzerland, 3Research Center for Clinical Neuroimmunology and Neuroscience (RC2NB) Basel, University Hospital Basel and University of Basel, Basel, Switzerland, Basel, Switzerland, 4Institute of Neuropathology, University Medical Center, Göttingen, Germany, Göttingen, Germany, 5Division of Radiological Physics, Department of Radiology, University Hospital Basel, Basel, CH, Basel, Switzerland, 6Department of Cognitive Neurology, MR-Research in Neurosciences, University Medical Center Göttingen, Göttingen, Germany, Göttingen, Germany, 7Centre for Research in Neuroscience - Department of Clinical Neurosciences, Laboratoire de recherche en neuroimagerie (LREN) University Hospital and University of Lausanne, Lausanne, Switzerland, Lausanne, Switzerland, 8National Institute of Neurological Disorders and Stroke, Bethesda, MD, USA, Bethesda, MD, United States
Synopsis
We have identified the imaging correlates of multiple sclerosis lesion subtypes by exploiting post-mortem multiparametric quantitative MRI and histopathological analysis. Remyelinated lesions showed distinct MRI characteristics compared to other MS lesions, and a remarkable resemblance to normal-appearing tissue properties. Our findings suggest that multiparametric quantitative MRI may well help to identify specific focal lesion types in vivo in MS patients.
Introduction
Postmortem MRI might help to disentangle the variety of cytological and microstructural alterations characterizing focal lesions in multiple sclerosis (MS) patients. According to a recent histological classification by Kuhlmann et al. (1), MS lesions are very heterogeneous and can be distinguished according to cellularity, presence of microglia/macrophages, extent of myelin and axon loss, and degree of ongoing demyelination. Active lesions are hypercellular (with diffuse infiltration of blood-derived monocytes or microglia) and may show acute demyelination (1). Mixed active/inactive lesions exhibit loss of myelin/axons, have a hypocellular lesion center and present a rim of activated microglia/macrophages at the lesion edge (1). Inactive lesions are hypocellular, strongly demyelinated and depleted of mature oligodendrocytes; moreover, they show a marked axonal loss and no microglia/macrophages at the lesion edge (1). Remyelination may be extensive and involve the whole lesion or only part of it (2). Quantitative MRI metrics such as Magnetization Transfer Imaging (MTI), Myelin Water Imaging (MWI), T1 relaxometry and Quantitative Susceptibility Mapping (QSM) provide precious insights into the pathological correlates of MS lesions (3). However, to date, no study simultaneously assessed their accuracy in discriminating histopathologically-defined MS lesions subtypes.Methods
Two MS brains of deceased secondary-progressive MS patients (8 and 23 years disease duration) were imaged on a 3T whole-body MR system using a 20-channel head and neck coil and a dome-shaped brain container filled with perfluoropolyether. Brains had been fixed in 10% formalin within 24 hours from death and for about four to six months before the MRI. Images were acquired with the following sequences of 3D isotropic resolution, adapted to ex vivo conditions and capabilities: (i) MP2RAGE (670μm isotropic, TR=5s, TE=1.78ms, TI1=194ms and TI2=2500ms) to obtain quantitative T1 maps (qT1) (4,5); (ii) fast T2prep sequence with spiral readout trajectory (1000μm isotropic, TEprep=[0, 7.5, 17.5, 67.5, 147.5, 307.5]ms, TRreadout=9.3ms) to assess myelin water fraction (MWF) (6); (iii) segmented 3D-EPI (330μm isotropic, TR=65ms, TE=35ms, ETL=13, bandwidth 394Hz/Pixel) to enable QSM (7); and (iv) a T1-weighted (TR=11.33ms, flip angle 15deg), proton density weighted (TR=25ms, flip angle 5deg), and MT prepared (TR=25ms, flip angle 5deg) RF-spoiled 3D-GRE of identical geometry (570μm isotropic) to allow MTsat map reconstruction (8). We then designed and 3D-printed an individualized cutting box for each brain basing on the three-dimensional information contained in the MR-images, as reported in (9). To further refine the match between histopathological and MRI images, we used additional manual registration between the digitized brain slab surfaces and the corresponding MRI slices. MS lesions and regions of normal appearing white matter were identified on 3D-EPI images and manually segmented using ITK-SNAP 3.6.0 (10). Histopathologically, WM lesions were identified and then categorized as in (1) after staining histological slices from lesion tissue blocks with Luxol fast blue (LFB, for myelin), Myelin Basic Protein (MBP, for myelin) and CR3/43 (for microglia/macrophages). An additional category was represented by remyelinated tissue (shadow plaques or partially remyelinated lesions), identified at the LFB stain and/or MBP. Statistical analyses were performed with Kruskal–Wallis test for each measure, followed by Mann–Whitney U post hoc tests. Bonferroni correction was applied to account for multiple testing (4 quantitative measures).Results
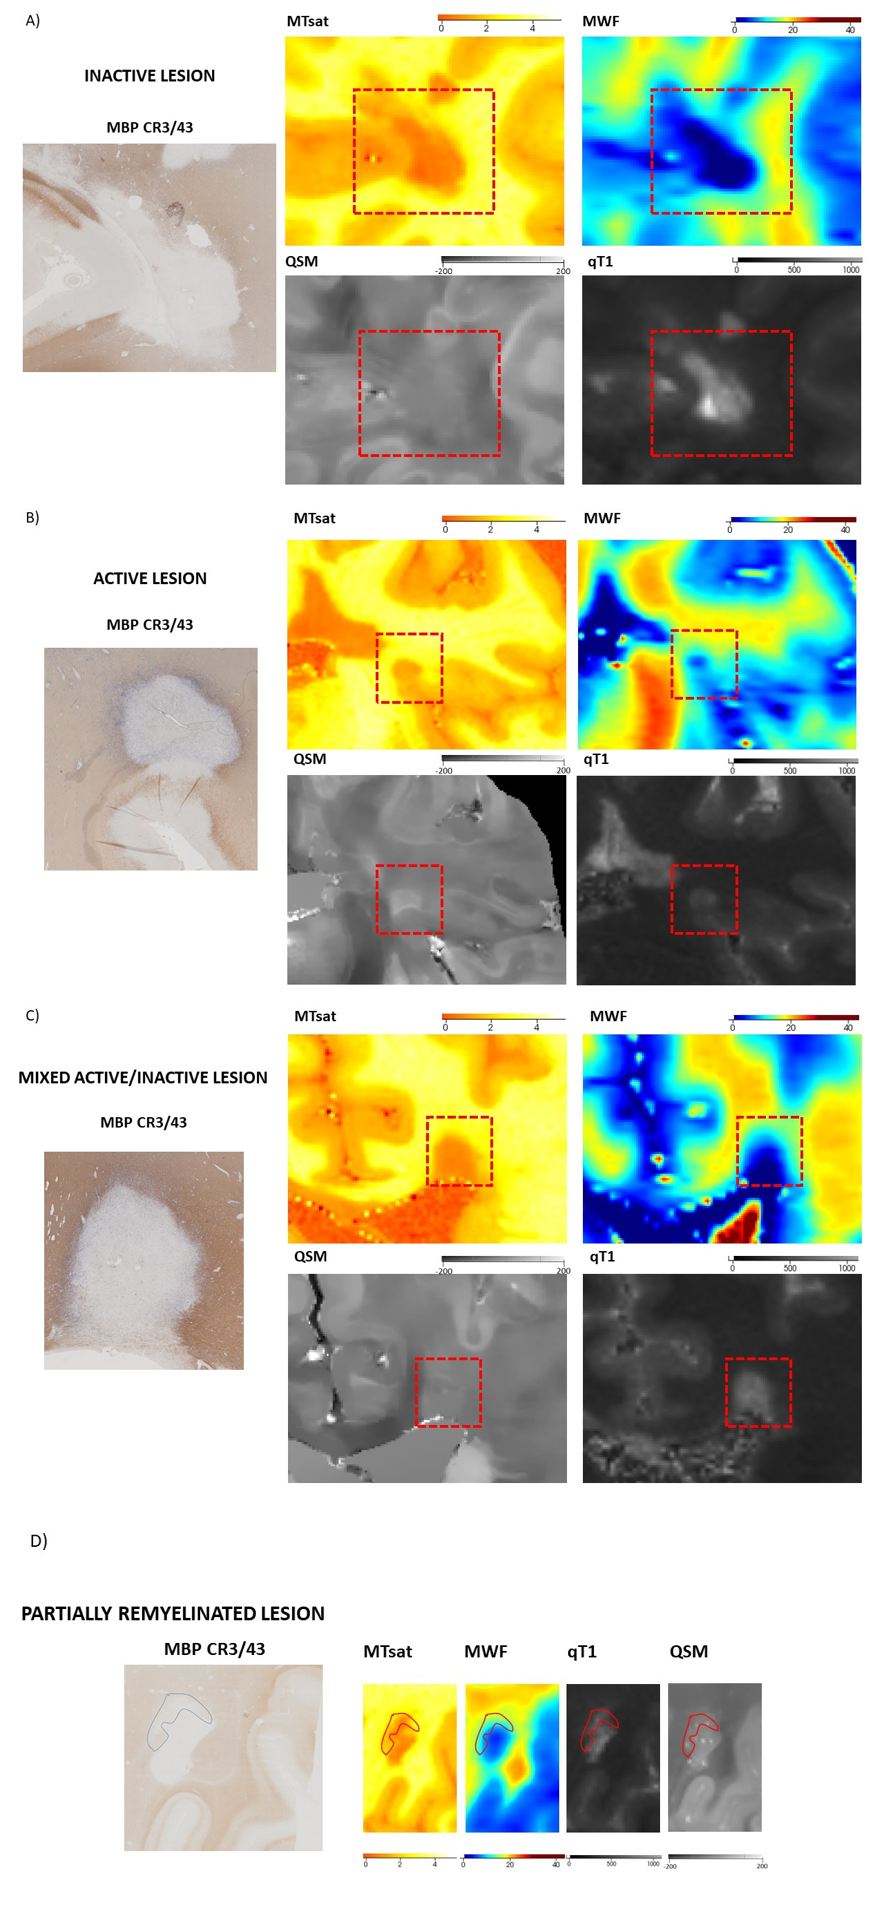
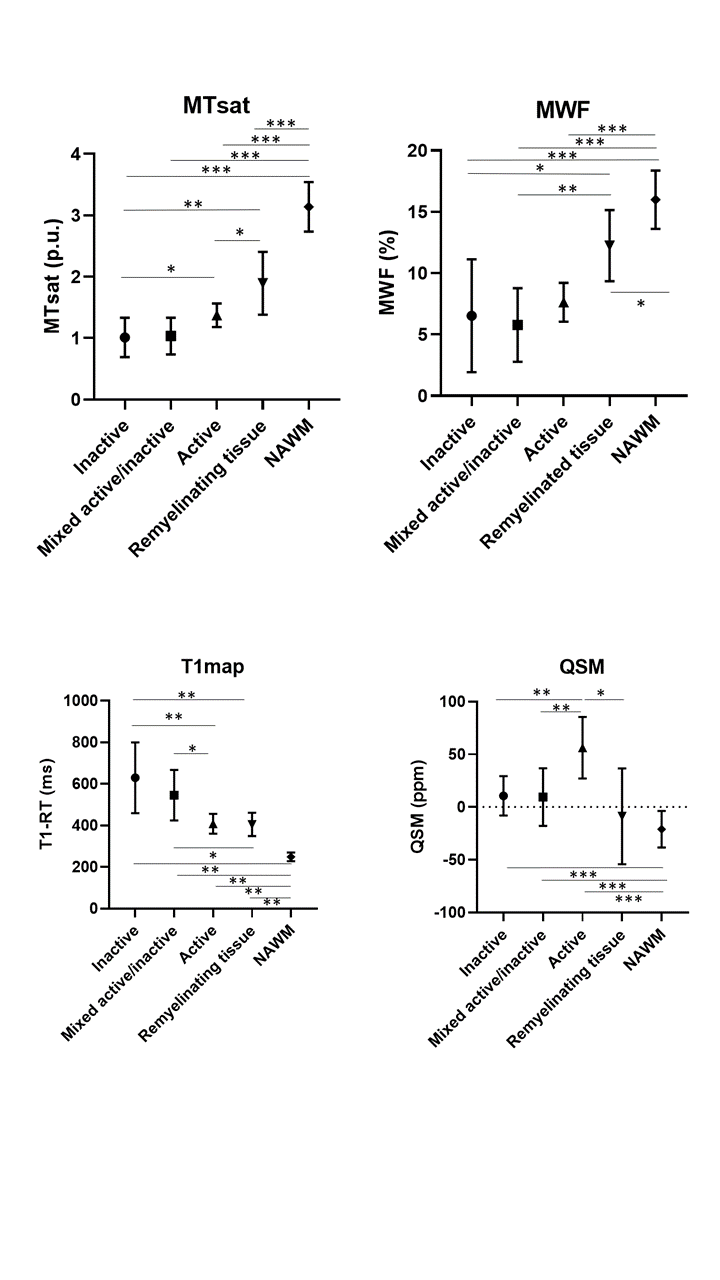
We identified 34 WM lesions in 3D-EPI images that corresponded histopathologically to 11 chronic-inactive lesion, 11 chronic-active lesions, 6 active lesions, and 6 remyelinated lesions/lesion areas (3 shadow plaques and remyelinated regions at the border of 3 different lesions), Figure 1. We also identified 13 regions of normal appearing tissue in the proximity of the lesions. The Kruskal-Wallis test indicated significant differences among lesion types for each quantitative measure (MTsat corr-p=0.004, MWF corr-p=0.04, qT1 corr-p= 0.02, QSM corr-p=0.04). Post hoc Mann-Whitney U test exhibited significantly higher MTsat and MWF, and lower qT1 and susceptibility in remyelinated tissue compared to other lesion types (Figure 2). Inactive and mixed active/inactive lesions showed the lowest MTsat and MWF and the highest qT1 (Figure 2). Active lesions were characterized by having the highest QSM among all lesion categories and exhibited only minor increase of qT1 (Figure 2).Discussion
Postmortem quantitative multiparametric MRI distinguishes different histopathological MS lesion types. Specifically, remyelinated areas exhibited higher MTsat, MWF and lower qT1 than other lesions subtypes and comparable to the measures in normal-appearing tissue, pointing at an effective repair of the damaged tissue. High QSM values were a distinctive trait of active lesions, probably reflecting the pronounced myelin damage and increased iron content and/or the diffuse presence of activated microglia/macrophages. Interestingly, inactive and mixed active/inactive lesions showed the highest level of damage based on the overall information obtained with the applied quantitative MRI measures, but very heterogeneous characteristics in MWF and qT1 maps. This may point at a different sensitivity to the presence of a heterogeneous tissue damage in these lesion types, or – although less plausible- to more evident partial-volume effects in MWF and T1 maps compared to MTsat and QSM.Conclusion
Quantitative MRI measures obtained postmortem allow to characterize the histological heterogeneity of different MS lesion types. Further work will aim at better understanding the relative sensitivity and specificity of the applied quantitative MRI maps to the specific tissue characteristics across MS lesion types.Acknowledgements
No acknowledgement found.References
1) Kuhlmann, T., Ludwin, S., Prat, A., Antel, J., Brück, W., Lassmann, H., 2017. An updated histological classification system for multiple sclerosis lesions. Acta Neuropathol. (Berl.) 133, 13–24.
2) Lassmann H., Bruck W., Lucchinetti C., Rodriguez M. Remyelination in multiple sclerosis. Mult. Scler. 1997;3:133–136. Review.
3) Cristina Granziera, Jens Wuerfel, Frederik Barkhof, Massimiliano Calabrese, Nicola De Stefano, Christian Enzinger, Nikos Evangelou, Massimo Filippi, Jeroen J.G. Geurts, Daniel S. Reich, Maria A. Rocca, Stefan Ropele, Àlex Rovira, Pascal Sati, Ahmed T. Toosy, Hugo Vrenken, Claudia A. M. Gandini Wheeler-Kingshott, and Ludwig Kappos on behalf of the MAGNIMS Study Group. Quantitative magnetic resonance imaging towards clinical application in multiple sclerosis. Brain 2020, Accepted
4) Marques JP, Kober T, Krueger G, van der Zwaag W, Van de Moortele P-F, Gruetter R. MP2RAGE, a self bias-field corrected sequence for improved segmentation and T1-mapping at high field. NeuroImage. 2010 Jan 15;49(2):1271–81
5) Matthias Weigel, Riccardo Galbusera, Reza Rahmanzadeh, Muhamed Barakovic, Po-Jui Lu, Ludwig Kappos, Wolfgang Brück, Tobias Kober, Peter Dechent, and Cristina Granziera. Postmortem Whole-Brain MP2RAGE Optimization at 3T: A New Imaging Window into Multiple Sclerosis Cortical Pathology. Proceedings of the ISMRM 2020, p. 1759.
6) hMRI - A toolbox for quantitative MRI in neuroscience and clinical research. Tabelow K, Balteau E, Ashburner J, Callaghan MF, Draganski B, Helms G, Kherif F, Leutritz T, Lutti A, Phillips C, Reimer E, Ruthotto L, Seif M, Weiskopf N, Ziegler G, Mohammadi S. Neuroimage. 2019 Jul 1;194:191-210. doi: 10.1016/j.neuroimage.2019.01.029. Epub 2019 Jan 21.
7) Nguyen, T.D., Deh, K., Monohan, E., Pandya, S., Spincemaille, P., Raj, A., Wang, Y., Gauthier, S.A., 2016. Feasibility and reproducibility of whole brain myelin water mapping in 4 minutes using fast acquisition with spiral trajectory and adiabatic T2prep (FAST-T2) at 3T. Magn. Reson. Med. 76, 456–465.
8) Liu T, Xu W, Spincemaille P, Avestimehr AS, Wang Y. Accuracy of the morphology enabled dipole inversion (MEDI) algorithm for quantitative susceptibility mapping in MRI. IEEE Trans Med Imaging 2012; 31(3): 816-24.
9) Absinta, Martina, et al. "Postmortem magnetic resonance imaging to guide the pathologic cut: individualized, 3-dimensionally printed cutting boxes for fixed brains." Journal of Neuropathology & Experimental Neurology 73.8 (2014): 780-788.
10) Yushkevich PA, Piven J, Hazlett HC, et al. User-guided 3D active contour segmentation of anatomical structures: significantly improved efficiency and reliability. NeuroImage. 2006;31(3):1116–1128.
Figures