0489
Damage of Different CNS Compartments Contributes to Explain Multiple Sclerosis Disability Milestones: A Multicenter Study
Paola Valsasina1, Milagros Hidalgo de la Cruz1, Alessandro Meani1, Claudio Gobbi2,3, Antonio Gallo4, Chiara Zecca2,3, Alvino Bisecco4, Maria A. Rocca1,5,6, and Massimo Filippi1,5,6,7,8
1Neuroimaging Research Unit, Division of Neuroscience, IRCCS San Raffaele Scientific Institute, Milan, Italy, 2Multiple Sclerosis Center, Department of Neurology, Neurocenter of Southern Switzerland, Civic Hospital, Lugano, Switzerland, 3Faculty of Biomedical Sciences, Università della Svizzera Italiana, Lugano, Switzerland, 4Department of Advanced Medical and Surgical Sciences, and 3T MRI Center, University of Campania “Luigi Vanvitelli”, Naples, Italy, 5Neurology Unit, IRCCS San Raffaele Scientific Institute, Milan, Italy, 6Vita-Salute San Raffaele University, Milan, Italy, 7Neurorehabilitation Unit, IRCCS San Raffaele Scientific Institute, Milan, Italy, 8Neurophysiology Service, IRCCS San Raffaele Scientific Institute, Milan, Italy
1Neuroimaging Research Unit, Division of Neuroscience, IRCCS San Raffaele Scientific Institute, Milan, Italy, 2Multiple Sclerosis Center, Department of Neurology, Neurocenter of Southern Switzerland, Civic Hospital, Lugano, Switzerland, 3Faculty of Biomedical Sciences, Università della Svizzera Italiana, Lugano, Switzerland, 4Department of Advanced Medical and Surgical Sciences, and 3T MRI Center, University of Campania “Luigi Vanvitelli”, Naples, Italy, 5Neurology Unit, IRCCS San Raffaele Scientific Institute, Milan, Italy, 6Vita-Salute San Raffaele University, Milan, Italy, 7Neurorehabilitation Unit, IRCCS San Raffaele Scientific Institute, Milan, Italy, 8Neurophysiology Service, IRCCS San Raffaele Scientific Institute, Milan, Italy
Synopsis
Here, we assessed damage of cortex, deep grey matter, cerebellum and cervical cord to determine their relative contributions to the main clinical disability (EDSS) milestones in a multicentre cohort of 198 multiple sclerosis (MS) patients. The main determinants of EDSS=3.0 were cervical cord and thalamic atrophy, and brain lesion burden. The EDSS=4.0 milestone was better explained by cortical atrophy, together with cord and cerebellar damage, while the only predictor of EDSS=6.0 was cervical cord damage. This study is shading light on the differential weight of inflammatory and neurodegenerative processes leading to disability accumulation across various MS disease phases.
Introduction
In multiple sclerosis (MS), inflammation and neurodegeneration involve several cortical and subcortical central nervous system (CNS) structures [1]. However, the contribute of each compartment to MS clinical disability across the various phases of the disease has not been fully elucidated yet. Aim of this study was to perform a multiparametric assessment of cortical, deep (D) grey matter (GM), cerebellar and cervical cord damage and determine their relative contributions to the main disability milestones of MS.Methods
3T brain and cervical cord T2- and 3D T1-weigthed images were acquired from 198 MS patients (139 relapsing-remitting [RR] MS, 59 progressive [P] MS) and 67 healthy controls (HC) at three European sites. Brain and cervical cord lesion burden, cortical thickness (CTh) [2], whole-GM [3], DGM (FSL FISRT [4]) and cerebellar volumetry (SPM12 SUIT tool), as well as cord cross-sectional area (CSA) [5] were quantified (Figure 1). Random forest analyses identified predictors of the expanded disability status scale (EDSS) score and determined the main contributors to different disability milestones (EDSS=3.0, 4.0 and 6.0).Results
Compared to HC, MS patients had widespread atrophy in all investigated compartments (p=range <0.001-0.05). In MS patients, lower cord CSA, higher number of cord lesions and reduced whole-GM volume predicted the EDSS score (out-of-bag R2=0.59, p range=<0.001-0.003, Figure 2). The main determinants of an EDSS score=3.0 were reduced cord CSA, higher brain lesion volume and thalamic atrophy, together with smaller whole-GM and cerebellar volumes (out-of-bag accuracy=0.81, p range=<0.001-0.04, Figure 2). Conversely, reaching an EDSS score=4.0 was mainly predicted by reduced whole-GM volume and cord area, reduced CTh of the frontal and sensorimotor cortices, a higher number of cord lesions and higher cerebellar and DGM atrophy (out-of-bag accuracy=0.84, p range=<0.001-0.04, Figure 2). Finally, a lower cord CSA (p=0.001) and higher number of cord lesions (p=0.003) were the only predictors of EDSS=6.0 (out-of-bag accuracy=0.83, Figure 2).Discussion
This is one of the first studies performing a multiparametric assessment of damage in different cortical and subcortical CNS compartments, and defining, using random forest techniques, which are the most relevant MRI correlates of the main clinical disability milestones in multiple sclerosis. The main determinants of an EDSS score=3.0 were cervical cord and thalamic atrophy, together with brain lesion burden. This suggests a major contribution to disability of brain neuroinflammation and of selective atrophy in sensorimotor structures at early disease stages. The EDSS=4.0 milestone was better explained by cortical GM atrophy, together with cord and cerebellar damage, supporting the idea that neurodegenerative processes may start to give a major contribution to disability at later disease stages. Finally, the only predictor of an EDSS=6.0 was cervical cord damage, reinforcing the notion that a widespread injury in this structure is strongly associated with severe locomotor impairment.Conclusions
Random forest analyses identified the peculiar contribution of each CNS compartment to different EDSS milestones. While lesion burden, brain GM and thalamic atrophy were the main determinants of EDSS=3.0 and 4.0, cervical cord damage was predominant to explain an EDSS=6.0.Acknowledgements
Funding. This project has been supported by a research grant from the Fondazione Italiana Sclerosi Multipla (FISM2018/R/5), and financed or co-financed with the ‘5 per mille’ public funding.References
[1] Filippi M, Bar-Or A, Piehl F, Preziosa P, Solari A, Vukusic S, Rocca MA. Multiple sclerosis. Nat Rev Dis Primers 2018; 4(1):43. [2] Fischl B, Dale AM. Measuring the thickness of the human cerebral cortex from magnetic resonance images. Proceedings of the National Academy of Sciences of the United States of America 2000;97:11050-11055. [3] Smith SM, Zhang Y, Jenkinson M, Chen J, Matthews PM, Federico A, De Stefano N. Accurate, robust and automated longitudinal and cross-sectional brain change analysis. Neuroimage 2002;17:479-489. [4] Patenaude B, Smith SM, Kennedy DN, Jenkinson M. A Bayesian model of shape and appearance for subcortical brain segmentation. NeuroImage 2011;56:907-922. [5] Horsfield MA, Sala S, Neema M, et al. Rapid semi-automatic segmentation of the spinal cord from magnetic resonance images: application in multiple sclerosis. NeuroImage 2010;50:446-455.Figures

Figure
1.
Calculation of the different CNS compartments in a study subject. A) Global
brain volumetry (FSL SIENAx); B) Cortical thickness (Freesurfer) and
related cortical parcellation using Desikan atlas; C) Deep grey matter volume (FSL FIRST); D) Cerebellar volumes (SPM12 SUIT); and
E) Cervical cord segmentation (Jim software, active surface method). Each colour represents a different compartment for each
subgroup of images. Abbreviations: CTh=cortical thickness; GM=grey matter;
AS=active surface; A=anterior; P=posterior; S=superior; I=inferior; L=left;
R=right.
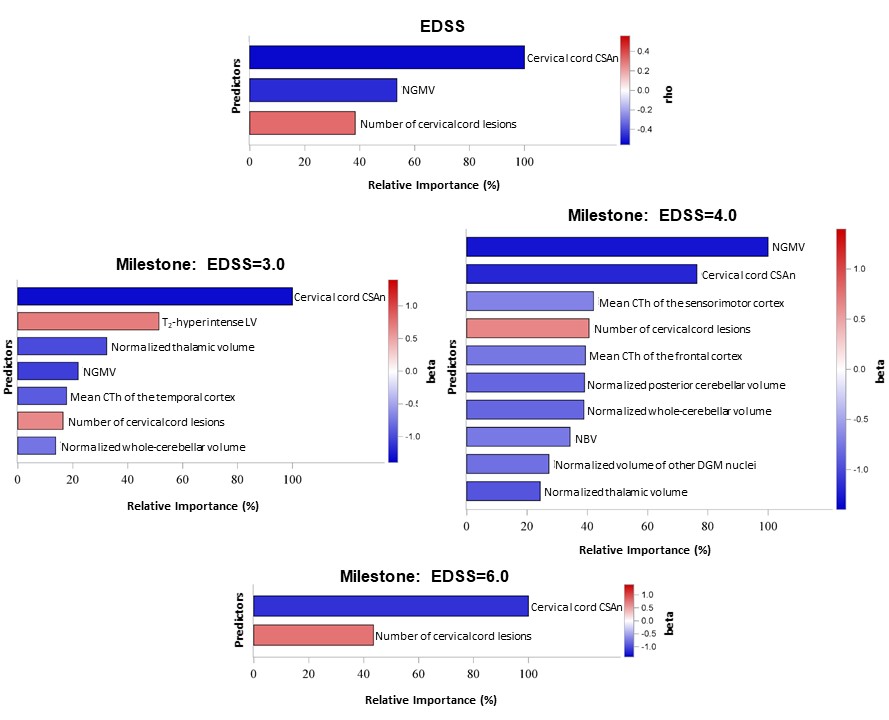
Figure
2. Bar charts showing relative importance of MRI
predictors of EDSS score, and of reaching different EDSS milestone (3.0, 4.0, 6.0),
in MS patients selected with random forest analyses (p<0.05). Colors reflect
the magnitude of Spearman’s correlation of each predictor with EDSS score. Standardized
beta coefficient from univariate logistic regression models is represented for
classification models. NGMV=normalized
grey matter volume; NBV=normalized brain volume; CTh=cortical thickness;
CSAn=normalized cross-cross sectional area; DGM=deep grey matter