0488
Toward Fully Automated Assessment of the Central Vein Sign Using Deep Learning1Advanced Clinical Imaging Technology, Siemens Healthcare AG, Lausanne, Switzerland, 2Department of Radiology, Lausanne University Hospital and University of Lausanne, Lausanne, Switzerland, 3Signal Processing Laboratory (LTS 5), Ecole Polytechnique Fédérale de Lausanne (EPFL), Lausanne, Switzerland, 4Translational Neuroradiology Section, National Institute of Neurological Disorders and Stroke, National Institutes of Health (NIH), Bethesda, MD, United States, 5Department of Neurology, Lausanne University Hospital and University of Lausanne, Lausanne, Switzerland, 6Cliniques universitaires Saint-Luc, Université catholique de Louvain, Brussels, Belgium, 7Neurologic Clinic and Policlinic, Departments of Medicine, Clinical Research and Biomedical Engineering, University Hospital Basel and University of Basel, Basel, Switzerland, 8Translational Imaging in Neurology (ThINk) Basel, Department of Medicine and Biomedical Engineering, University Hospital Basel and University of Basel, Basel, Switzerland, 9Research Center for Clinical Neuroimmunology and Neuroscience (RC2NB) Basel, University Hospital Basel and University of Basel, Basel, Switzerland, 10Medical Image Analysis Laboratory (MIAL), Centre d'Imagerie BioMédicale (CIBM), University of Lausanne, Lausanne, Switzerland, 11Department of Neurology, Cedars-Sinai Medical Center, Los Angeles, CA, United States
Synopsis
The fraction of white matter lesions exhibiting the central vein sign (CVS) has shown promise as a biomarker in the diagnosis of multiple sclerosis. As manual CVS assessment is not clinically feasible, automated solutions have been proposed to perform this task. A deep-learning-based method called “CVSnet” demonstrated effective and accurate discrimination of MS from its mimics but required manual pre-selection. This work extends CVSnet to allow fully automated CVS assessment without manual interaction. High-quality, expert-reviewed segmentations of almost 6300 lesions were used for training and testing. The proposed method achieved accuracies between 75% and 80% in an unseen testing set.
Introduction
In recent years, several studies have shown the feasibility to distinguish multiple sclerosis (MS) from other mimicking diseases by assessing the fraction of brain white matter lesions that exhibit a central vein, a characteristic referred to as the central vein sign (CVS) (1–4). While this method could support differential diagnosis and ultimately treatment decisions, manual CVS assessment can be tedious and very time-consuming, making it unfeasible in clinical routine. To address this problem, a deep-learning prototype method for automated CVS assessment in brain lesions, called “CVSnet”, was recently introduced and demonstrated effective and accurate discrimination of MS from its mimics (5,6). However, this method was trained on and solely predicted focal lesions displaying the central vein sign (CVS+) or not (CVS−), but did not account for so-called “excluded lesions” (CVSe), as defined by the NAIMS criteria (7). CVSe lesions are confluent or have either eccentric or multiple veins, and should not be considered when calculating the fraction of CVS+ lesions. A manual pre-selection step was thus required to eliminate CVSe prior to running CVSnet. This hindered integration of CVSnet with current lesion segmentation algorithms into a fully automated pipeline. The goal of this work was to improve CVSnet to be able to classify CVS+, CVS−, and CVSe lesions without manual pre-selection, allowing combination with a lesion segmentation algorithm into a fully automated pipeline.Methods
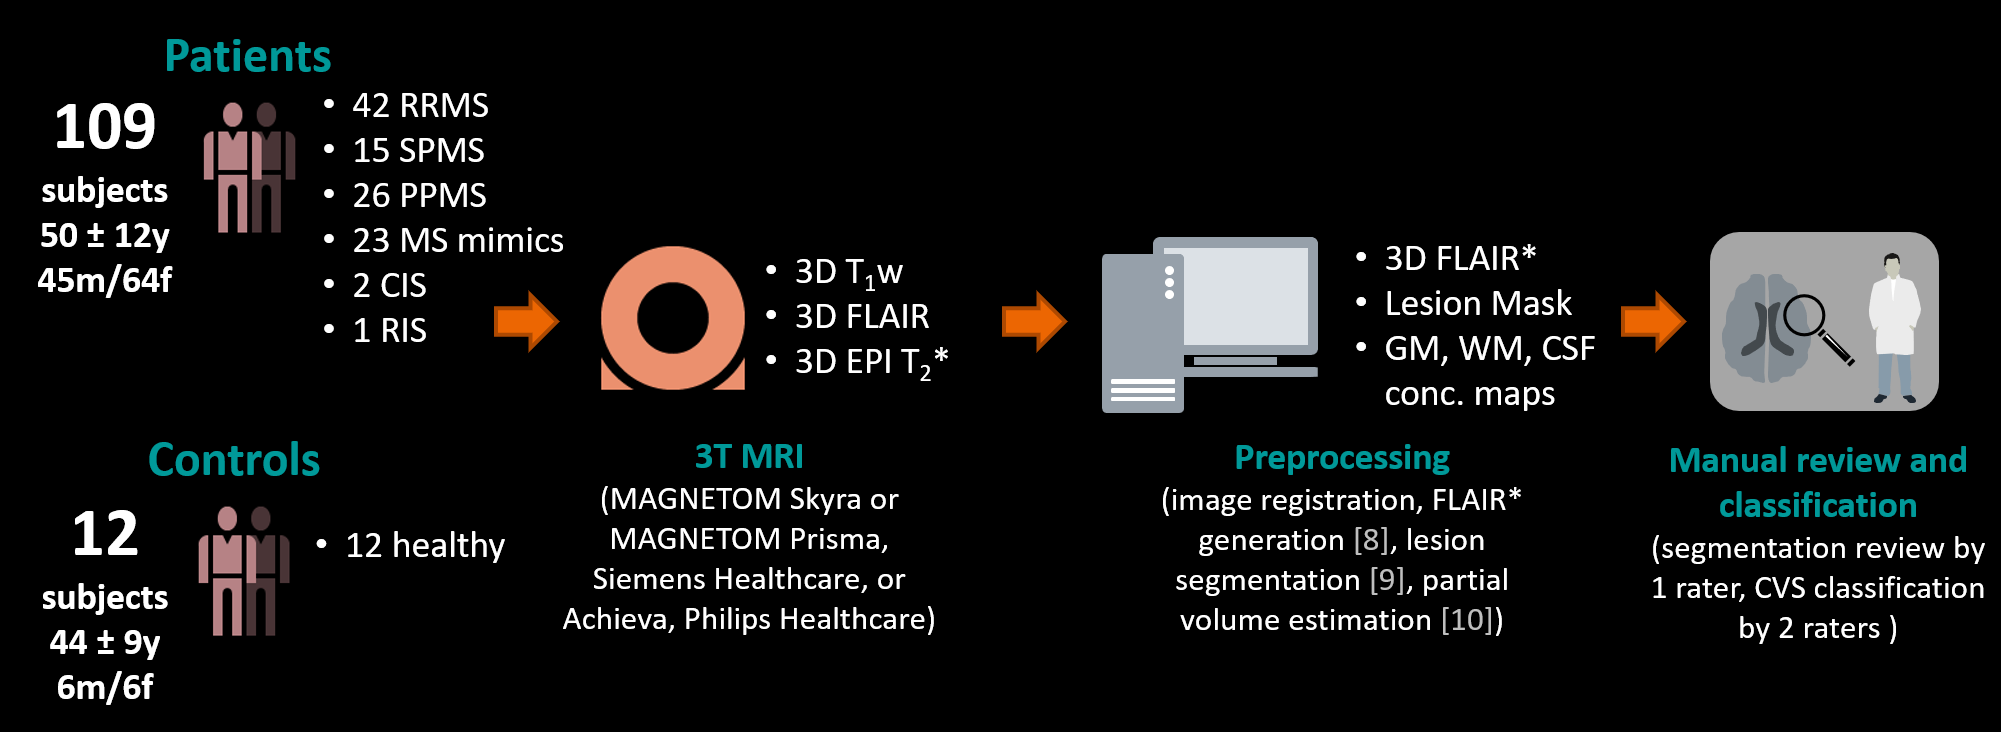
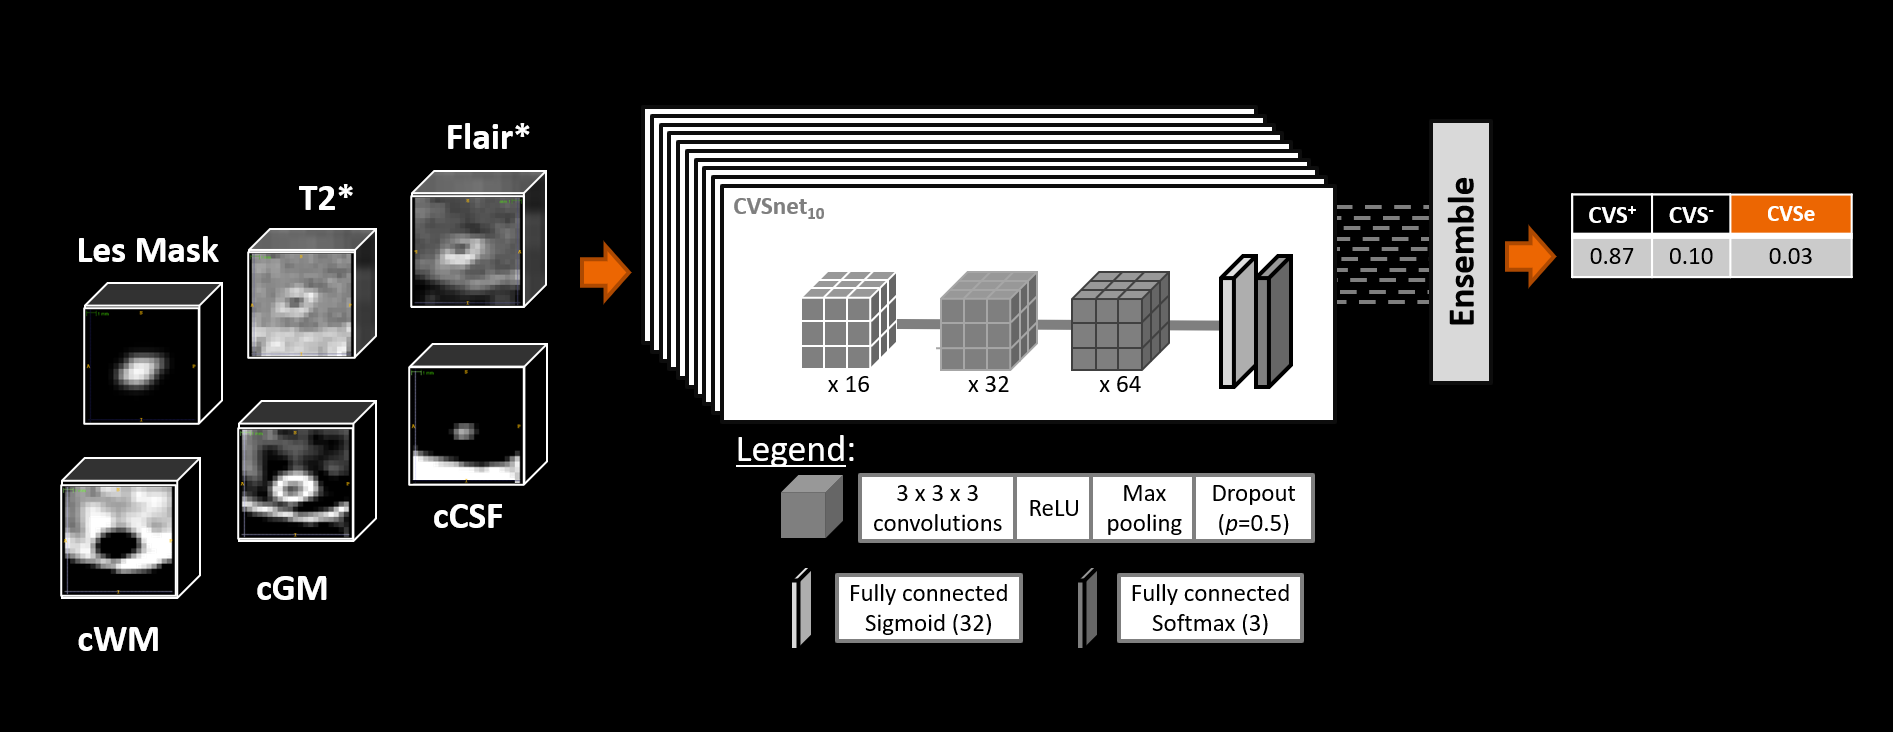
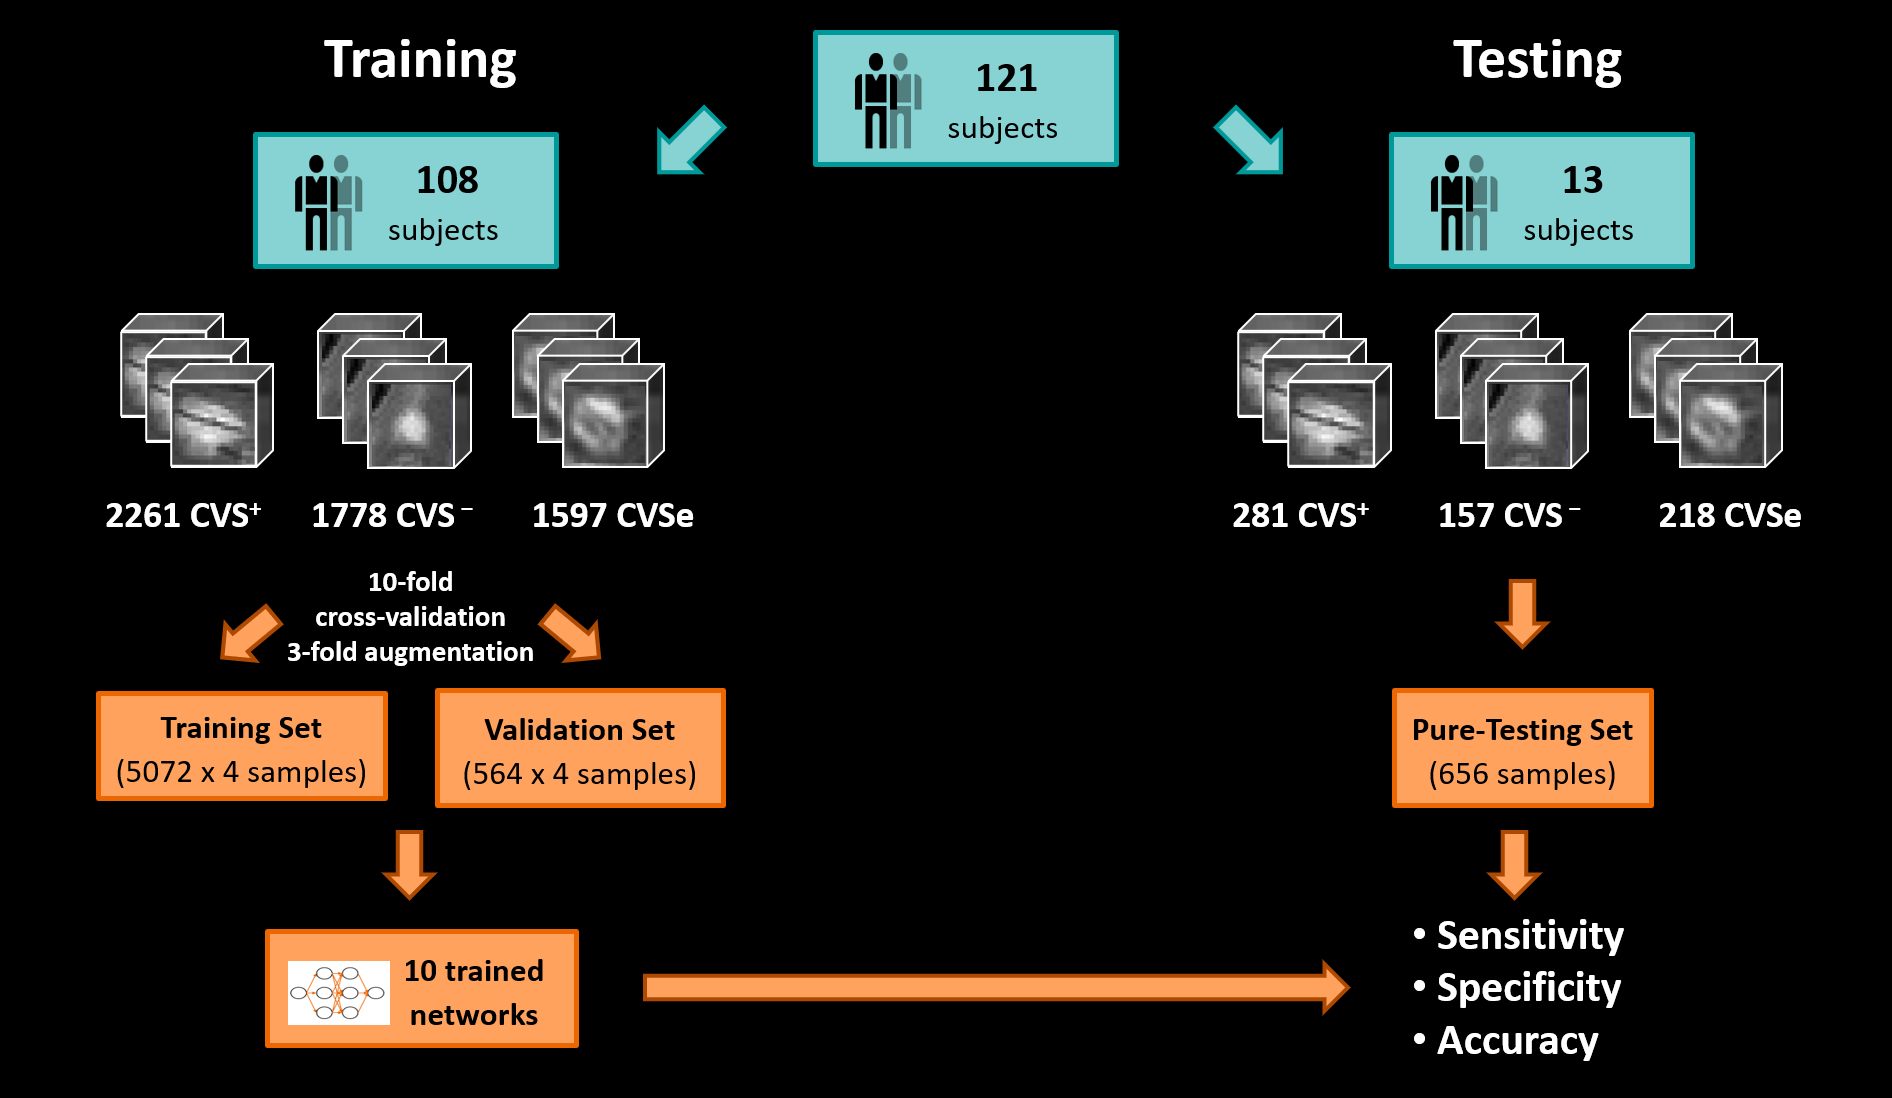
Figure 1 illustrates the workflow. We enrolled 109 patients with an established MS, clinically isolated syndrome (CIS), or radiologically isolated syndrome (RIS) diagnosis (N=86; RRMS 42; SPMS 15; PPMS 26; CIS 2; RIS 1) or with an MS mimic (N=23) (patient mean±SD age: 50±12 years; male/female: 45/64), and 12 healthy controls (mean±SD age: 44±9 years; male/female: 6/6). Subjects underwent 3T brain MRI (MAGNETOM Skyra and MAGNETOM Prisma, Siemens Healthcare, Erlangen, Germany, or Achieva, Philips Healthcare, Best, Netherlands). 3D T1w MPRAGE, 3D T2-FLAIR, and 3D T2*w segmented EPI acquisitions were performed. Images were up-sampled to voxel size (0.55x0.55x0.55)mm3 if needed and rigidly registered to the FLAIR space. FLAIR* images were calculated (8). Brain lesions, including infratentorial, were automatically segmented (9), and quality controlled by a single rater. CVS assessment was conducted on FLAIR* images by two raters, according to the NAIMS guidelines, yielding 2542 CVS+, 1935 CVS−, and 1815 CVSe lesions. A convolutional neural network based on the CVSnet architecture (6) (Figure 2) was trained for different input configurations using a total of 5636 samples (2261 CVS+, 1778 CVS−, and 1597 CVSe) from 108 subjects and evaluated in 656 unseen samples (281 CVS+, 157 CVS−, and 218 CVSe) from 13 unseen subjects (Figure 3). The configurations relied on combinations of the following channels as input: (i) FLAIR*, (ii) T2*, (iii) lesion mask, and (iv) CSF and gray/white matter concentration maps (cCSF, cGM, cWM) obtained from a partial-volume estimation algorithm (10). Training and testing were performed based on small 3D patches extracted around each lesion. The following configurations were tested:A) FLAIR*
B) FLAIR* + T2*
C) FLAIR* + lesion mask
D) FLAIR* + lesion mask + T2*
E) FLAIR* + lesion mask + T2* + cGM + cWM + cCSF
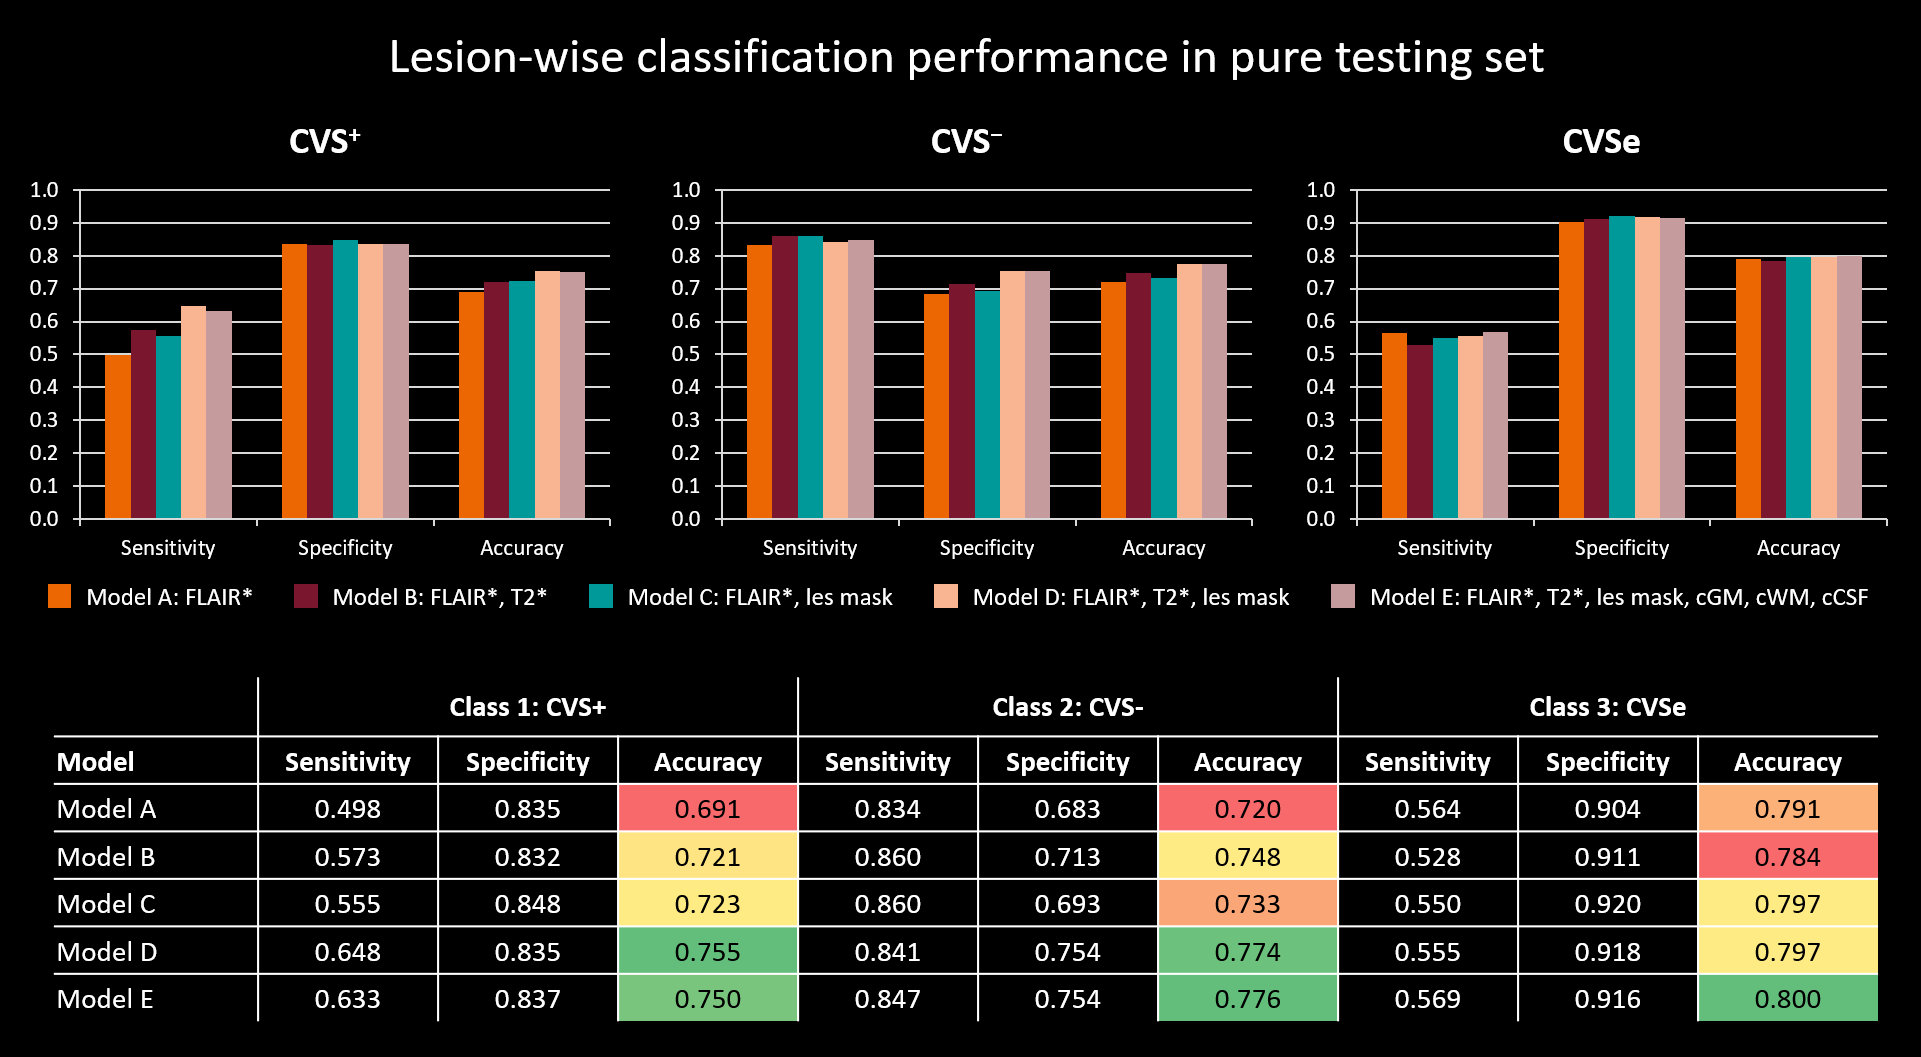
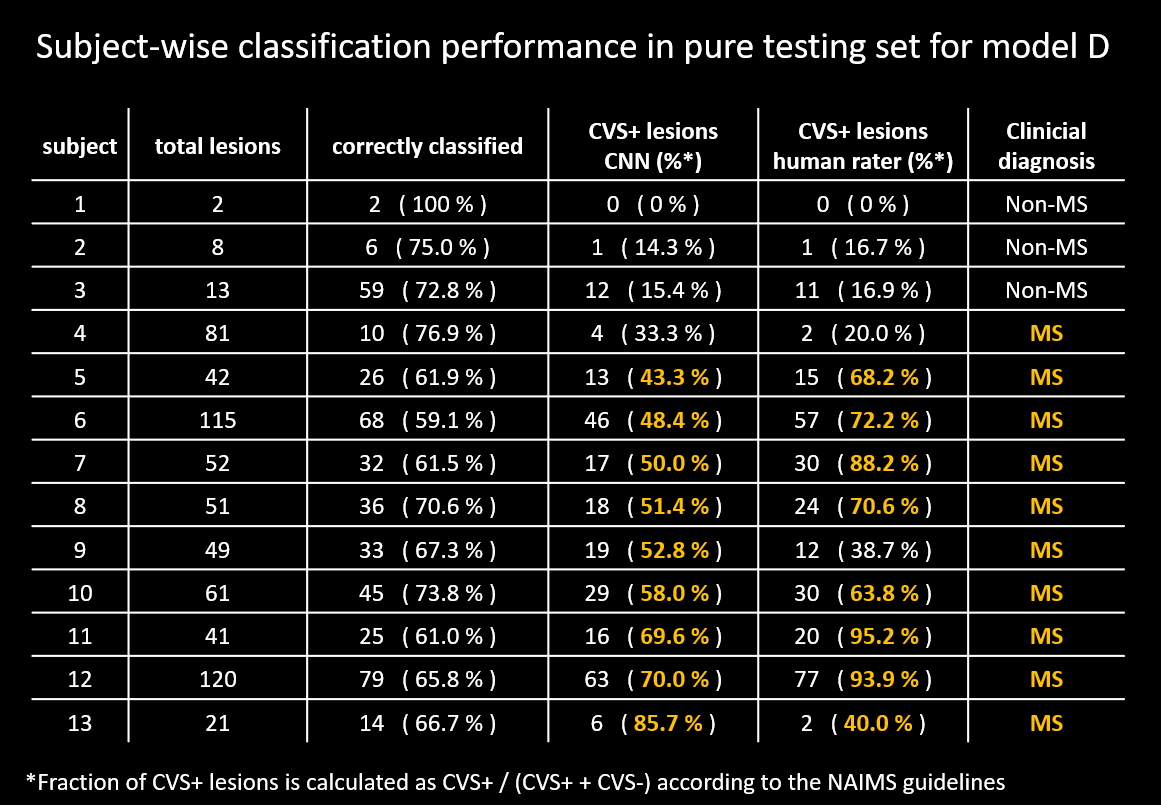
Lesion-wise classification performance was evaluated for all configurations by calculating sensitivity, specificity, and accuracy for each lesion class. Subject-wise classification performance was evaluated for models D and E.
Results
Performance in the pure testing set was overall similar across the tested models, slightly increasing with the number of input channels used (Figure 4). Performance was best for CVSe lesions followed by CVS− and CVS+. Overall best performance was achieved by models D and E with accuracies of 75.5% and 75.0% for CVS+, 77.4% and 77.6% for CVS−, and 79.7% and 80.0% for CVSe lesion types, respectively. The similar performance of models D and E indicates that adding CSF and brain tissue concentration maps did not help the model to distinguish the different CVS lesion types. Even model A, relying only on FLAIR* images, achieved accuracies between 69.1% and 79.1%, indicating that FLAIR* is highly informative for CVS assessment. Subject-wise classification performance was relatively similar across subjects (Table 1). Although CVS+ fraction was overall underestimated by the network, assuming a threshold of ≥40% CVS+ (11), the CNN (models D+E) would have correctly identified all test subjects except one (#4) as MS or non-MS, compared to two MS subjects (#4,#9) being misclassified as non-MS based on the human raters’ assessment.Discussion and Conclusion
We introduced an improved version of the CVSnet (5,6) deep-learning method for automated CVS assessment. Unlike the previous method, the new method can classify all CVS types of lesions, enabling its integration with MS lesion segmentation algorithms. This will allow fully-automated CVS assessment in patients’ brains, speeding up the evaluation of CVS as a diagnostic biomarker for differentiating MS from mimicking diseases. With accuracies of 75% to 80% in the best models, the network performance approaches levels of human inter-rater agreement estimated at 83% (12), an important benchmark when considering an unsupervised application of the method. The similar subject-level performance for cases with few and many lesions underlines the robustness of the method. The consistently higher detected CVS+ lesion fraction in MS cases suggests that the method could support MS diagnosis.Acknowledgements
No acknowledgement found.References
1. Wuerfel J, Sinnecker T, Ringelstein EB, et al. Lesion morphology at 7 Tesla MRI differentiates Susac syndrome from multiple sclerosis. Mult. Scler. J. 2012 doi: 10.1177/1352458512441270.
2. Solomon AJ, Schindler MK, Howard DB, et al. “Central vessel sign” on 3T FLAIR* MRI for the differentiation of multiple sclerosis from migraine. Ann. Clin. Transl. Neurol. 2016 doi: 10.1002/acn3.273.
3. Cortese R, Magnollay L, Tur C, et al. Value of the central vein sign at 3T to differentiate MS from seropositive NMOSD. Neurology 2018 doi: 10.1212/WNL.0000000000005256.
4. Maggi P, Absinta M, Grammatico M, et al. Central vein sign differentiates Multiple Sclerosis from central nervous system inflammatory vasculopathies. Ann. Neurol. 2018 doi: 10.1002/ana.25146.
5. Fartaria MJ. Cvsnet: A deep learning-based approach for automated detection of the central vein sign. Mult. Scler. J. 2019.
6. Maggi P, Fartaria MJ, Jorge J, et al. CVSnet: A machine learning approach for automated central vein sign assessment in multiple sclerosis. NMR Biomed. 2020 doi: 10.1002/nbm.4283.
7. Sati P, Oh J, Todd Constable R, et al. The central vein sign and its clinical evaluation for the diagnosis of multiple sclerosis: A consensus statement from the North American Imaging in Multiple Sclerosis Cooperative. Nat. Rev. Neurol. 2016 doi: 10.1038/nrneurol.2016.166.
8. Sati P, George IC, Shea CD, Gaitán MI, Reich DS. FLAIR*: A combined MR contrast technique for visualizing white matter lesions and parenchymal veins. Radiology 2012 doi: 10.1148/radiol.12120208.
9. Roy S, Butman JA, Reich DS, Calabresi PA, Pham DL. Multiple sclerosis lesion segmentation from brain MRI via fully convolutional neural networks. arXiv: 1803.09172 2018.
10. Roche A, Forbes F. Partial Volume Estimation in Brain MRI Revisited BT - Medical Image Computing and Computer-Assisted Intervention – MICCAI 2014: 17th International Conference, Boston, MA, USA, September 14-18, 2014, Proceedings, Part I. In: Golland P, Hata N, Barillot C, Hornegger J, Howe R, editors. Cham: Springer International Publishing; 2014. pp. 771–778. doi: 10.1007/978-3-319-10404-1_96.
11. Tallantyre EC, Dixon JE, Donaldson I, et al. Ultra-high-field imaging distinguishes MS lesions from asymptomatic white matter lesions. Neurology 2011 doi: 10.1212/WNL.0b013e31820b7630
12. Unpublished data. Small internal study based on two raters and ten MS subjects with a total of 503 lesions (CVS+,CVS-,CVSe). Readers were blinded to the clinical characteristics when reviewing the lesions.
Figures