0487
Grey Matter Cerebrovascular Reactivity in Multiple Sclerosis and its Changes with Immunomodulation: a Breath-Hold BOLD-MRI Study1Department of Neuroscience, Imaging and Clinical Sciences, University G. D'Annunzio of Chieti Pescara, Chieti Scalo, Italy, 2Department of Neurology and Psychiatry, Sapienza University, Rome, Italy
Synopsis
The cerebrovascular system is altered in MS. Using breath-hold BOLD-MRI, we tested whether pharmacological modulation of MS inflammation influences alteration in cerebrovascular reactivity (CVR). We found that CVR increased with immunomodulation and this increase was negatively correlated with pre-treatment CVR, suggesting that cerebrovascular alteration reflects disease activity. Moreover, lower CVR in the pre-treatment phase was associated with lower grey matter volume and this correlation was lost with immunomodulation, indicating an involvement of brain vasculature in neurodegeneration. Given the multiparametric characteristic of BOLD, further studies are warranted to clarify the vascular origin of our findings.
Introduction
The cerebrovascular system is altered in Multiple Sclerosis (MS). Whether this is related to MS tissue damage and reflects a disease trait remains unexplored. It is plausible that an inability of the cerebrovascular system to maintain oxygen supply contributes to tissue damage and mediates neurodegeneration in MS1. MRI-based measurements of cerebrovascular reactivity (CVR), i.e. the ability of the vasculature to constrict and dilate to regulate blood flow (CBF), have the potential to quantify this under-explored aspect of MS2,3. BOLD signal change per unit of variation in end-tidal partial pressure of (Pet)CO2 can be used as a metric of CVR with good signal to noise ratio4. Because BOLD-MRI is sensitive to deoxyhemoglobin (dHb), during an isometabolic stimulation, the effect of CBF on venous saturation makes BOLD monotonic with CBF fractional changes, with a multiplicative coefficient that depends on baseline venous blood volume (CBV) and deoxy-hemoglobin concentration [dHb]5. Here, we mapped BOLD-CVR relying on a breath-hold task6 (hypercapnic stimulation) in MS patients and in matched healthy controls (HC), prior to and during immunomodulation7.Methods
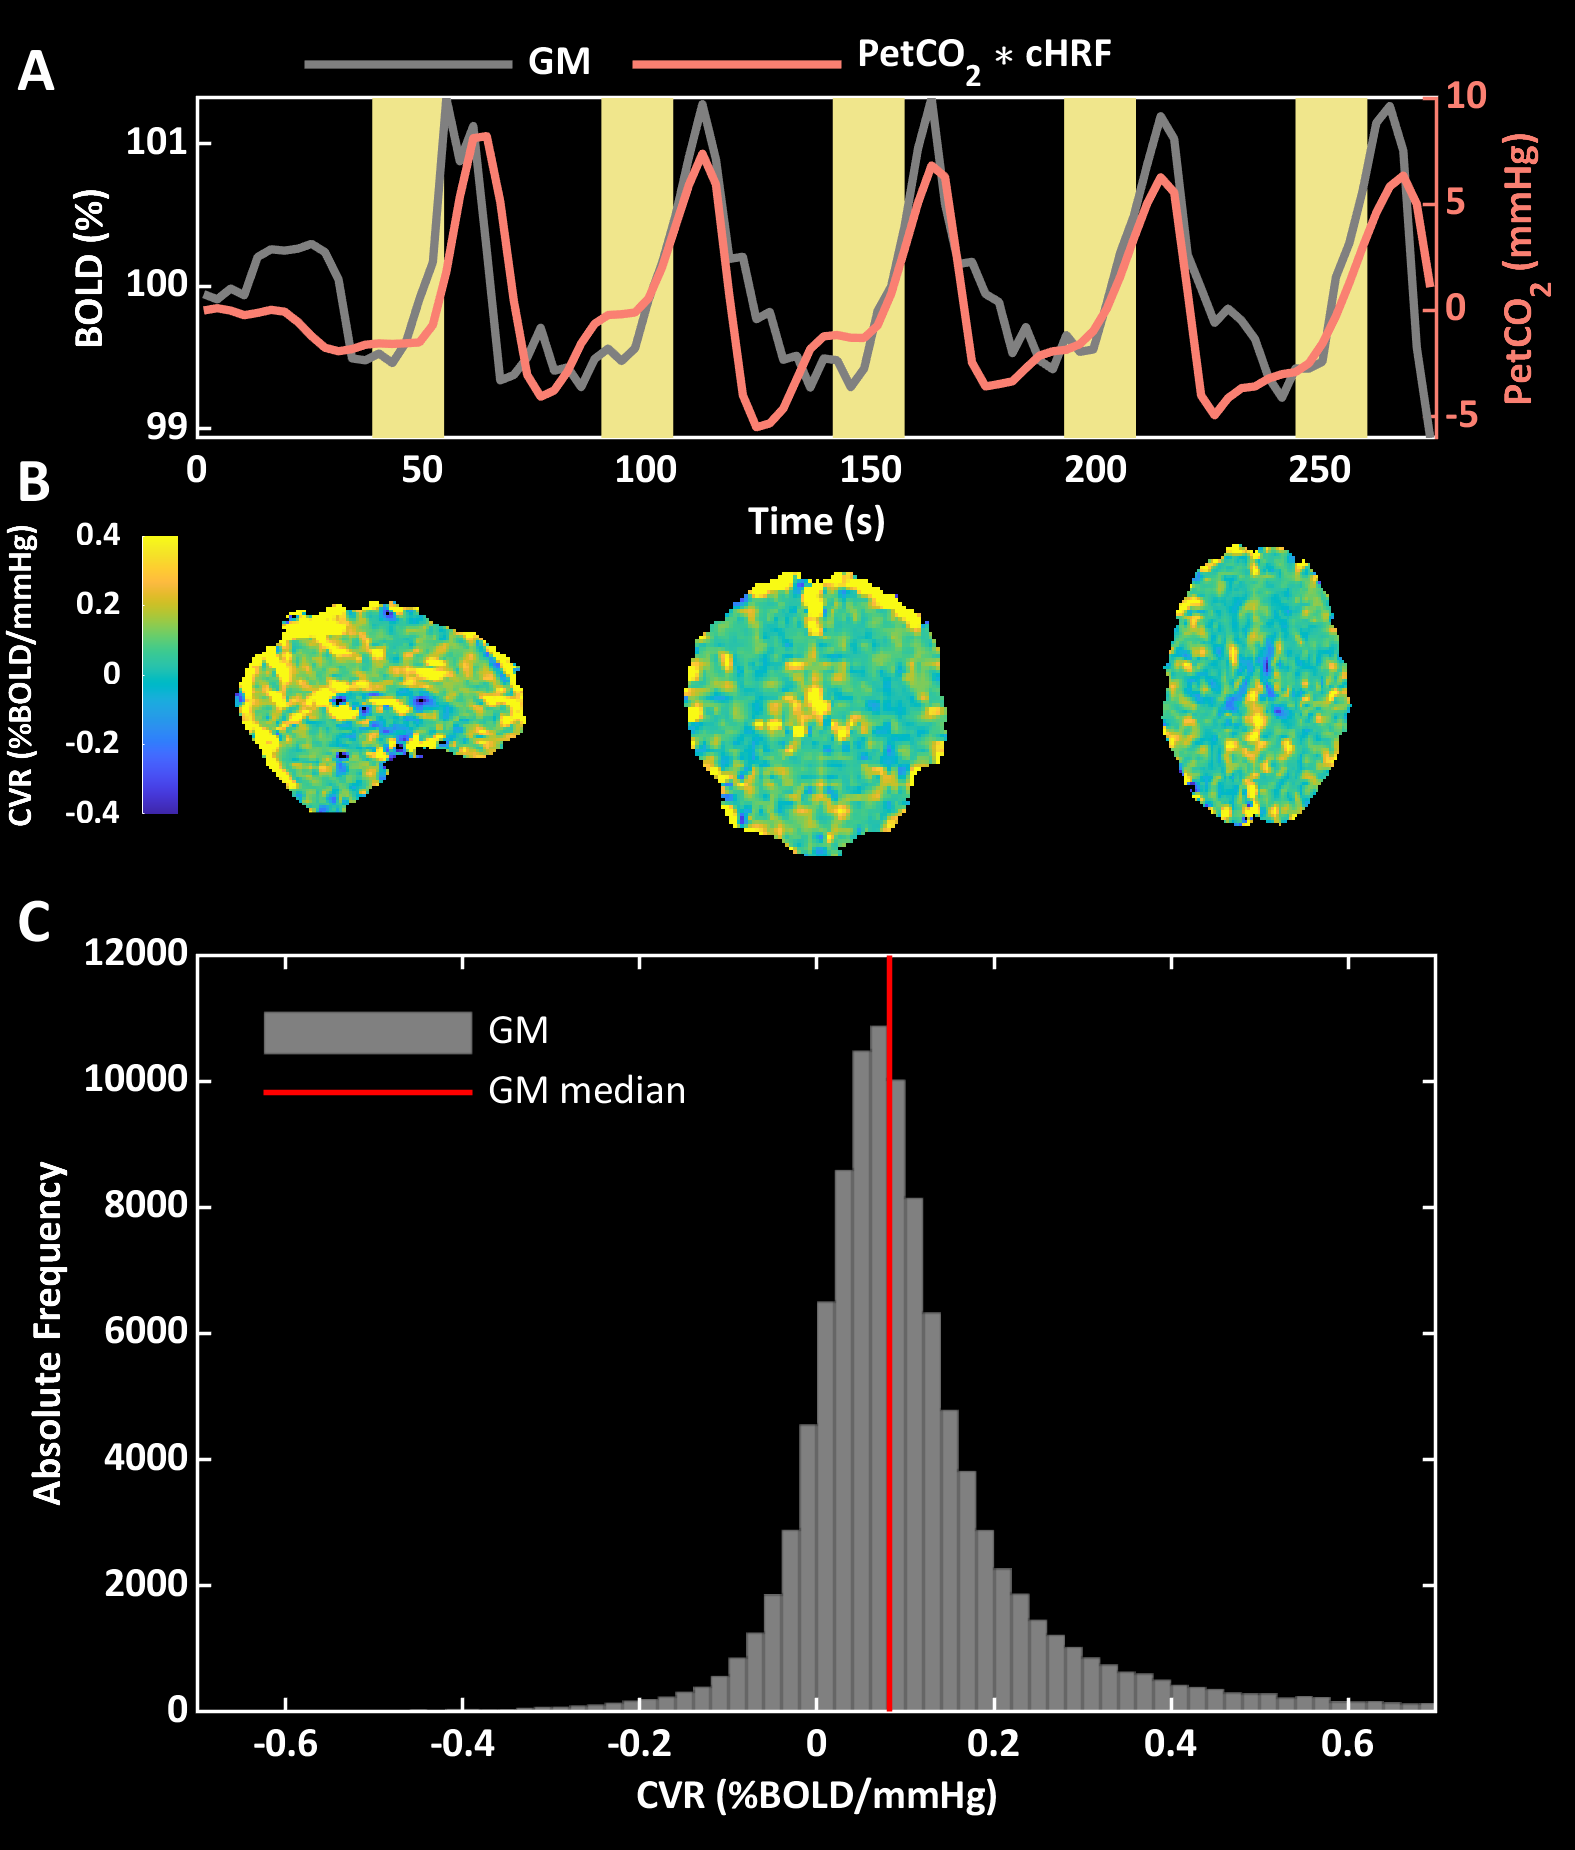
Relapsing-remitting MS patients eligible to start treatment with interferon beta (IFN-β) and matched HC were scanned using a Siemens Magnetom-Verio 3T/70 cm bore magnet. Patients were scanned three times, twice before treatment, and once after 2 months of treatment; HCs were scanned on one occasion only. T1-weighted scans (TR/TE = 1900/2.93ms, 512x512 matrix, FOV 260x260 mm, 176 sagittal slices of 1 mm, flip angle 9°) were acquired for grey matter (GM) volume estimation and for BOLD co-registration. BOLD images included 92 whole-brain T2*-weighted volumes using 2D gradient echo-planar-imaging (EPI, TR/TE = 3000/30 ms, 64x64 matrix, FOV 192x192 mm, 50 transverse 3 mm slices, flip angle 90°). During BOLD acquisition, participants performed 5 breath-holds of 16 seconds, interleaved with 34 seconds of recovery6. CO2 was measured in the expired air via a nasal cannula. T1-weighted images (TR/TE = 550/9.80 ms, 320x320 matrix, FOV 240x240 mm, 25 axial slices of 4 mm, flip angle 9°) were acquired 5 minutes after gadolinium (Gd) administration to assess the presence/absence of Gd-enhancing lesions8. PetCO2 was extracted from CO2 recordings. Structural and functional MRIs were processed using FSL9. CVR maps (expressed in semi-quantitative units of % BOLD/mmHg) were estimated as regression β-weights between canonical HRF10-convolved PetCO2 and BOLD changes (Figure 1a). Global GM CVRs were computed as median values of the β-weights within the GM mask whereas statistical mapping was performed on MNI-warped and smoothed (sigma= 4mm) CVR images. A trained researcher assessed Gd-enhancing lesions on the post-contrast T1-weighted images.Results
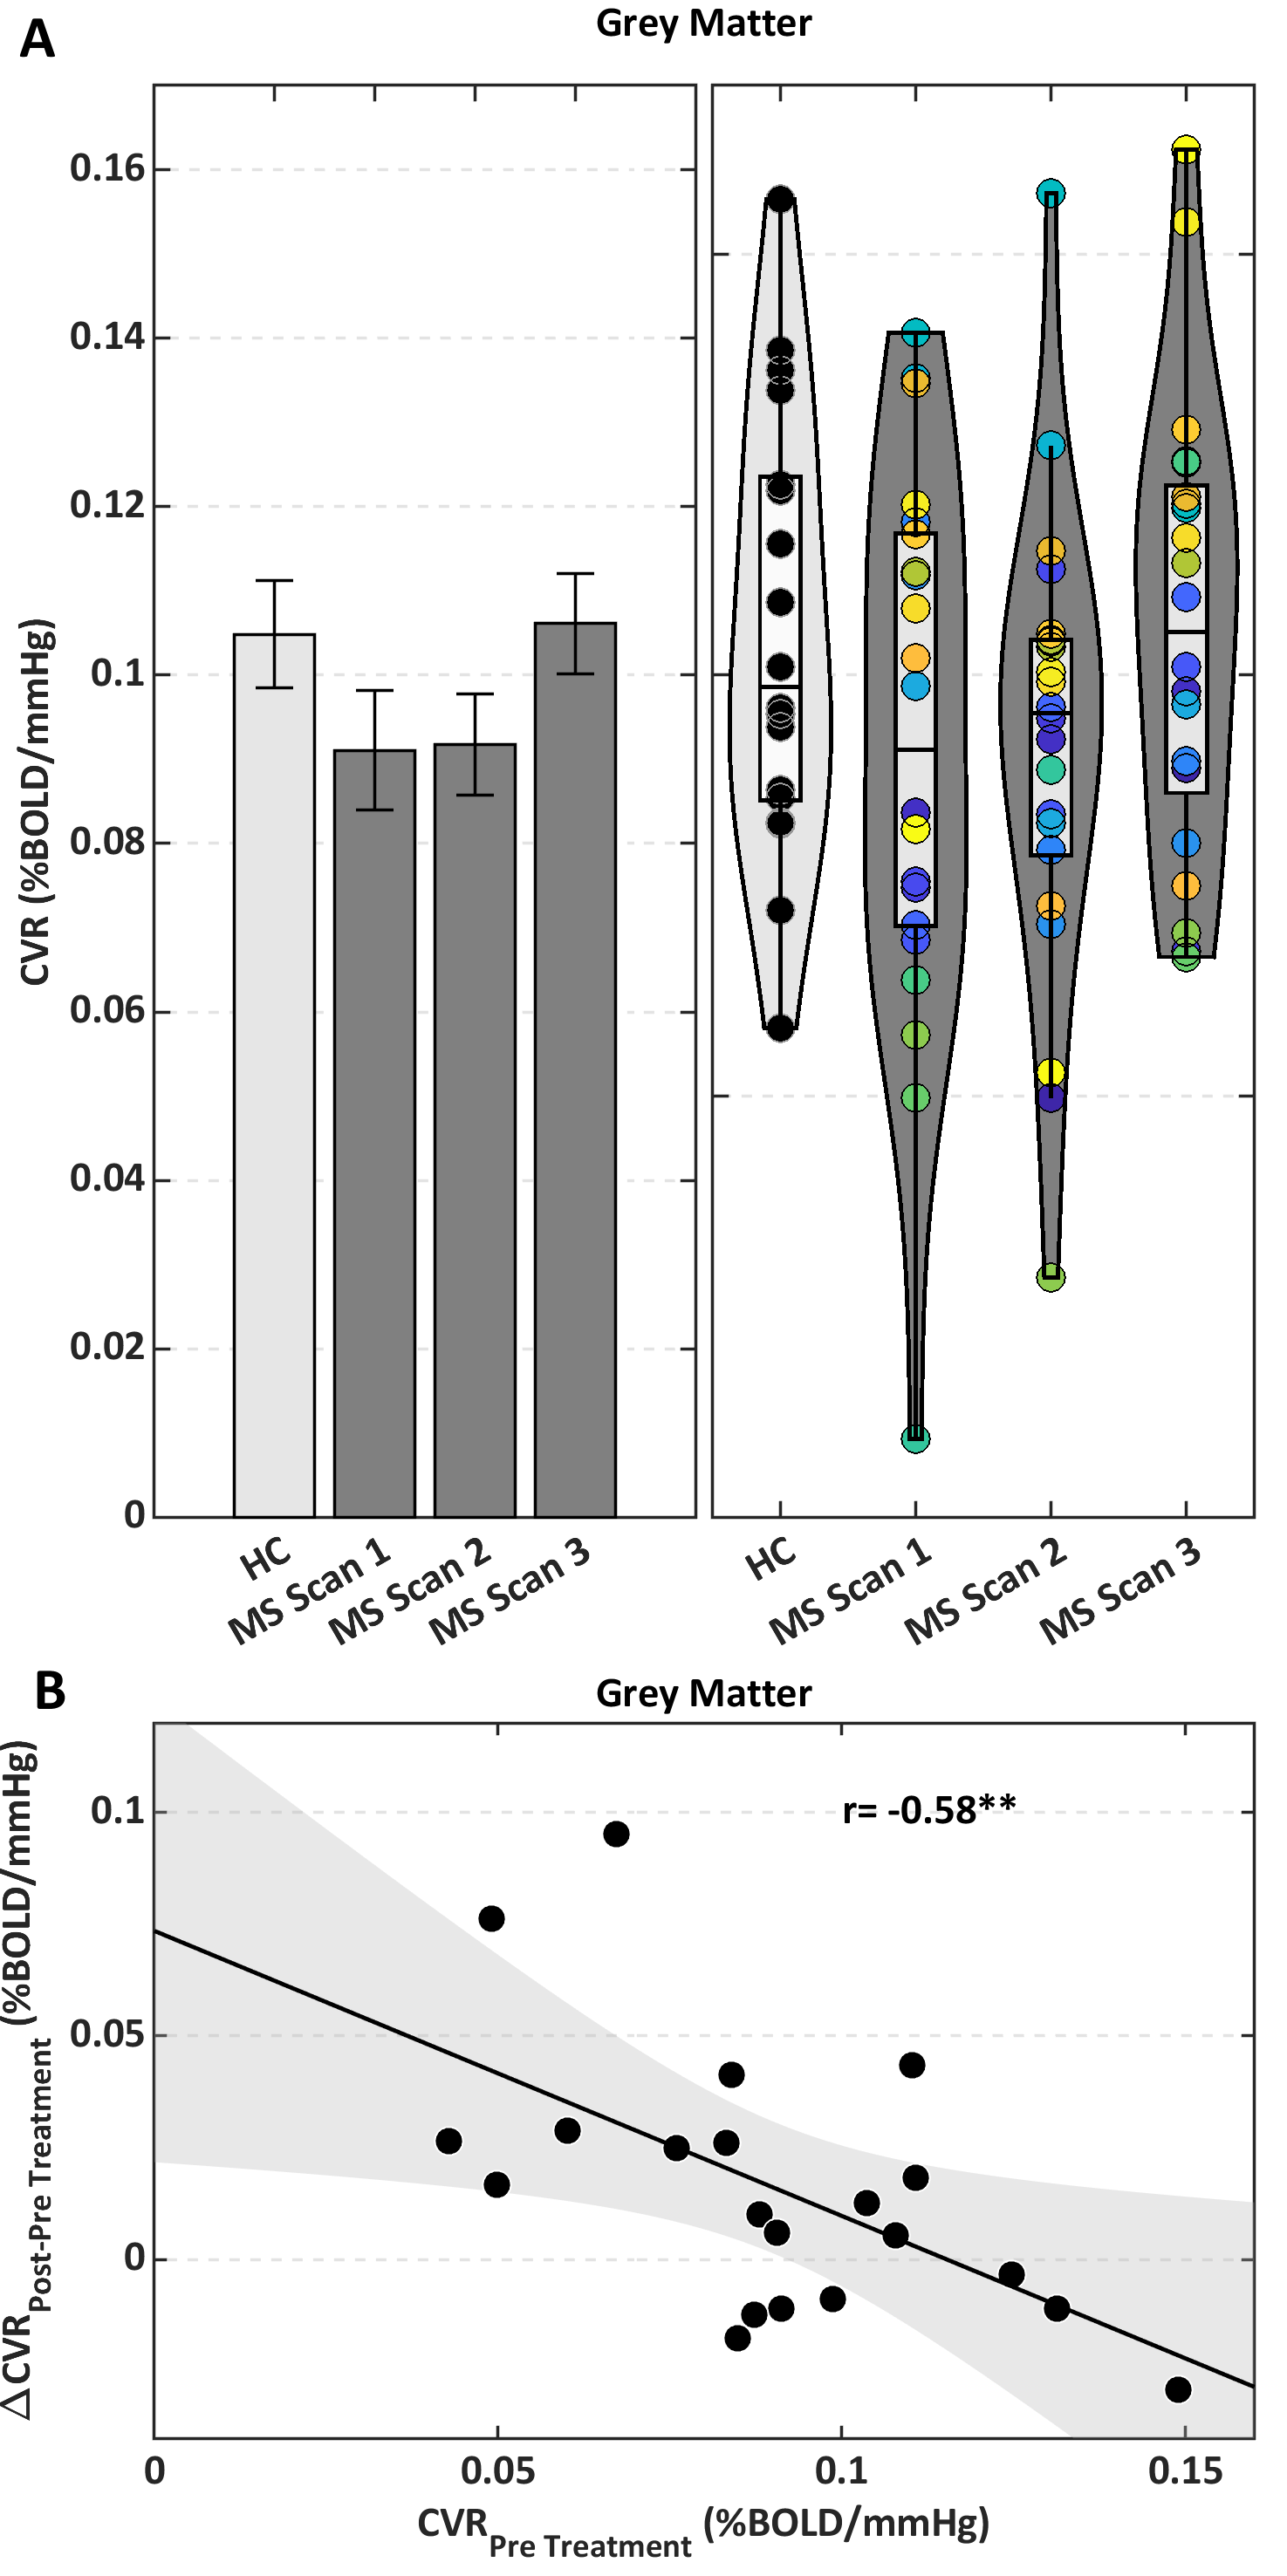
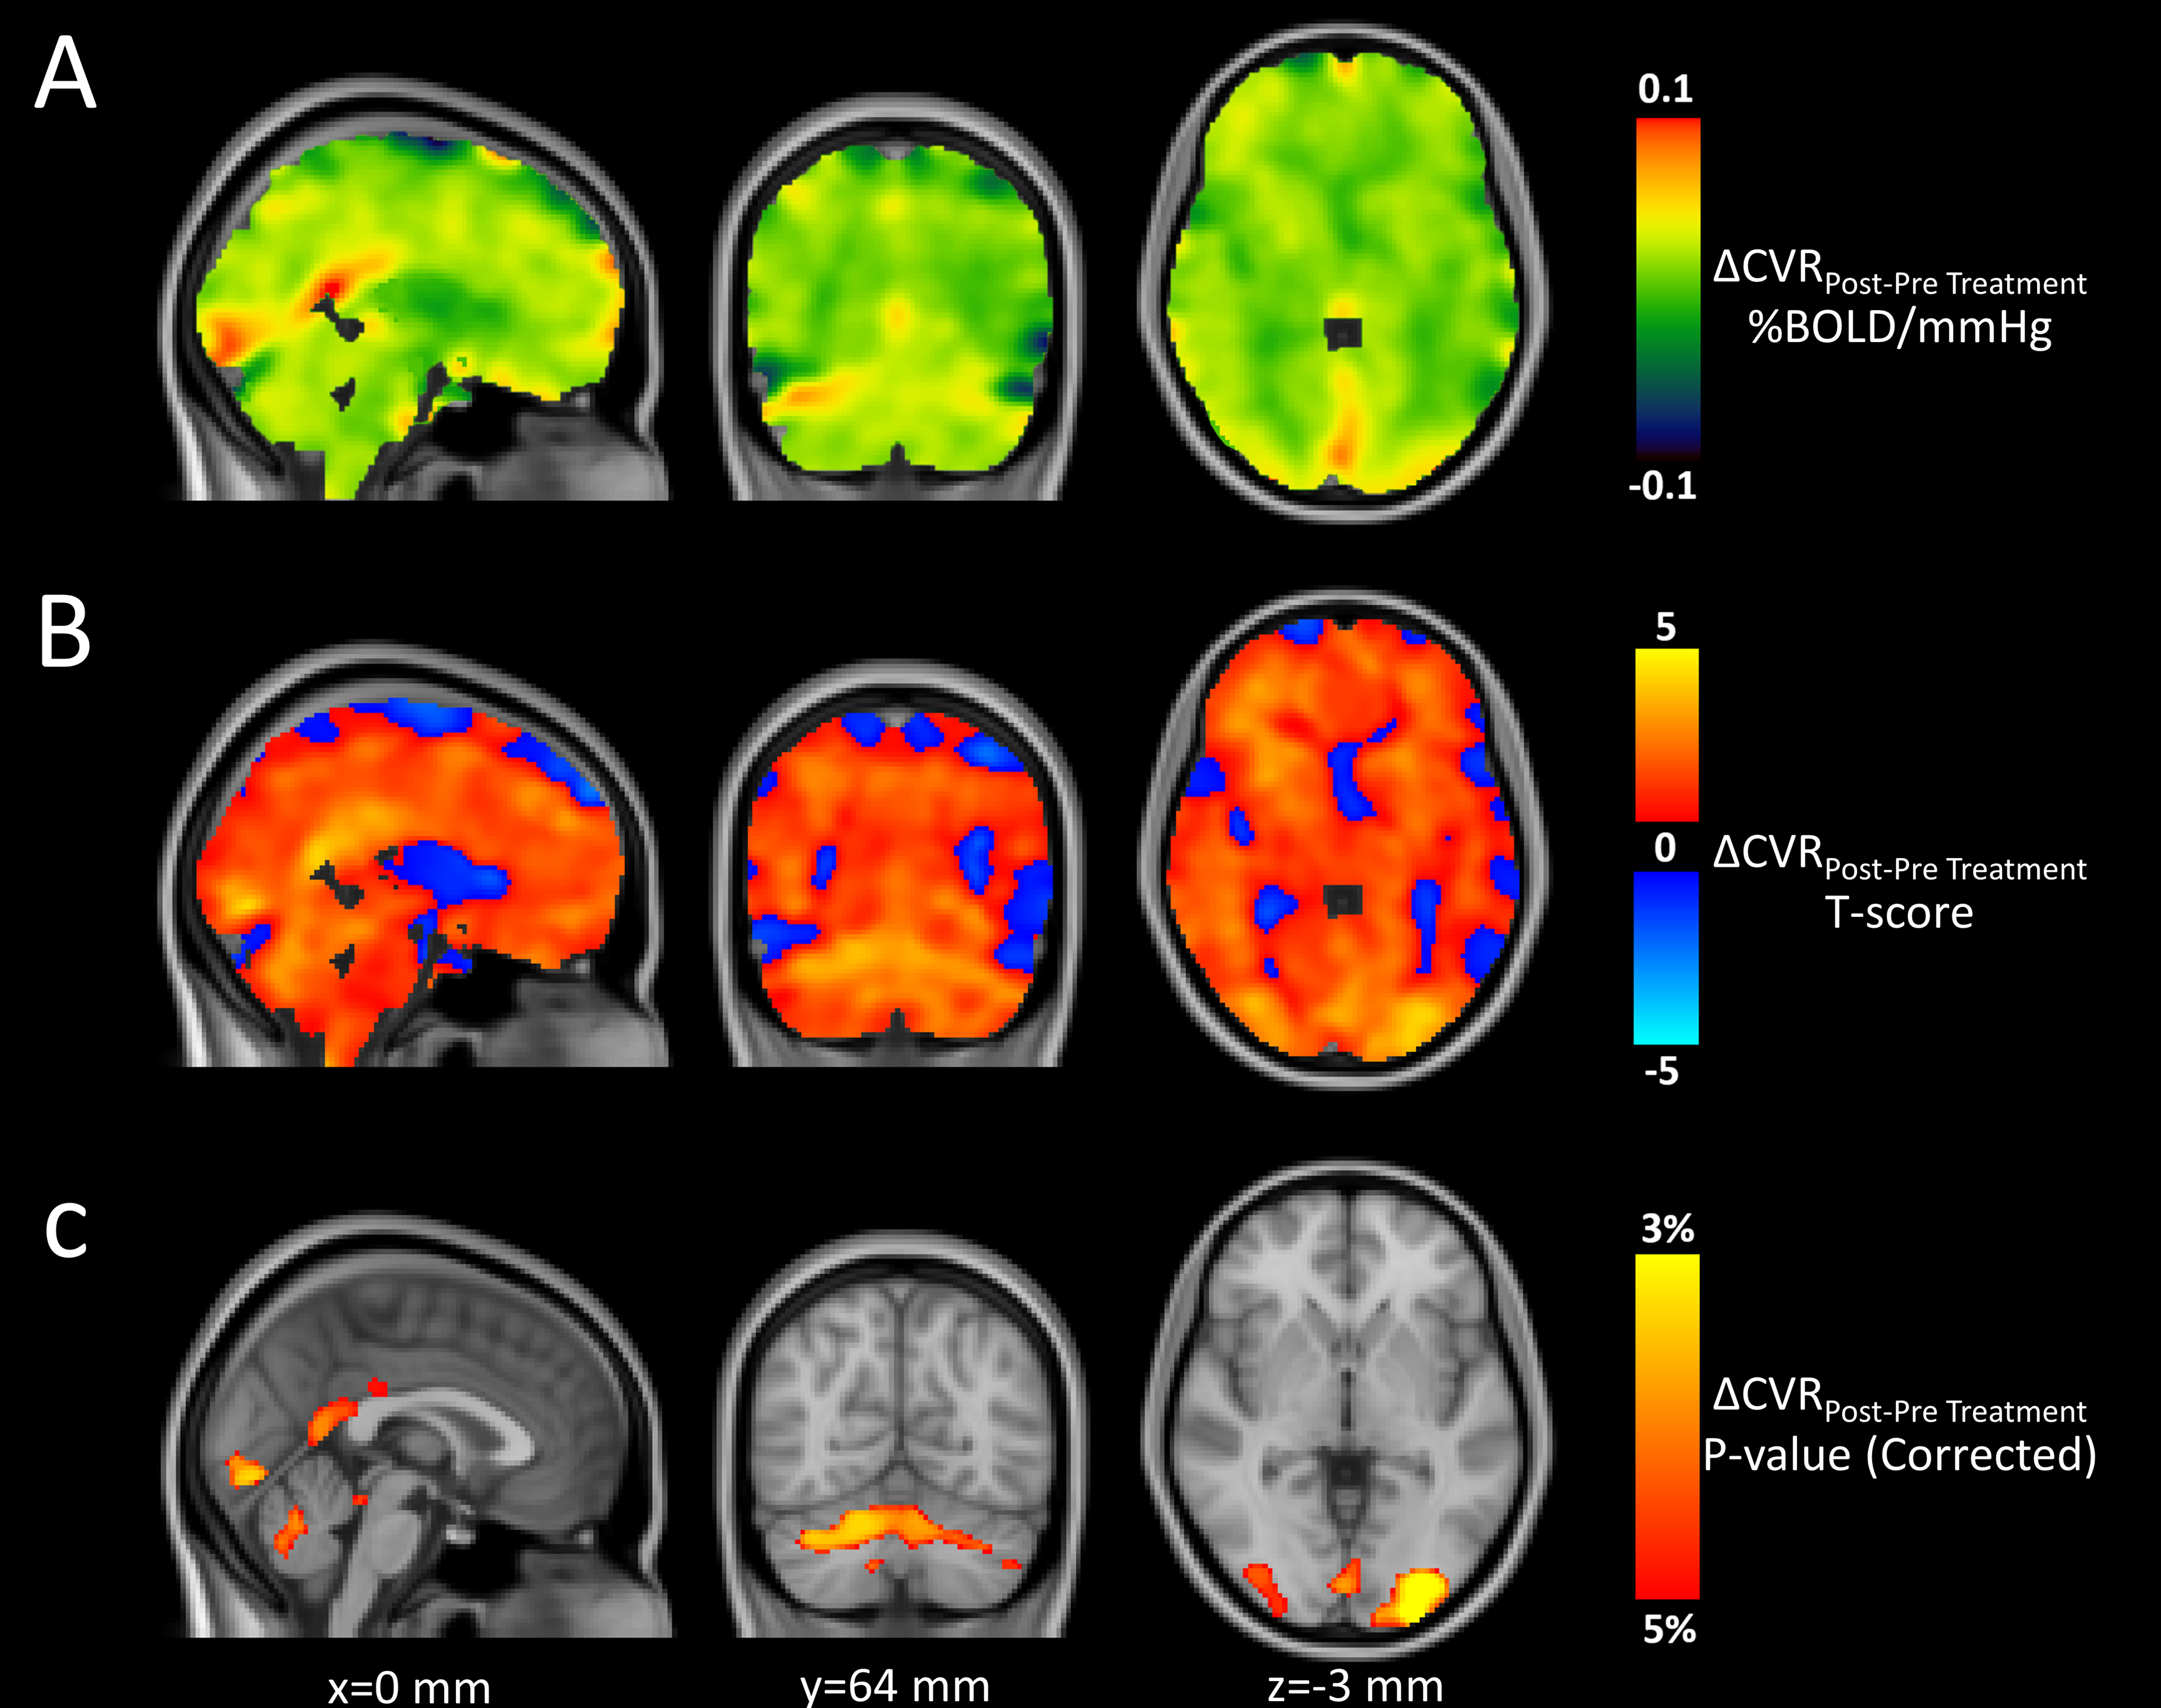
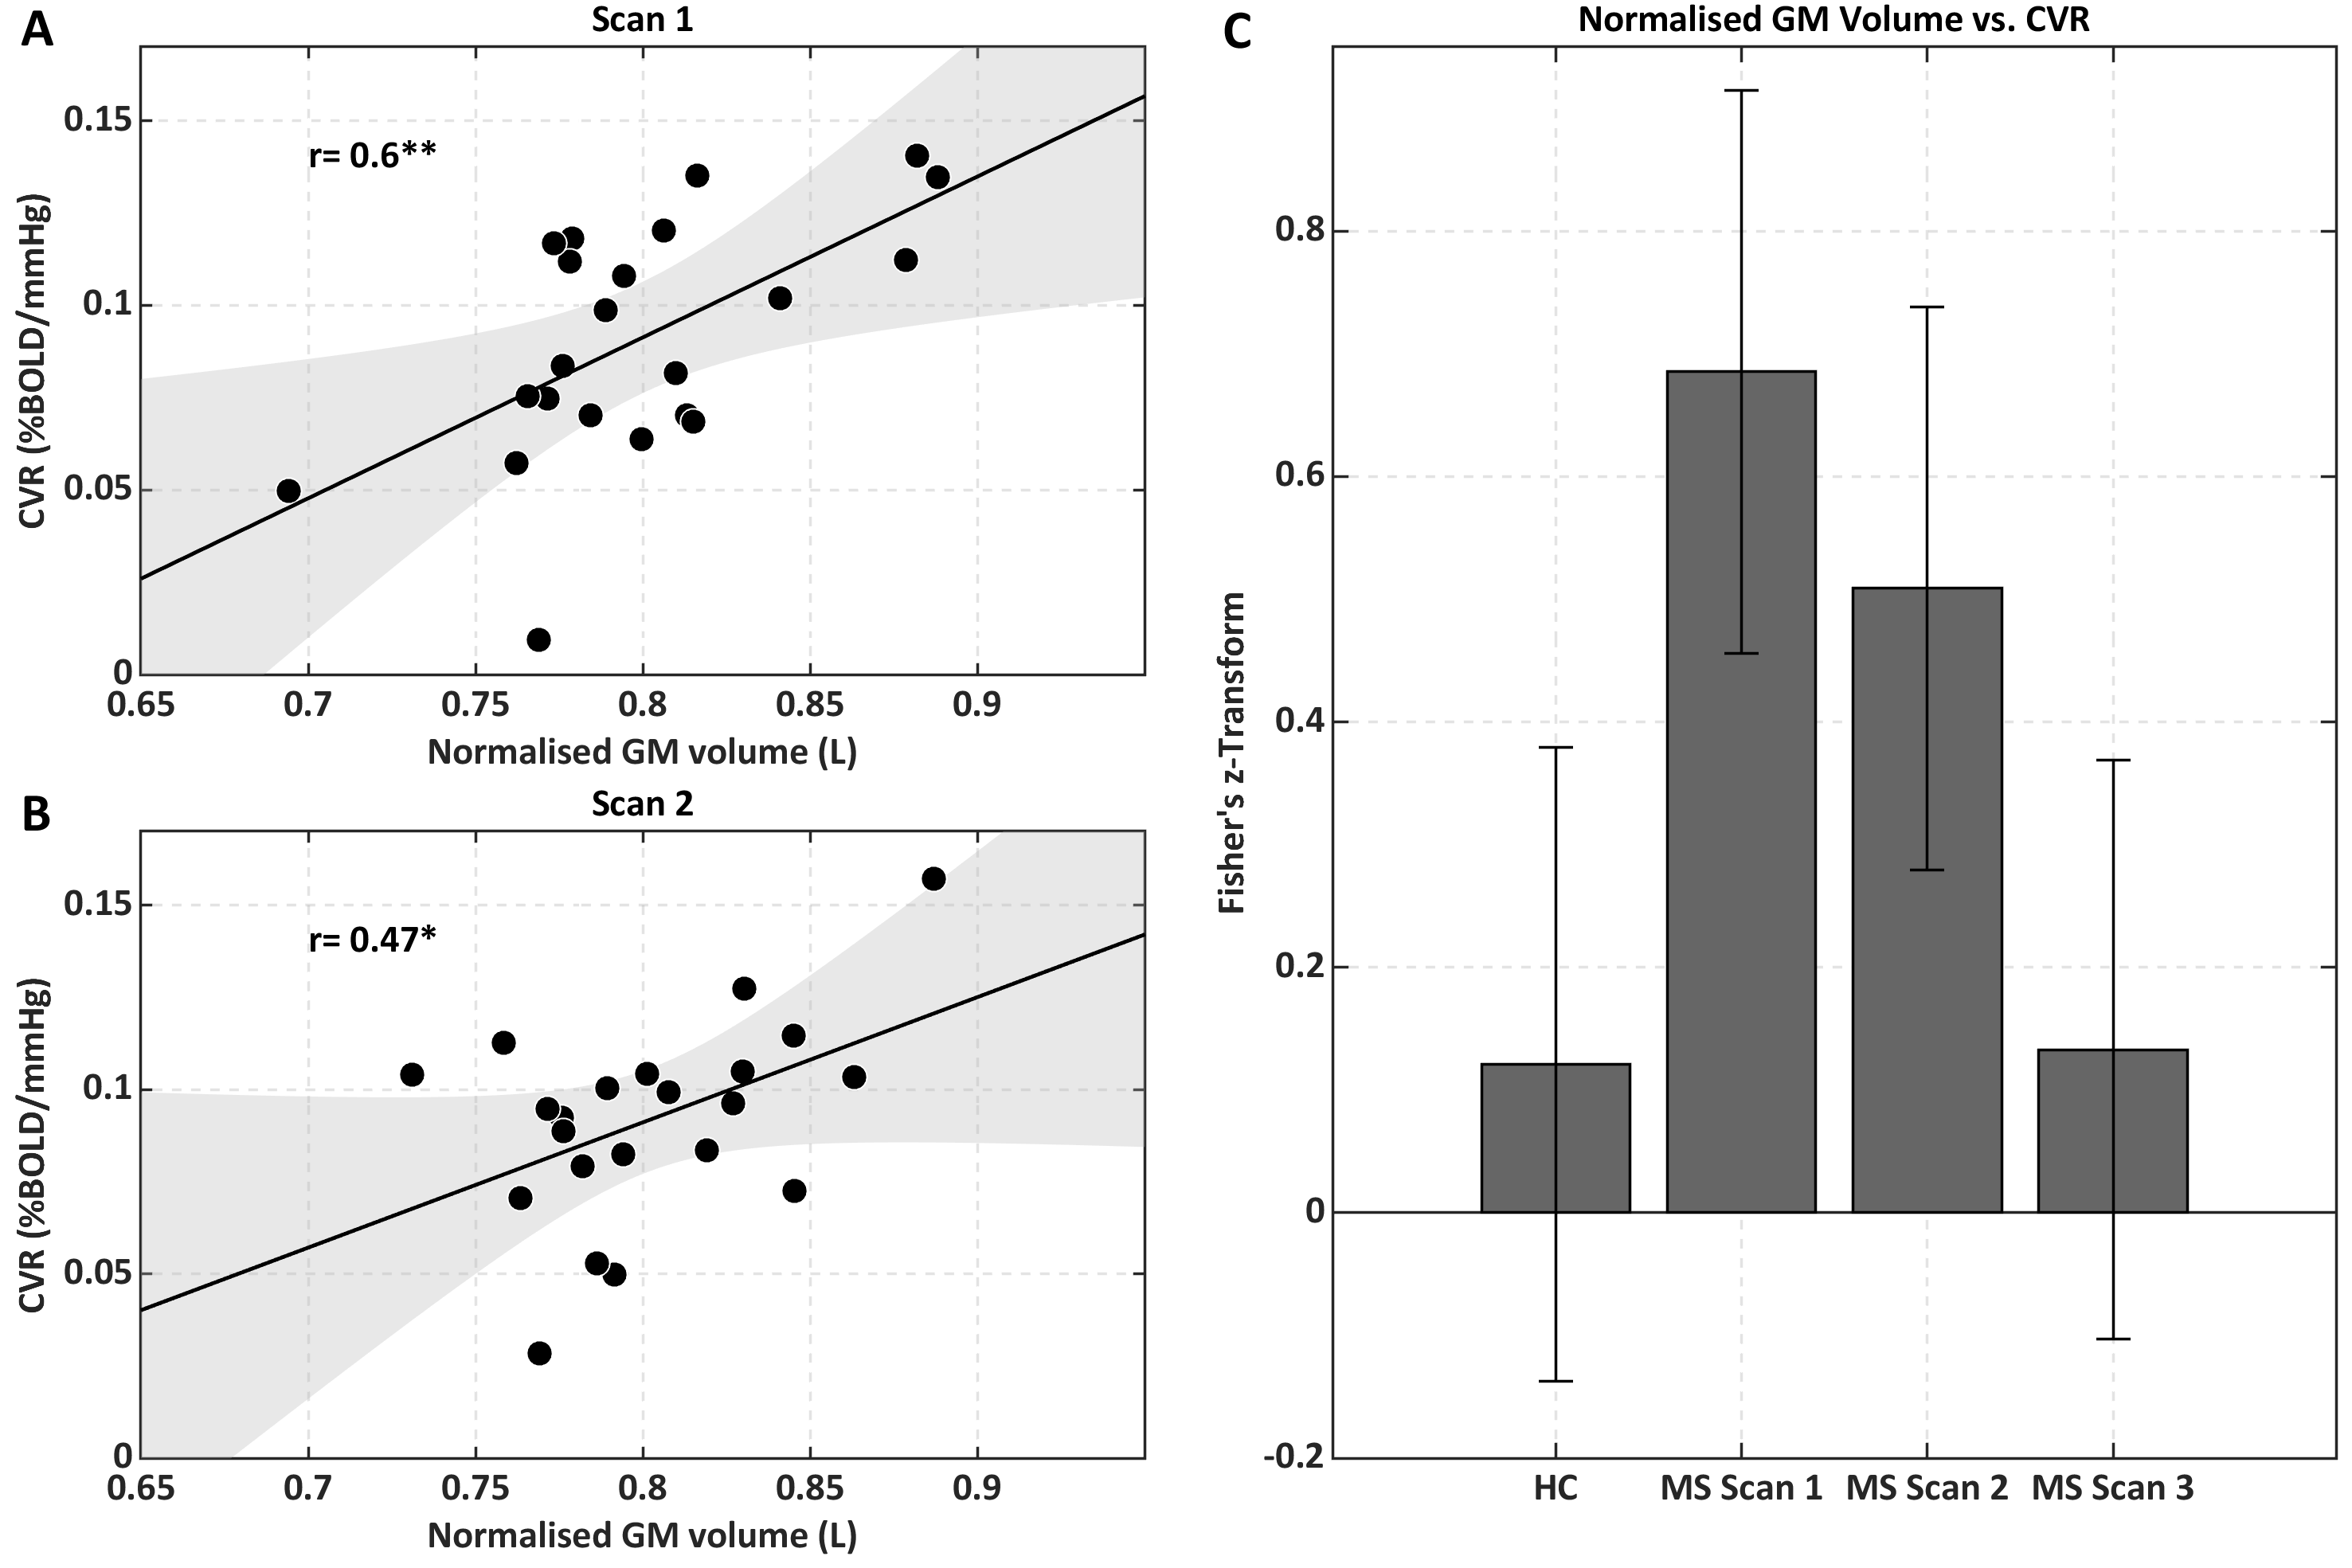
We tested 23 MS patients and 18 HC. At scan 2 (baseline for treatment), there were 13 Gd positive scans; at scan 3 (on treatment), the number of active scans was 3. Figure 1b,c shows a BOLD-CVR map and CVR distribution within GM. An ANOVA did not reveal significant differences between MS and HC CVR in GM [F(3,79)=1.71, p=0.17] (Figure 2). Repeated ANOVA identified changes of CVR [F(2,38)=3.29, p=0.04], with higher post-treatment CVR values, when compared to pre-treatment CVR in GM (average of scans 1 and 2), [t(20)=2.43, p=0.02] (Figure 2). The CVR increase negatively correlated with pre-treatment CVR in GM, (r=-0.58, p=6.3·10-3) (Figure 2). A larger CVR increase was observed in the posterior cingulate and occipital cortices, and in the cerebellum (Figure 3). In the patients only, there was a significant correlation between GM CVR and volume (normalized for intracranial volume) prior to treatment (scan 1, r=0.60 p=3.5·10-3, and scan 2, r=0.47, p=0.03). This association was lost after treatment (Figure 4).Discussion
We mapped BOLD-CVR4 in HC and in MS patients, before and during IFN-β. An increase in CVR with IFN-β in GM was found and it was negatively correlated with pre-treatment CVR, suggesting a restoration of CVR, in which a greater recovery occurs for larger initial inflammation-mediated vasodilatory impairment. Clusters of stronger positive changes in CVR were observed in posterior cingulate and occipital cortices and in the cerebellum. CVR modulation paralleled changes in inflammation, as assessed Gd-enhancing lesions. A pre-treatment positive association between CVR and GM volume suggested an involvement of cerebrovascular impairment in MS neurodegeneration. The interpretation of our findings is not straightforward. The lack of a significant difference in CVR between HC and MS at baseline could be due to between-subjects variance in CVR estimates deriving from the multiparametric origin of BOLD signal5 and from inter-subject variability in the hemodynamic response function11. It should be noted that longitudinal changes in BOLD CVR might be related to an increase in baseline CBV rather than to an increase in fractional CBF with hypercapnia. Such an effect on CBV would be, nonetheless, interesting in relating inflammation to brain vasculature. Further studies are needed to elucidate the vascular and metabolic origins of the treatment effect on MS damage.Conclusion
Our findings lend support to the hypothesis that the cerebrovascular system should be a main target of investigations in MS utility. Further developments in MRI of brain physiology will offer an opportunity to identify alterations and detect changes within this system that may reveal very valuable in correctly phenotyping patients and in targeting mechanisms of damage and progression in MS12–15.Acknowledgements
This work was partially conducted under the framework of the Departments of Excellence 2018–2022 initiative of the Italian Ministry of Education, University and Research for the Department of Neuroscience, Imaging and Clinical Sciences (DNISC) of the University of Chieti-Pescara, Italy.References
1. D’haeseleer, M., Cambron, M., Vanopdenbosch, L. & De Keyser, J. Vascular aspects of multiple sclerosis. Lancet Neurol. 10, 657–666 (2011).
2. Marshall, O., Chawla, S., Lu, H., Pape, L. & Ge, Y. Cerebral blood flow modulation insufficiency in brain networks in multiple sclerosis: A hypercapnia MRI study. J. Cereb. Blood Flow Metab. 36, 2087–2095 (2016).
3. Marshall, O. et al. Impaired Cerebrovascular Reactivity in Multiple Sclerosis. JAMA Neurol. 71, 1275 (2014).
4. Heyn, C. et al. Quantification of Cerebrovascular Reactivity by Blood Oxygen Level–Dependent MR Imaging and Correlation with Conventional Angiography in Patients with Moyamoya Disease. Am. J. Neuroradiol. 31, 862–867 (2010).
5. Davis, T. L., Kwong, K. K., Weisskoff, R. M. & Rosen, B. R. Calibrated functional MRI: Mapping the dynamics of oxidative metabolism. Proc. Natl. Acad. Sci. 95, 1834–1839 (1998).
6. Murphy, K., Harris, A. D. & Wise, R. G. Robustly measuring vascular reactivity differences with breath-hold: Normalising stimulus-evoked and resting state BOLD fMRI data. NeuroImage 54, 369–379 (2011).
7. Jacobs, L. D. et al. Intramuscular interferon beta-1a for disease progression in relapsing multiple sclerosis. Ann. Neurol. 39, 285–294 (1996).
8. Kappos, L. et al. Predictive value of gadolinium-enhanced magnetic resonance imaging for relapse rate and changes in disability or impairment in multiple sclerosis: a meta-analysis. The Lancet 353, 964–969 (1999).
9. Jenkinson, M., Beckmann, C. F., Behrens, T. E. J., Woolrich, M. W. & Smith, S. M. FSL. NeuroImage 62, 782–790 (2012).
10. Friston, K. J. Statistical parametric mapping. in Functional neuroimaging: Technical foundations 79–93 (Academic Press, 1994).
11. Rangaprakash, D., Wu, G.-R., Marinazzo, D., Hu, X. & Deshpande, G. Hemodynamic response function (HRF) variability confounds resting-state fMRI functional connectivity. Magn. Reson. Med. 80, 1697–1713 (2018).
12. Ota, M. et al. Abnormalities of cerebral blood flow in multiple sclerosis: A pseudocontinuous arterial spin labeling MRI study. Magn. Reson. Imaging 31, 990–995 (2013).
13. Germuska, M. et al. Dual-calibrated fMRI measurement of absolute cerebral metabolic rate of oxygen consumption and effective oxygen diffusivity. NeuroImage 184, 717–728 (2019).
14. Lu, H. et al. Calibration and validation of TRUST MRI for the estimation of cerebral blood oxygenation. Magn. Reson. Med. 67, 42–49 (2012).
15. Shmueli, K. et al. Magnetic susceptibility mapping of brain tissue in vivo using MRI phase data. Magn. Reson. Med. 62, 1510–1522 (2009).
Figures