0486
Neurometabolic changes in RRMS: comparison between fingolimod and injectables therapies1School of Health Sciences, University of Newcastle, Newcastle, Australia, 2Hunter Medical Research Institute, Newcastle, Australia, 3Faculty of Health and Medicine, University of Newcastle, Newcastle, Australia, 4Department of Neurology, John Hunter Hospital, Newcastle, Australia, 5School of Medicine and Public Health, University of Newcastle, Newcastle, Australia
Synopsis
This novel study compares the neurometabolic effects of different DMTs on the MS brain. We evaluated volumetric and neurometabolic changes in RRMS patients on fingolimod(N=52), injectables(N=46) and HCs cohort(N=51). MRS was acquired from PCG and PFC. Compared to HCs, a significant reduction in NAA/tCr were detected in both locations and cohorts. Clinical parameters, MR-volumetrics and neurometabolic concentrations showed no statistically significant differences between RRMS cohorts. MRI metrics and neurometabolites from both locations, showed moderate correlations with cognition, fatigue and memory. This the first study demonstrating that fingolimod and injectable DMTs influence volumetric and neurometabolic profiles of MS-brain similarly.
Background
Disease modifying therapies (DMTs) can reduce the frequency of relapses and mitigate the long-term damage caused by these relapses in multiple sclerosis (MS) patients. Therapeutic trials using MRI have demonstrated the efficacy of many DMTs including injectable therapies like glatiramer acetate (GA) and interferon (IFN-b) and oral treatment like fingolimod in relapse-remitting MS (RRMS) by demonstrating reduced MRI- activity1,2 .However, MRI features of MS are not specific to its pathological substrates leading to permanent disability. Treatment response studies using a novel proton magnetic resonance spectroscopy (H-MRS) have demonstrated a significant increase in N-acetylaspartate/total creatine (NAA/tCr) in RRMS patients and reduction in fatigue symptoms of GA therapy 3-5. Fingolimod has shown a clear benefit in preventing brain atrophy early 6, which has always been associated with lower cognitive decline. However, to date, the in-vivo human impact of MS treatments on pre-frontal cortex (PFC) and Posterior cingulate gyrus (PCG) metabolism has not been evaluated. To our knowledge this is the first study to compare the neurometabolic effects of different DMTs on the MS brain. In particular, we evaluated volumetric and neurometabolic changes in RRMS patients on fingolimod or injectables and compared these to a matched healthy cohort(HCs).Materials and Methods
A total of 98 RRMS patients aged between 20 to 55 years were on fingolimod (N=52) and (INF-b or GA,N=46). HCs (N=51) were age and sex matched to the RRMS cohort. All MRI/MRS were undertaken on a 3T (Prisma, Siemens) MRI scanner equipped with a 64 channel coil. Patients were on treatment for at least 6 months and had EDSS < 4. All patients underwent cognitive, fatigue and mental health assessment as well as EDSS. Structural imaging using 3D T1-MPRAGE (TR/TE/TI=2000/3.5/1100 ms, 7° flip angle, FOV=256x256mm2, voxel size:1mm3) as well as 3D T2-FLAIR (TR/TE/TI=5000/386/1800ms, 12° flip angle, FOV=256x256 mm2, voxel size: 1mm3) were acquired.H-MRS was applied using a Point RESolved Spectroscopy (PRESS) sequence acquired from PCG and PFC regions (Figure 1) with the following acquisition parameters:TR/TE=2000/30ms, PCG voxel size =30x30x30 mm3,PFC voxel size =15x15x15 mm3, averages= 96 and water suppression was enabled. FSL and SPM12 were used for total brain volume, grey matter (GM), white matter (WM), CSF volumes and segmentation of lesion and MRS voxels7-9. Volumetric metrics and Lcmodel neurometabolic ratios were compared in the three cohorts using a univariate general linear model. Correlations of the above MR metrics with clinical severity and neuropsychological scores were also performed using non-parametric correlations.Results
Demographic and clinical parameters of study cohorts are shown in Table 1. Individual and combined RRMS cohorts showed similar statistically significant volumetric differences: GM (-3%), WM (-5%) and CSF (+40%) compared to HCs. Both RRMS cohorts showed no differences were detected in PCG and PFC voxels composition. Using single voxel H-MRS, compared to HCs, a reduction in NAA/tCr in PCG (-7%, p=0.001) and PFC (-9%, p=0.001) were detected in both cohorts (fingolimod and injectable)(Figure 3). In PFC, an increase in myo-inositol (m-Ins)/tCr (+5%, p=0.03) were also detected in both cohorts (Figure 3). Clinical parameters, MR volumetrics and neurometabolic concentrations showed no statistically significant differences between the fingolimod and injectable cohorts. PCG-glutathione (GSH), m-Ins and total choline(tCho) displayed a negative correlation with total audio recorded cognitive screen (tARCS) (|r| ≤ 0.446), while GSH and tCho showed a negative correlation with symbol digit modalities test (SDMT) (|r| ≤ 0.395). In PFC, GSH and Glx were negatively correlated with anxiety and depression (|r| ≤ 0.351) (Table 2). Including volumetric parameters, NAA was negatively correlated with the Modified Fatigue Impact Scale (MFIS) (r=-0.315) and CSF volume (r=-0.425) (Table 2).Discussion
In this study we confirm significant neurometabolic and volumetric differences between MS patients and HCs 10-12. The surprising finding of this study is, that we did not find a difference between patients treated with the high efficacy treatment fingolimod and patients treated with injectables. We found significant correlations of many of our metabolites with clinical outcomes. However, only PCG NAA levels correlated negatively with higher CSF volume, reinforcing the role of NAA as a marker for neuronal integrity, and a more sensitive marker of brain atrophy. We observed a negative correlation between the PCG NAA levels and MFIS as well as CSF volume in RRMS, which disagrees with other work 13.Studies in MS have shown that changes to PCG and PFC may be sensitive to the progression of clinical and cognitive disabilities of MS patients and may play an important role in the improvement of cognitive performance 14,15.Conclusion
The current study is the first cross-sectional in-vivo investigation comparing the impact of fingolimod, interferon or GA treatments on the PFC and PCG metabolism in RRMS patients. We demonstrated that fingolimod and injectable DMTs influence volumetric and neurometabolic profiles of MS brain similarly. Longitudinal studies are required to further clarify metabolic differences over time, and to determine an association between brain metabolism and treatment efficacy. However, our findings suggest that MRS of neurometabolites in these regions are more sensitive markers than morphological changes.Acknowledgements
Funding for this study provided by Novartis Pharmaceuticals Australia.
The authors thank the patients and controls who participated in this study and the Imaging Centre of the University of Newcastle and Hunter Medical Research Institute.
References
1.Simpson D, Noble S, Perry C. Glatiramer Acetate. CNS Drugs 2002;16(12):825-850.
2.Hutchinson M. Natalizumab: A new treatment for relapsing remitting multiple sclerosis. Ther Clin Risk Manag 2007;3(2):259-268.
3.Khan O, Shen Y, Bao F, et al. Long-term study of brain 1H-MRS study in multiple sclerosis: effect of glatiramer acetate therapy on axonal metabolic function and feasibility of long-Term H-MRS monitoring in multiple sclerosis. Journal of neuroimaging : official journal of the American Society of Neuroimaging 2008;18(3):314-319.
4.Khan O, Shen Y, Caon C, et al. Axonal metabolic recovery and potential neuroprotective effect of glatiramer acetate in relapsing-remitting multiple sclerosis. Multiple sclerosis 2005;11(6):646-651.
5.Ziemssen T, Hoffman J, Apfel R, Kern S. Effects of glatiramer acetate on fatigue and days of absence from work in first-time treated relapsing-remitting multiple sclerosis. Health Qual Life Outcomes 2008;6:67. 6.Radue EW, O'Connor P, Polman CH, et al. Impact of fingolimod therapy on magnetic resonance imaging outcomes in patients with multiple sclerosis. Arch Neurol 2012;69(10):1259-1269.
7.Ashburner J, Barnes G, Chen C , et al. SPM12 2015.
8.Smith SM, Jenkinson M, Woolrich MW, et al. Advances in functional and structural MR image analysis and implementation as FSL. NeuroImage 2004;23 Suppl 1:S208-219.
9.Quadrelli S, Mountford C, Ramadan S. Hitchhiker's Guide to Voxel Segmentation for Partial Volume Correction of In Vivo Magnetic Resonance Spectroscopy. Magn Reson Insights 2016;9:1-8.
10.Rovira À, Alonso J. 1H Magnetic Resonance Spectroscopy in Multiple Sclerosis and Related Disorders. Neuroimaging Clinics 2013;23(3):459-474.
11.Narayana PA. Magnetic resonance spectroscopy in the monitoring of multiple sclerosis. Journal of neuroimaging : official journal of the American Society of Neuroimaging 2005;15(4 Suppl):46S-57S.
12.Chard DT, Griffin CM, McLean MA, et al. Brain metabolite changes in cortical grey and normal-appearing white matter in clinically early relapsing-remitting multiple sclerosis. Brain : a journal of neurology 2002;125(Pt 10):2342-2352.
13.Pokryszko-Dragan A, Bladowska J, Zimny A, et al. Magnetic resonance spectroscopy findings as related to fatigue and cognitive performance in multiple sclerosis patients with mild disability. Journal of the neurological sciences 2014;339(1):35-40.
14.Filippi M, Riccitelli G, Mattioli F, et al. Multiple sclerosis: effects of cognitive rehabilitation on structural and functional MR imaging measures—an explorative study. Radiology 2012;262(3):932-940.
15.Roosendaal SD, Moraal B, Pouwels PJW, et al. Accumulation of cortical lesions in MS: relation with cognitive impairment. Multiple sclerosis 2009;15(6):708-714.
Figures
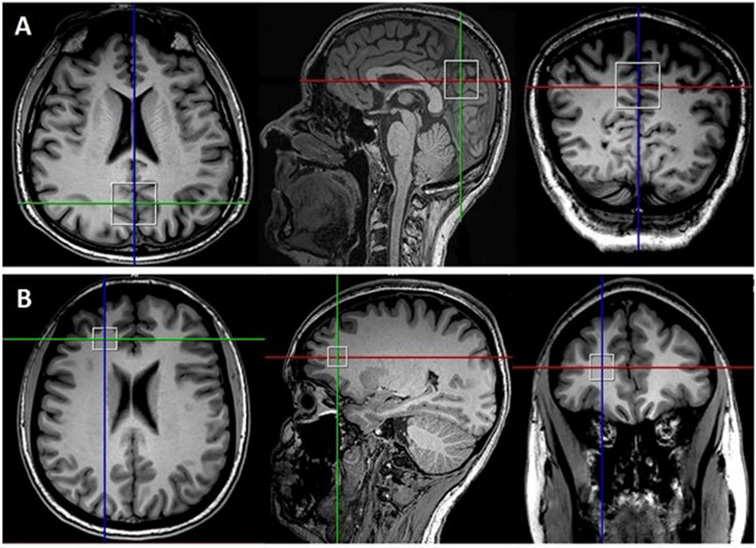
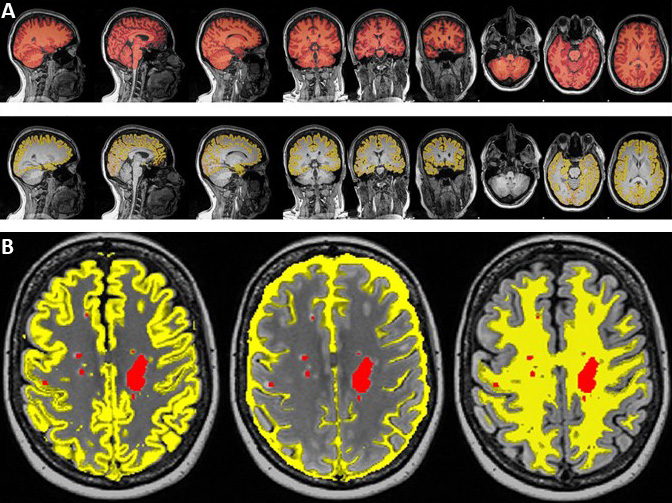
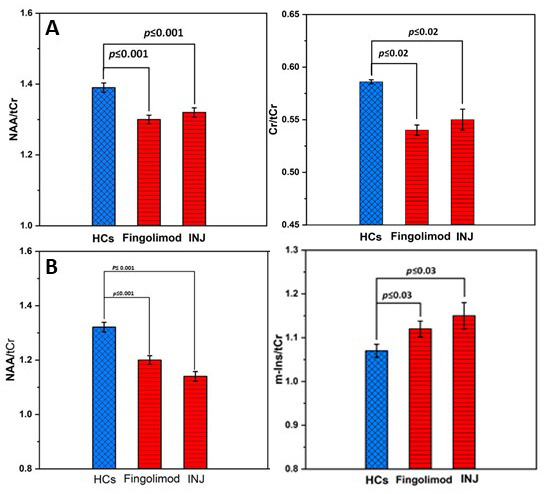
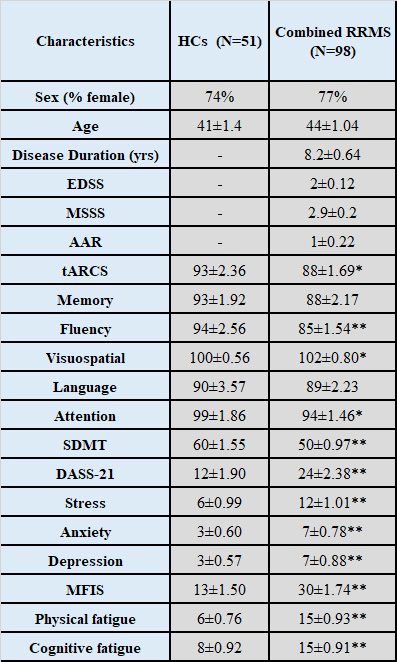
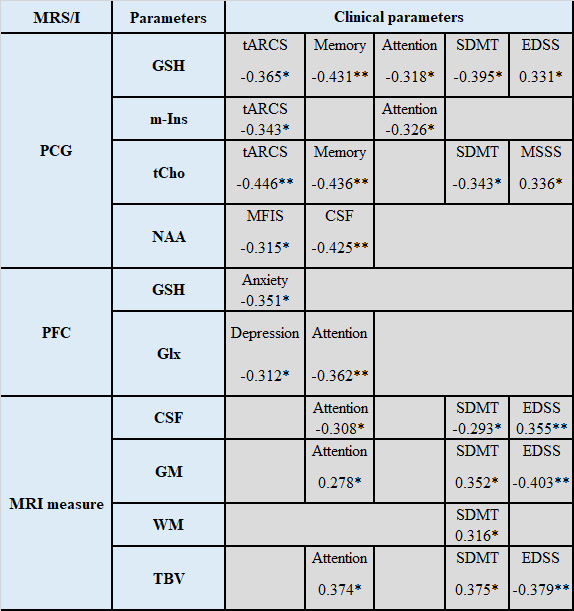
Table 2. Spearman’s correlation between PCG and PFC neurometabolic ratios and cognitive functions and volumetric measures in combined RRMS cohorts. Only statistically significant changes are listed. * p≤ 0.05; **p≤ 0.01.
CSF: cerebrospinal fluid; EDSS: expanded disability status scale; Glx: glutamate+glutamine; GSH: glutathione; MFIS: modified fatigue impact scale; GM: grey matter; MSSS: MS severity score; SDMT: symbol digit modalities test; tARCS: total audio recorded cognitive screen; tCho: total choline; TBV: total brain volume; WM: white matter volume.