0485
Disseminated brain pathology detected with high-resolution MRSI correlates with clinical disability in multiple sclerosis
Eva Heckova1, Alexandra Lipka1, Assunta Dal-Bianco2, Bernhard Strasser1, Gilbert Hangel1,3, Paulus Rommer2, Petra Hnilicová4, Ema Kantorová5, Lukas Hingerl1, Stanislav Motyka1, Fritz Leutmezer2, Stephan Gruber1, Siegfried Trattnig1,6, and Wolfgang Bogner1
1High Field MR Centre, Department of Biomedical Imaging and Image-guided Therapy, Medical University of Vienna, Vienna, Austria, 2Department of Neurology, Medical University of Vienna, Vienna, Austria, 3Department of Neurosurgery, Medical University of Vienna, Vienna, Austria, 4Biomedical Center Martin, Jessenius Faculty of Medicine in Martin, Comenius University in Bratislava, Martin, Slovakia, 5Clinic of Neurology, Jessenius Faculty of Medicine in Martin, Comenius University in Bratislava, Martin, Slovakia, 6Christian Doppler Laboratory for Clinical Molecular MR Imaging, Vienna, Austria
1High Field MR Centre, Department of Biomedical Imaging and Image-guided Therapy, Medical University of Vienna, Vienna, Austria, 2Department of Neurology, Medical University of Vienna, Vienna, Austria, 3Department of Neurosurgery, Medical University of Vienna, Vienna, Austria, 4Biomedical Center Martin, Jessenius Faculty of Medicine in Martin, Comenius University in Bratislava, Martin, Slovakia, 5Clinic of Neurology, Jessenius Faculty of Medicine in Martin, Comenius University in Bratislava, Martin, Slovakia, 6Christian Doppler Laboratory for Clinical Molecular MR Imaging, Vienna, Austria
Synopsis
To enhance the detection of diffuse pathological alterations associated with multiple sclerosis, high-resolution MR spectroscopic imaging was performed at 7T, together with clinical MRI, in 68 MS patients with different levels of clinical disability and 20 healthy controls. Increased myo-inositol, a marker of neuroinflammation-induced astrogliosis, was found in white matter regions appearing normal on clinical MRI, even in subgroup of MS patients with no evidence of clinical disability. Myo-inositol/N-acetylaspartate ratio in the NAWM and cortical gray matter correlated with EDSS, suggesting that reactive astrogliosis and axonal injury play important role in the evolution of MS-related disability.
Introduction
Although conventional MRI has a well-established role in the diagnosis and monitoring of focal demyelinating activity in multiple sclerosis (MS), it is unable to provide a full picture of MS pathology in vivo, and to explain severity of many clinical symptoms, particularly in progressive phase of the disease1.MR spectroscopic imaging (MRSI) can estimate spatial distribution of additional 6-8 neurometabolites relevant to the MS pathology. Previous MRSI studies reported reduced N-acetylaspartate (NAA), which reflects reduced neuronal/axonal integrity, and increased myo-inositol (mI), a marker of astroglial hypertrophy and hyperplasia, in normal-appearing white matter (NAWM) of MS patients2,3. However, due to limited spatial resolution and cortical coverage, these metabolic abnormalities could not be properly visualized and investigation of cortical gray matter (CGM) has not been feasible at all.
The aim of this study was to evaluate the disseminated pathology in the NAWM and CGM using novel 7T ultra-high-resolution MRSI with full in-plane cortical coverage and an acquisition time of ~6min in a larger cohort of MS patients and to evaluate the association of metabolic abnormalities with clinical disability.
Methods
High-resolution MRSI, T2-weighted 3D-FLAIR and T1-weighted 3D-MP(2)RAGE were performed at 7T. In total, 68 MS patients (63 relapsing-remitting/5 secondary-progressive MS; 32 men/36 women; median age, 32.7 years [range, 20.3-70.5 years]; median EDSS, 2 [range, 0-7.5]) and 20 healthy controls (eight men/12 women; median age, 30.1 years [range, 25.4-48]) were examined. Subgroup analysis based on patient’s EDSS was performed. Detailed characteristics of the study subgroups are summarized in Figure 1.Single-slice FID-MRSI4,5 was performed with acquisition delay/TR, 1.3/200ms; spatial resolution, 2.2×2.2×8mm3; matrix size, 100×100; flip angle, 29°; WET water suppression; four-fold 2D-CAIPIRINHA acceleration6; and acquisition time, 6:06min. Automated MRSI data processing was performed with in-house developed software. This included MUSICAL coil combination7, 2D-CAIPIRINHA reconstruction, lipid signal removal via L2-regularization8, and LCModel spectral fitting using a basis set of 17 simulated metabolites and a measured macromolecular spectrum9.
Metabolic profiles were calculated within the segmented NAWM and CGM regions created using FAST segmentation and FLIRT co-registration of FSL package10. Only spectra with a minimum content of 95% of WM, or 75% of GM, respectively, were analyzed. T2-hyperintense lesions were carefully excluded from ROIs. Mean metabolic values of segmented regions were compared among the study subgroups using an analysis of covariance with age as a covariate, followed by Sidak post-hoc adjustments for multiple comparisons. Metabolic images were compared visually with MRI. Correlation analyses between EDSS and mean metabolic values were assessed using Pearson’s partial correlation coefficient while controlling for age.
Results
The vast majority of lesions were clearly hyperintense on mI/NAA maps. In addition, with the high-spatial resolution and full cortical coverage, even small subcortical/juxtacortical lesions could be well visualized (Figure 2A). Increased mI and reduced NAA were visible also on metabolic images in 33 MS patients (48%) in NAWM regions with no, or only diffuse, pathology on MRI. In six patients (9%), increased mI also appeared without a decrease in NAA (Figure 2B).Metabolic ratios in NAWM of MS patients were significantly altered compared to normal WM in healthy controls (HC)(Figure 3). Mean mI/tCr and mI/NAA were significantly increased in centrum semiovale by +14%/+19% (both P<0.05) in subgroup of patients with no clinical disability (EDSS 0-1), by +23%/+36% (both P<0.01) in patients with mild disability (EDSS 1.5-3) and by +22%/+42% (both P<0.01) in severely disabled patients (EDSS 3.5+). Mean NAA/tCr was decreased by up to -14% in subgroups of patients with mild (EDSS 1.5-3) and severe disability (EDSS 3.5+)(both P<0.05). Elevated mI/tNAA, mI/tCr and decreased NAA/tCr were also observed in the parietal and frontal NAWM, but statistically significant differences from the HC were reached only in groups of patients with EDSS 1.5-3 and with EDSS 3.5+ (Figure 4A).
The cortical GM was less affected than the NAWM. Metabolic alterations of mI/NAA (~+20%,P<0.01) and NAA/tCr (~-15%,P<0.05) were observed in subgroups of patients with clinical disability in cingulate cortex, but also in the frontal and parietal CGM (Figure 4B).
Mean mI/NAA correlated significantly with clinical disability, as measured by the EDSS, in the centrum semiovale (r=0.49,P<0.001) and other NAWM and CGM regions (Figure 5).
Discussion
High-resolution spectroscopic imaging in MS revealed localized metabolic alterations, including elevated mI with, but also without reduced NAA (as yet), in regions of white matter with no pathology visible on clinical MRI, which may indicate early pathological changes in the NAWM that remain unnoticed on high-resolution MRI. An early increase of mI may reflect a pathologically important process related to neuroinflammation, and may precede the decrease of NAA, which reflects the neurodegenerative component of the disease. Together, they correlate with the level of clinical disability in several NAWM and CGM regions.Metabolic abnormalities in the NAWM and CGM were more pronounced in subgroups of patients with higher EDSS. These results suggest that reactive astrogliosis and axonal injury play important role in the evolution of MS, and that high-resolution MRSI is an appropriate tool with which to visualize this pathology in clinical setting.
Conclusion
MRSI at 7T allows in vivo visualization of disseminated MS pathology beyond demyelinating lesions. Metabolic abnormalities in the NAWM and CGM, reflecting loss of axonal integrity and neuroinflammation-induced astrogliosis, are associated with clinical disability.Acknowledgements
This study was supported by the Austrian Science Fund (FWF): KLI 718, P 30701 and P 34198.References
- Lassmann H, van Horssen J, Mahad D. Progressive multiple sclerosis: pathology and pathogenesis. Nat Rev Neurol. 2012;8(11):647-656.
- Llufriu S, Kornak J, Ratiney H, et al. Magnetic Resonance Spectroscopy Markers of Disease Progression in Multiple Sclerosis. JAMA Neurol. 2014;71(7):840-847.
- Fernando KTM, McLean MA, Chard DT, et al. Elevated white matter myo‐inositol in clinically isolated syndromes suggestive of multiple sclerosis. Brain. 2004;127(6):1361-1369.
- Hangel G, Strasser B, Považan M, et al. Ultra-high resolution brain metabolite mapping at 7 T by short-TR Hadamard-encoded FID-MRSI. Neuroimage. 2018;168:199-210.
- Bogner W, Gruber S, Trattnig S, Chmelik M. High-resolution mapping of human brain metabolites by free induction decay 1H MRSI at 7 T. NMR Biomed. 2012;25(6):873-882.
- Strasser B, Považan M, Hangel G, et al. (2 + 1)D-CAIPIRINHA accelerated MR spectroscopic imaging of the brain at 7T. Magn Reson Med. 2017;78(2):429-440.
- Strasser B, Chmelik M, Robinson SD, et al. Coil combination of multichannel MRSI data at 7 T: MUSICAL. NMR Biomed. 2013;26(12):1796-1805.
- Bilgic B, Chatnuntawech I, Fan AP, et al. Fast image reconstruction with L2-regularization. J Magn Reson Imaging. 2014;40(1):181-191.
- Považan M, Hangel G, Strasser B, et al. Mapping of brain macromolecules and their use for spectral processing of 1H-MRSI data with an ultra-short acquisition delay at 7T. Neuroimage. 2015;121:126-135.
- Jenkinson M, Beckmann CF, Behrens TEJ, Woolrich MW, Smith SM. FSL. Neuroimage. 2012;62(2):782-790.
Figures
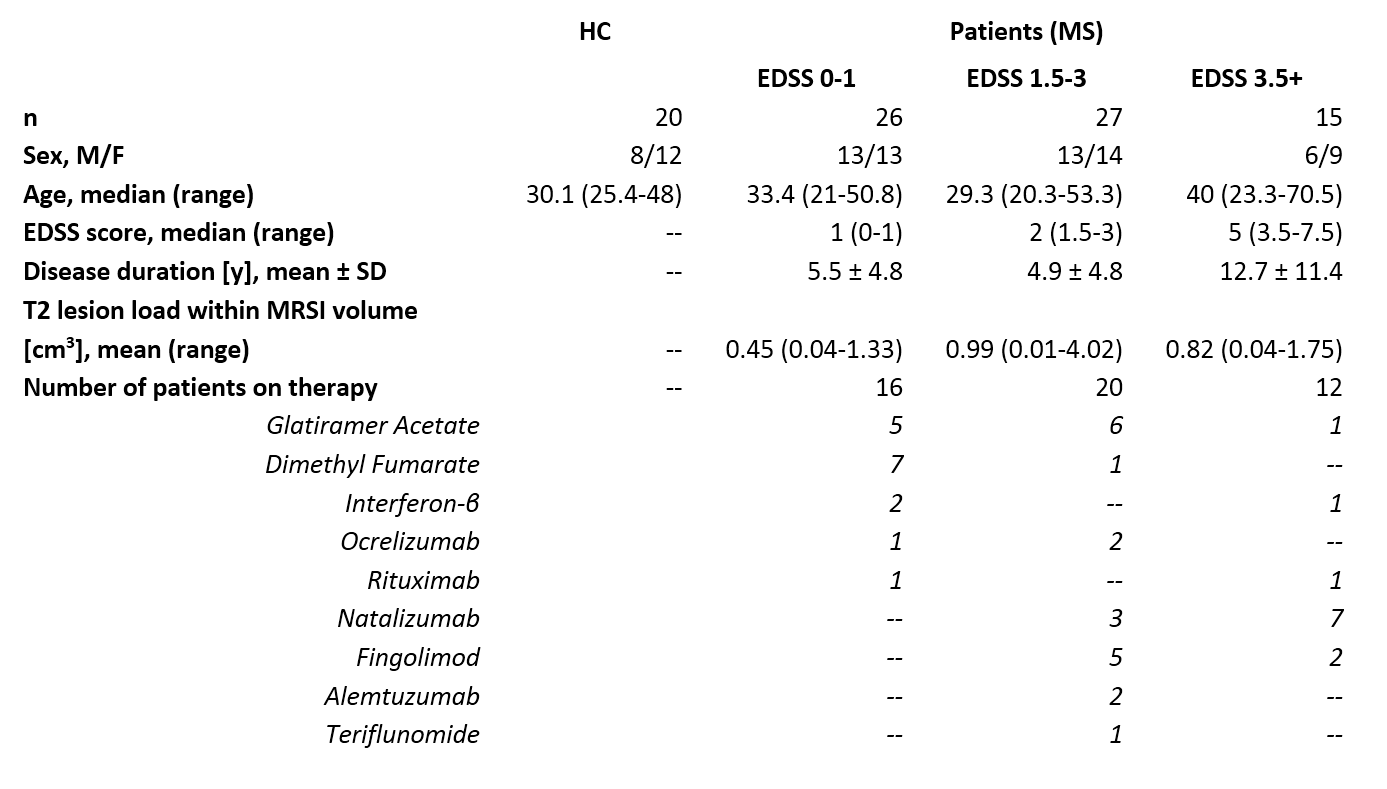
Figure 1: Clinical and demographic data
for healthy controls and subgroups of patients with MS. Abbreviations: EDSS =
Expanded Disability Status Scale; HC = healthy controls; MRSI = magnetic
resonance spectroscopic imaging; MS = multiple sclerosis
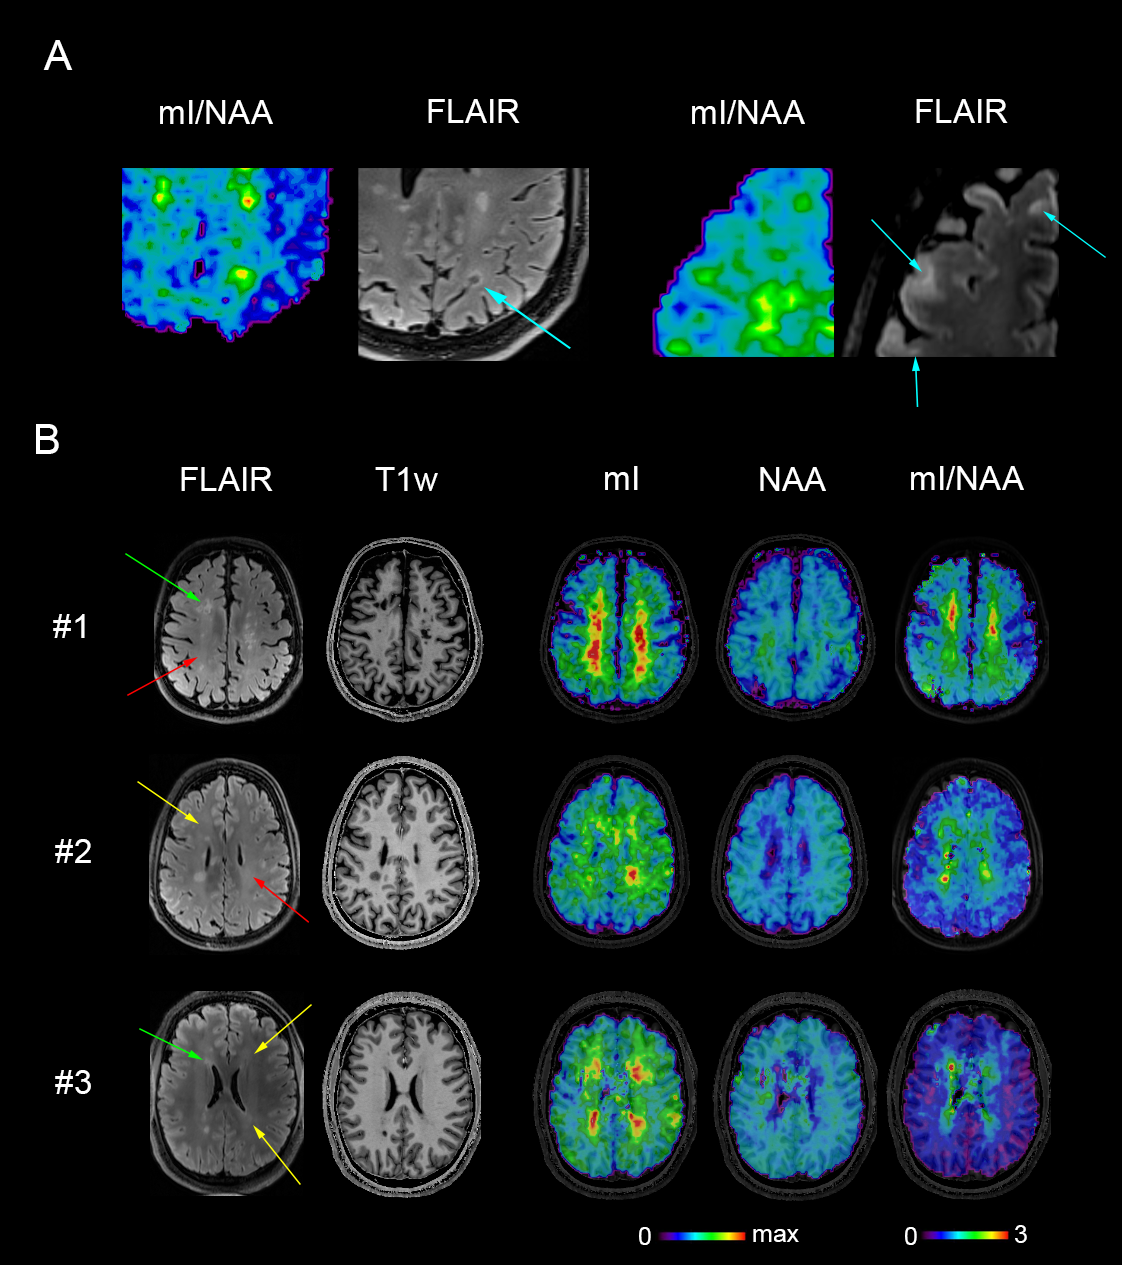
Figure 2: Abnormal metabolic images of
mI, NAA, and mI/NAA together with clinical MRI in patients with MS. Small
subcortical/juxtacortical lesions (A), which appear inconspicuous on
high-resolution MRI (indicated with blue arrows), are well depicted on mI/NAA
maps. In (B), red arrows indicate regions in the NAWM with increased mI only, and
yellow arrows indicate regions with increased mI and decreased NAA, where no,
or only diffuse changes are visible on clinical MRI. Green arrows indicate
white matter lesions, where elevated mI appears beyond T2-visible pathology.
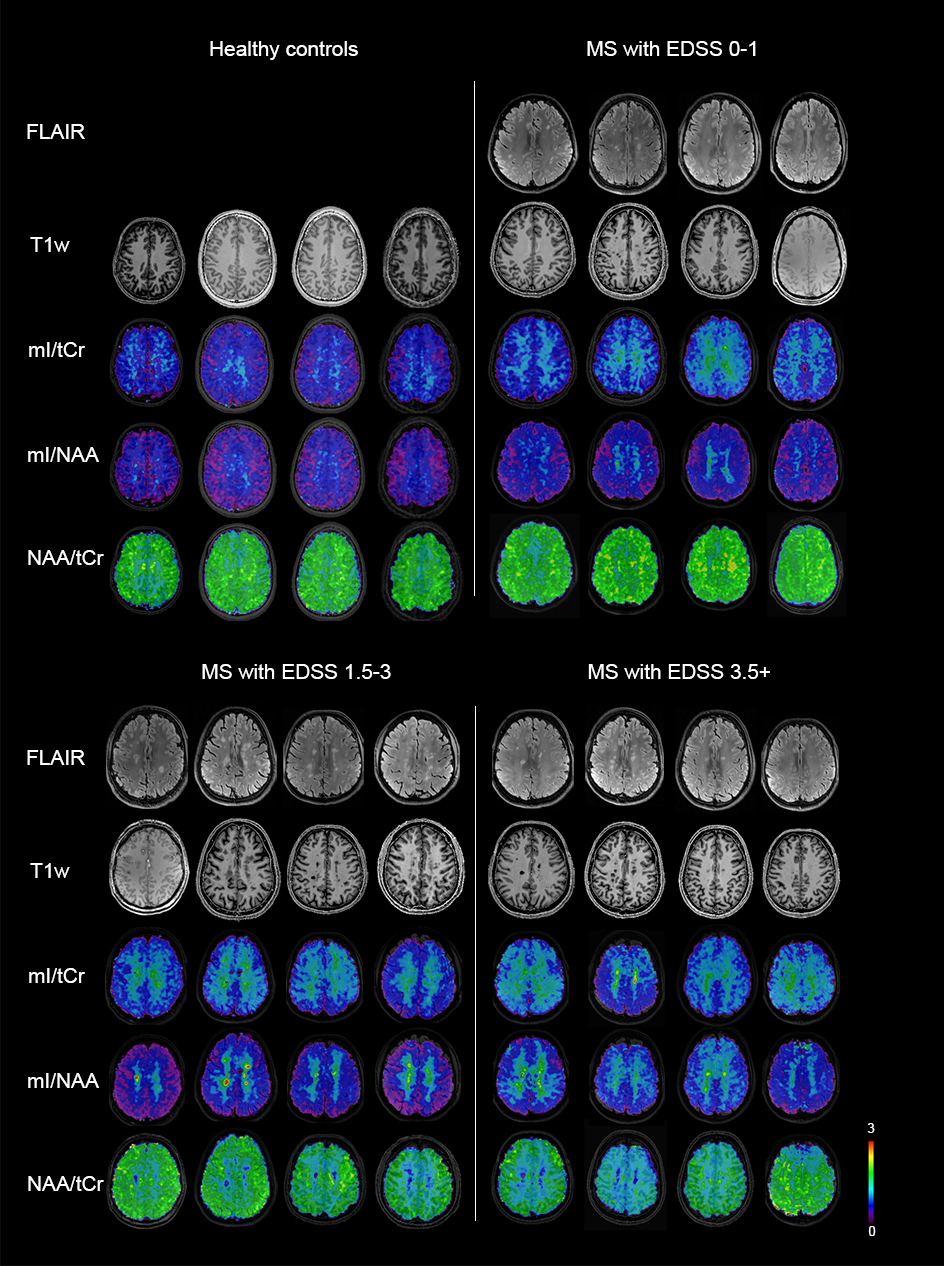
Figure 3: Examples of metabolic ratio
images and clinical MRI from healthy controls and MS patients with various
levels of clinical disability. mI/tCr and mI/NAA tended to be increased in the
NAWM of all patient subgroups, while NAA/tCr was decreased only in subgroups of
patients with mild and more severe clinical disability.
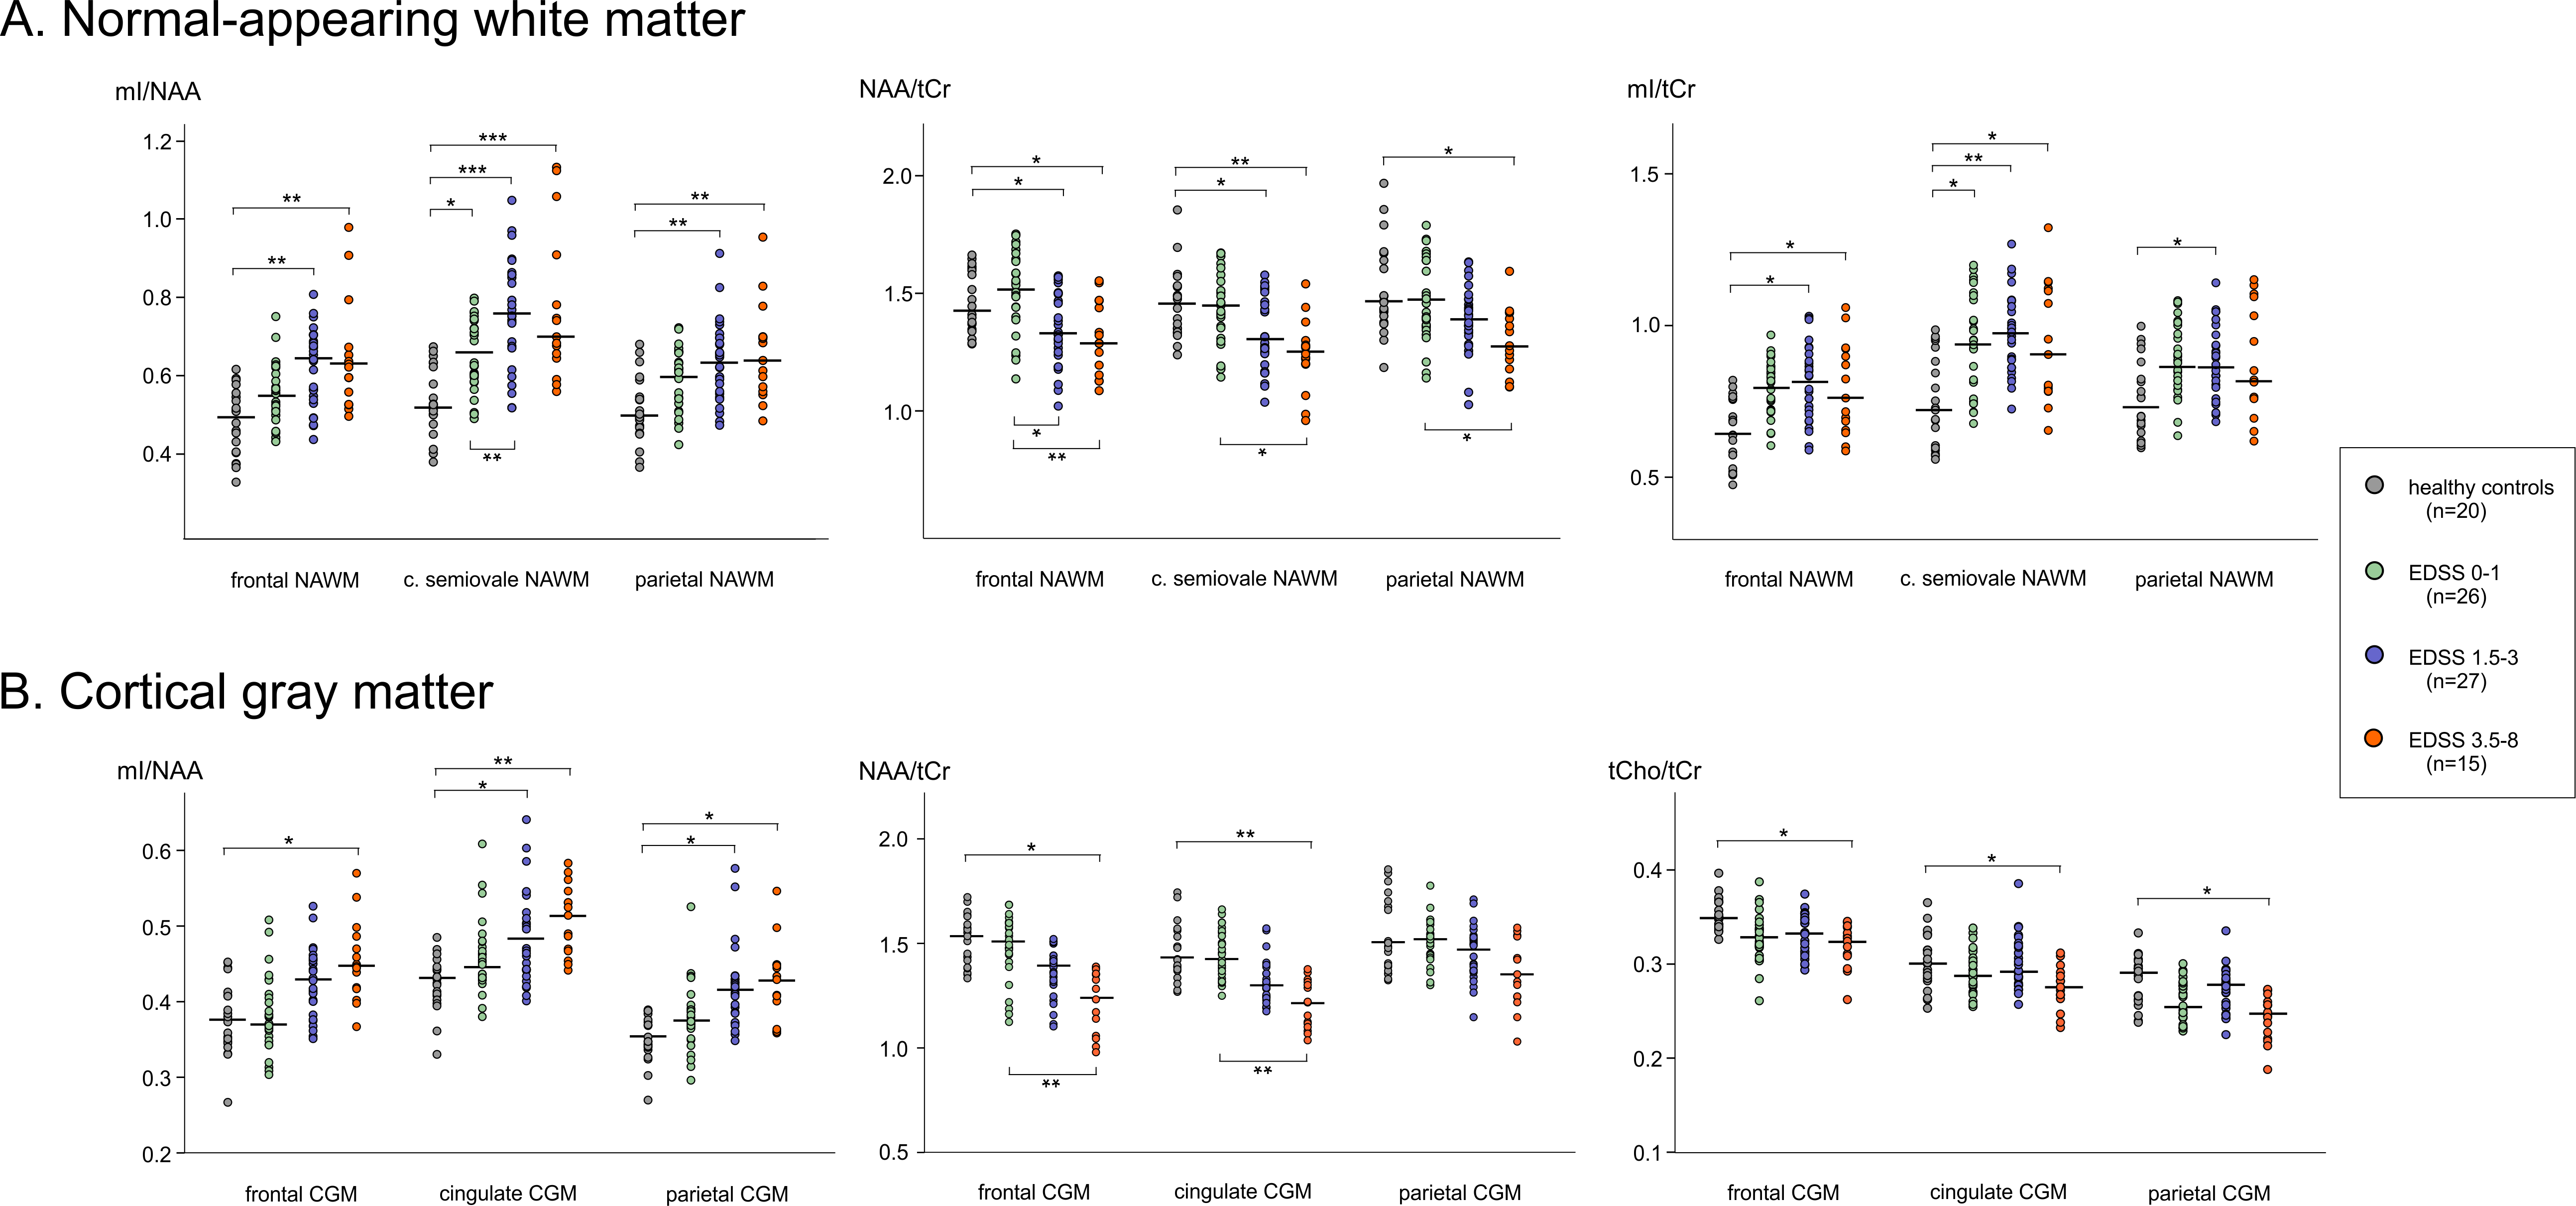
Figure 4: Comparison of mean metabolic
ratios within the segmented NAWM (A) and CGM (B) regions among healthy controls
and subgroups of patients with different levels of clinical disability. In the
NAWM of centrum semiovale, mean mI/tCr and mI/NAA were significantly increased
even in subgroup of patients with no clinical disability (EDSS 0-1). The
horizontal bars indicate the median. * P<0.05; ** P<0.01; *** P<0.001.
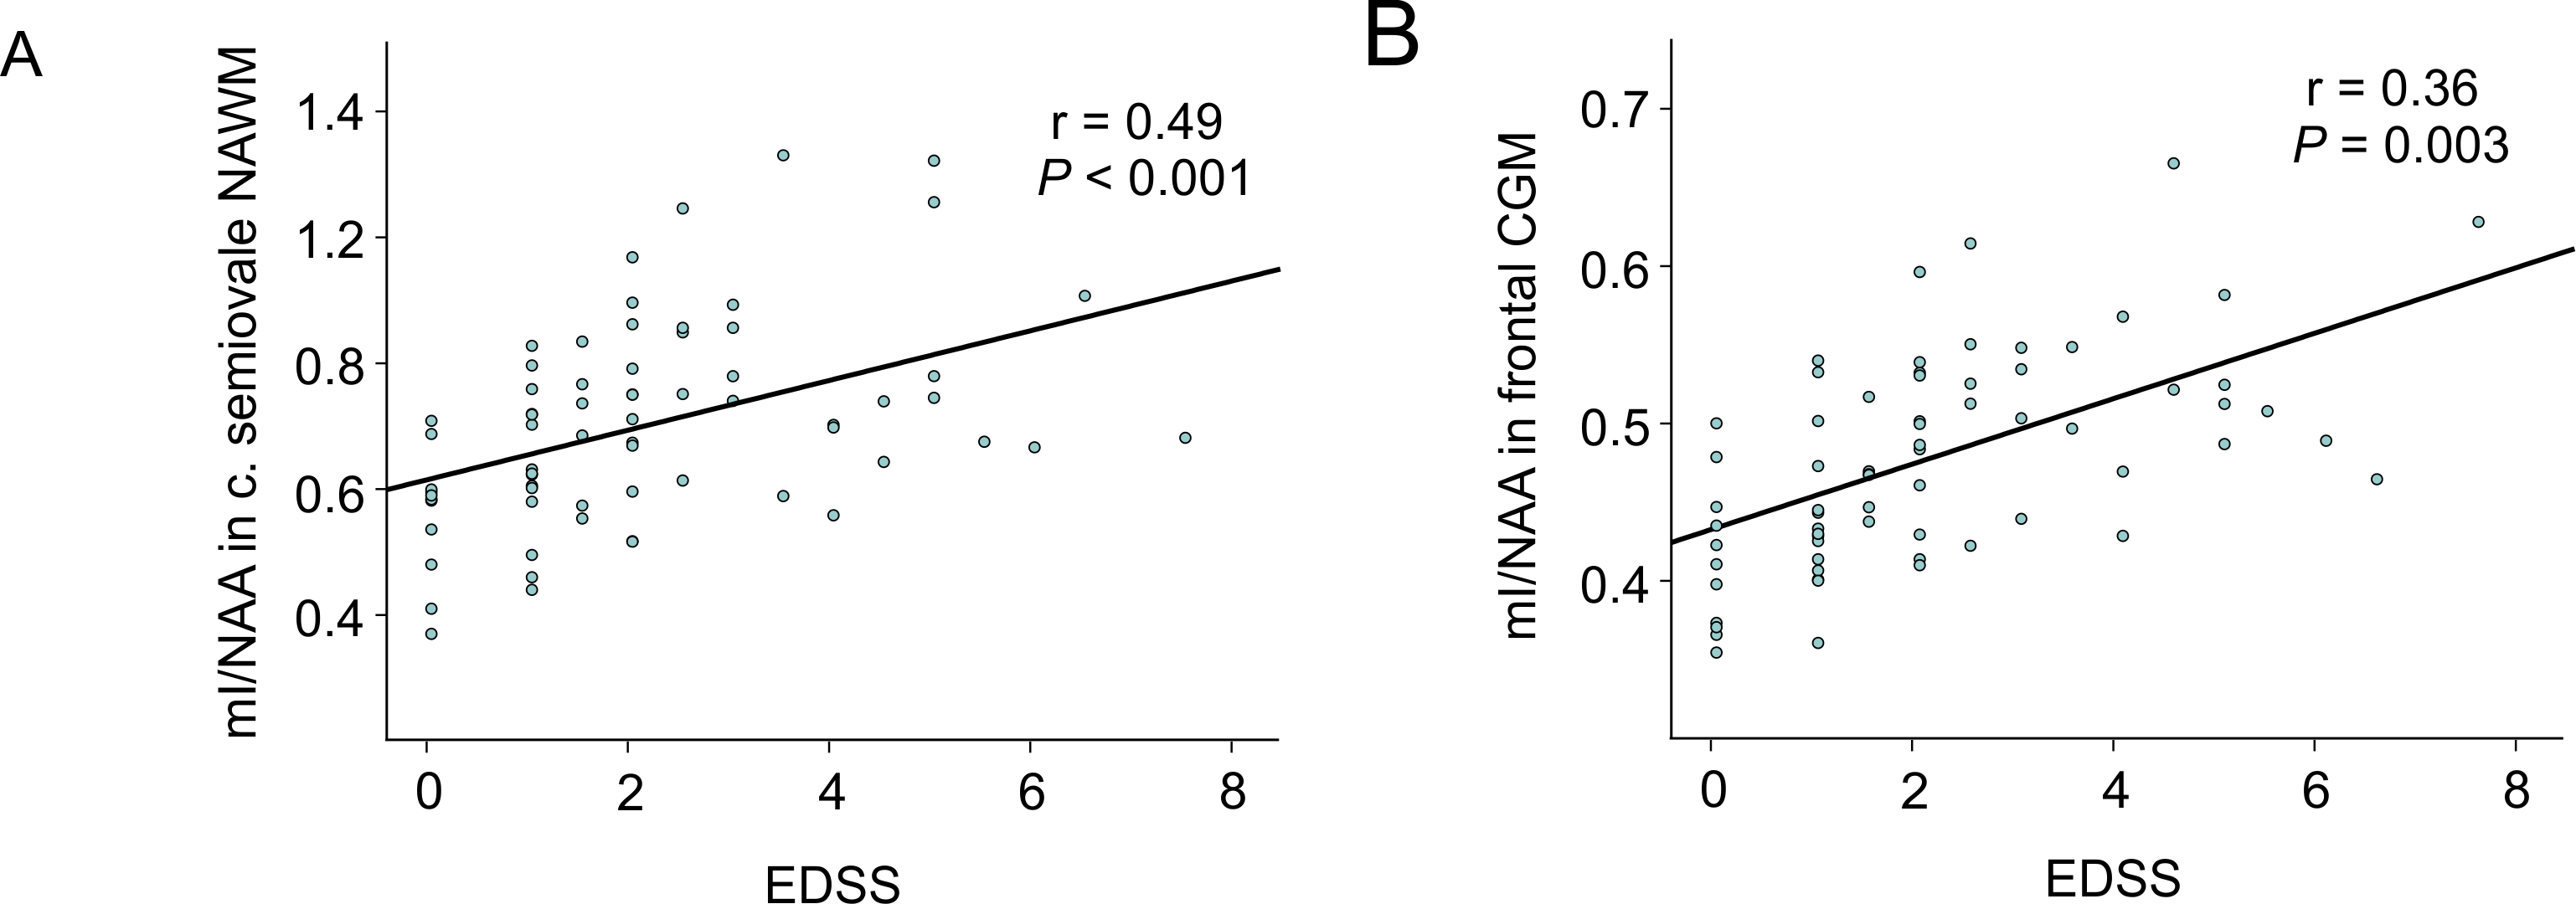
Figure 5: Correlations between mean
metabolic ratios and EDSS score in MS. Increased mI/NAA in the NAWM of centrum
semiovale (A) and the frontal CGM (B) were associated with clinical disability
(i.e., EDSS).