0484
Correlations of serum neurofilament with myelin, axonal and volumetric imaging in multiple sclerosis
Jackie Yik1,2, Pierre Becquart3, Jasmine Gill3, Shannon H. Kolind1,2,4,5, Virginia Devonshire5, Ana-Luiza Sayao5, Alice Schabas5, Robert Carruthers5, Anthony Traboulsee5, G.R. Wayne Moore2,3, David K.B. Li4,5, Sophie Stukas3, Cheryl Wellington3, Jacqueline A. Quandt3, Irene M. Vavasour2,4, and Cornelia Laule1,2,3,4
1Physics and Astronomy, University of British Columbia, Vancouver, BC, Canada, 2International Collaboration on Repair Discoveries, Vancouver, BC, Canada, 3Pathology and Laboratory Medicine, University of British Columbia, Vancouver, BC, Canada, 4Radiology, University of British Columbia, Vancouver, BC, Canada, 5Medicine, University of British Columbia, Vancouver, BC, Canada
1Physics and Astronomy, University of British Columbia, Vancouver, BC, Canada, 2International Collaboration on Repair Discoveries, Vancouver, BC, Canada, 3Pathology and Laboratory Medicine, University of British Columbia, Vancouver, BC, Canada, 4Radiology, University of British Columbia, Vancouver, BC, Canada, 5Medicine, University of British Columbia, Vancouver, BC, Canada
Synopsis
Neurofilaments, particularly the light subunit (NfL), have become a biomarker of interest in multiple sclerosis (MS) and can be measured in blood serum after neuronal damage. NfL has been studied in MS prognosis and treatment monitoring, but little is known about the relationship between NfL and advanced quantitative MRI measures. This exploratory study characterizes the relationship between NfL and myelin water fraction and diffusion measures in different brain regions through regression models. We found NfL to correlate with myelin and axonal damage measures in the whole brain and normal appearing white matter but only to myelin water fraction in lesions.
Introduction
Neurofilaments are neuronal-specific proteins involved in neuroaxonal functions like determining axonal diameter, indirectly moderating axon conduction velocity, and transporting organelles and other proteins1. They are the single most abundant protein in mature myelinated axons2,3 and consist of light (NfL), medium, and heavy chain subunits4. After neuronal tissue damage, neurofilaments are detectable in the cerebrospinal fluid and blood in neurological trauma and diseases including multiple sclerosis (MS)2. NfL has become a biomarker of interest for MS, with more than 200 studies in the past two years associating NfL with outcomes related to disease activity, progression, treatment response, and prognosis2.Metrics derived from advanced quantitative MRI techniques specific to myelin content and axonal integrity have also been proposed as potential biomarkers of MS disease processes. Myelin water fraction (MWF), which reflects myelin content, can be obtained by myelin water imaging9,10, and high angular resolution diffusion imaging (HARDI) provides axial diffusivity (AD) and fractional anisotropy (FA), which decrease with axonal loss, and radial diffusivity (RD), which decreases with myelin damage11,12. While there have been many studies associating higher NfL levels in the blood with disease progression, greater MRI lesion volume, and brain atrophy2, no publications, to our knowledge, have examined the relationship between NfL and advanced imaging measures in MS.
Objective: To assess the relationship between MS serum NfL and MRI (1) volumes and (2) metrics reflecting damage to myelin (MWF, RD) and axons (AD, FA) in whole brain (WB), normal appearing white matter (NAWM), and lesions.
Methods
Participants and Data Collection: 103 participants (demographics in Figure 1) underwent 3T MRI (Philips Achieva). Scanning sequences included 48-echo GRASE T2 relaxation (TR/TE=1073/8ms, 1x1x2.5mm3, 40 slices)13, HARDI (b=700s/mm2, 60 directions, TR/TE=7090/60ms, 2x2x2.2mm3, 70 slices), structural proton-density (PD)/T2-weighted (TR/TE1/TE2=2900/8.42/80ms, 1x1x3mm3) and 3DT1-MPRAGE (TR/TE/TI=3000/3.5/926ms, 1x1x1mm3). Blood was collected from participants on the same day as MR experiments.Analysis: Voxel-wise T2 distributions were calculated using a modified Extended Phase Graph algorithm combined with regularized non-negative least squares and flip angle optimization14,15. MWF was defined as the fraction of signal with T2<40ms. HARDI data was analyzed using FDT (FSL toolbox)16,17. MWF, FA, AD, RD and 3DT1 images were registered to PD images using FLIRT18. WB masks were made using brain extraction from Advanced Normalization Tools (ANTs)19. NAWM masks were created using FAST20 on registered 3DT1. Lesions were semi-automatically segmented using seed points21. Masks were overlaid onto registered MWF, RD, FA and AD maps to obtain mean measurements. Normalized brain volume was calculated using in-house software22. Cortical thickness was determined with ANTs19. Thalamic and deep grey matter (GM, caudate + putamen + thalamus + pallidum) volumes were calculated with FIRST23.
Serum NfL was quantified by single molecule array (SIMOA) technology (Quanterix) and logarithmically transformed for normality. Lesion volume was transformed for normality by taking the cube root. Separate linear regressions using ordinary least squares were performed between transformed NfL and each metric with age, disease duration, EDSS, MS subtype, and the interaction between subtypes and each metric as covariates. The models were compared with reduced models without the interaction term and subtypes using ANOVA.
Results
Demographics, serum NfL levels, and regression slopes (β) for each metric are shown in Figure 1. Slopes for all metrics were not different between subtypes (ANOVA p>0.05). Using a statistically significant level of p=0.05, all volumetric measures significantly regressed with NfL. In WB and NAWM, all metrics had significant regressions (MWFWB p=0.021, MWFNAWM p=0.016; RDWB p=0.002, RDNAWM p=0.0004; ADWB p=0.005, ADNAWM p=0.029; FAWB p=0.019, FANAWM p=0.004), while in lesions, only MWF was significant (p=0.025). Regression plots for the volumetric measures, WB, NAWM, and lesions are shown in Figures 2,3,4 and 5. All regression lines were plotted for mean age and disease duration and median EDSS of the entire dataset displayed in Figure 1 with the 95% confidence interval shaded.Discussion
Our findings relating NfL with volumetric measures are consistent with previous studies2,24-29. The many significant regressions between myelin metrics and NfL in different regions are interesting considering neurofilaments are predominantly a component of axons, not myelin. However, myelin and axon health are strongly coupled, and it may be that the myelin MRI measures used in this study are more sensitive to damage than the axonal MRI measures. NAWM studies show evidence of both axonal loss as well as myelin damage9,10. Although GM pathology in MS is not well understood30, there has been evidence to show GM atrophy is associated with pathology in connected WM tracts31. The similar findings between regressions in WB and NAWM could be driven by this complex association between myelin and axons as well as NAWM and GM pathology. In MS lesions, there is a greater degree of loss of myelin than axons9, and only one of our myelin metrics was significant, possibly due to the diffusion measures being confounded by edema or other effects9.Conclusion
In this exploratory study, serum NfL correlated to both myelin (MWF, RD) and axonal (AD, FA) damage metrics in the WB and NAWM, and only to MWF in lesions. With associations to myelin in multiple regions of the brain, serum NfL may be a useful biomarker that reflects not only axonal loss, but also myelin damage and brain volume changes.Acknowledgements
Many thanks to the MS participants and their families as well as the MRI technicians at the UBC MRI Research Centre. This work was funded by the MS Society of Canada and the Natural Sciences and Engineering Research Council of Canada.References
- Yuan A, Rao MV, Veeranna, Nixon RA. Neurofilaments and neurofilament proteins in health and disease. Cold Spring Harb. Perspect. Biol. 2017;9(4):a018309.
- Thebault S, Booth RA, Freedman MS. Blood Neurofilament Light Chain: The Neurologist's Troponin? Biomedicines. 2020;8(11):523.
- Fliegner KH, Liem RKH. Cellular and Molecular Biology of Neuronal Intermediate Filaments. Int. Rev. Cytol. 1991;131:109–167.
- Yuan A, Rao MV, Sasaki T, et al. α-internexin is structurally and functionally associated with the neurofilament triplet proteins in the mature CNS. J. Neurosci. 2006;26(39):10006–10019.
- Koel-Simmelink MJA, Teunissen CE, Behradkia P, Blankenstein MA, Petzold A. The neurofilament light chain is not stable in vitro. Ann. Neurol. 2011;69(6):1065–1066.
- Kuhle J, Plattner K, Bestwick JP, et al. A comparative study of CSF neurofilament light and heavy chain protein in MS. Mult Scler. 2013;19(12):1597-1603.
- Igra MS, Paling D, Wattjes MP, Connolly DJA, Hoggard N. Multiple sclerosis update: use of MRI for early diagnosis, disease monitoring and assessment of treatment related complications. Br J Radiol. 2017;90(1074):20160721.
- Wattjes MP, Steenwijk MD, Stangel M. MRI in the Diagnosis and Monitoring of Multiple Sclerosis: An Update. Clin Neuroradiol. 2015;25 Suppl 2:157-165.
- Laule C, Moore GRW. Myelin water imaging to detect demyelination and remyelination and its validation in pathology. Brain Pathol. 2018;28(5):750-764.
- Laule C, Vavasour IM, Moore GR, et al. Water content and myelin water fraction in multiple sclerosis. A T2 relaxation study. J Neurol. 2004;251(3):284-293.
- Beaulieu C. The basis of anisotropic water diffusion in the nervous system - a technical review. NMR Biomed. 2002;15(7-8):435-455.
- Bammer R. Basic principles of diffusion-weighted imaging. Eur J Radiol. 2003;45(3):169-184.
- Zhang J, Vavasour I, Kolind S, et al. Advanced Myelin Water Imaging Techniques for Rapid Data Acquisition and Long T2 Component Measurements. ISMRM. 2015; p824.
- Prasloski T, Mädler B, Xiang Q-S, et al. Applications of stimulated echo correction to multicomponent T2 analysis. Magn Reson Med. 2012; 67: 1803–1814.
- Whittall KP and MacKay AL. Quantitative interpretation of NMR relaxation data. J Magn Reson. 1989; 84: 134–152.
- Behrens TE, Woolrich MW, Jenkinson M, et al. Characterization and propagation of uncertainty in diffusion-weighted MR imaging. Magn Reson Med. 2003;50(5):1077-1088.
- Behrens TE, Berg HJ, Jbabdi S, Rushworth MF, Woolrich MW. Probabilistic diffusion tractography with multiple fibre orientations: What can we gain?. Neuroimage. 2007;34(1):144-155.
- Jenkinson M, Bannister PR, Brady JM, and Smith SM. Improved optimisation for the robust and accurate linear registration and motion correction of brain images. NeuroImage. 2002;17(2):825-841.
- Das SR, Avants BB, Grossman M, Gee JC. Registration based cortical thickness measurement. Neuroimage. 2009;45:867-79.
- Zhang Y, Brady M, Smith S. Segmentation of brain MR images through a hidden Markov random field model and the expectation-maximization algorithm. IEEE Trans Med Imag. 2001;20(1):45-57.
- McAusland J, Tam RC, Wong E, et al. Optimizing the Use of Radiologist Seed Points for Improved Multiple Sclerosis Lesion Segmentation. IEEE Trans Biomed Eng. 2010;57:2689–2698.
- Wicks E, Chiu JPC, Tang LYW, Lam K, Riddehough A, Li DKB, Traboulsee A, Tam R. Automatic Computation of Normalized Brain Volume on 3D T1-Weighted MRI Scans Without Registration to Standard Space, ISMRM. 2015, 3750.
- Patenaude B, Smith SM, Kennedy D, Jenkinson M. A Bayesian Model of Shape and Appearance for Subcortical Brain. NeuroImage. 2011; 56: 907-922.
- Kuhle J, Kropshofer H, Haering DA, et al. Blood neurofilament light chain as a biomarker of MS disease activity and treatment response. Neurology. 2019;92(10):e1007-e1015.
- Jakimovski D, Kuhle J, Ramanathan M, et al. Serum neurofilament light chain levels associations with gray matter pathology: a 5-year longitudinal study [published correction appears in Ann Clin Transl Neurol. 2019 Dec;6(12):2607]. Ann Clin Transl Neurol. 2019;6(9):1757-1770.
- Håkansson I, Tisell A, Cassel P, et al. Neurofilament levels, disease activity and brain volume during follow-up in multiple sclerosis. J Neuroinflammation. 2018;15(1):209.
- Barro C, Benkert P, Disanto G, et al. Serum neurofilament as a predictor of disease worsening and brain and spinal cord atrophy in multiple sclerosis. Brain. 2018;141(8):2382-2391.
- Filippi P, Vestenická V, Siarnik P, et al. Neurofilament light chain and MRI volume parameters as markers of neurodegeneration in multiple sclerosis. Neuro Endocrinol Lett. 2020;41(1):17-26.
- Gaetani L, Salvadori N, Lisetti V, et al. Cerebrospinal fluid neurofilament light chain tracks cognitive impairment in multiple sclerosis. J Neurol. 2019;266(9):2157-2163.
- Amiri H, de Sitter A, Bendfeldt K, et al. Urgent challenges in quantification and interpretation of brain grey matter atrophy in individual MS patients using MRI. Neuroimage Clin. 2018;19:466-475.
- Steenwijk MD, Daams M, Pouwels PJ, et al. Unraveling the relationship between regional gray matter atrophy and pathology in connected white matter tracts in long-standing multiple sclerosis. Hum Brain Mapp. 2015;36(5):1796-1807.
Figures
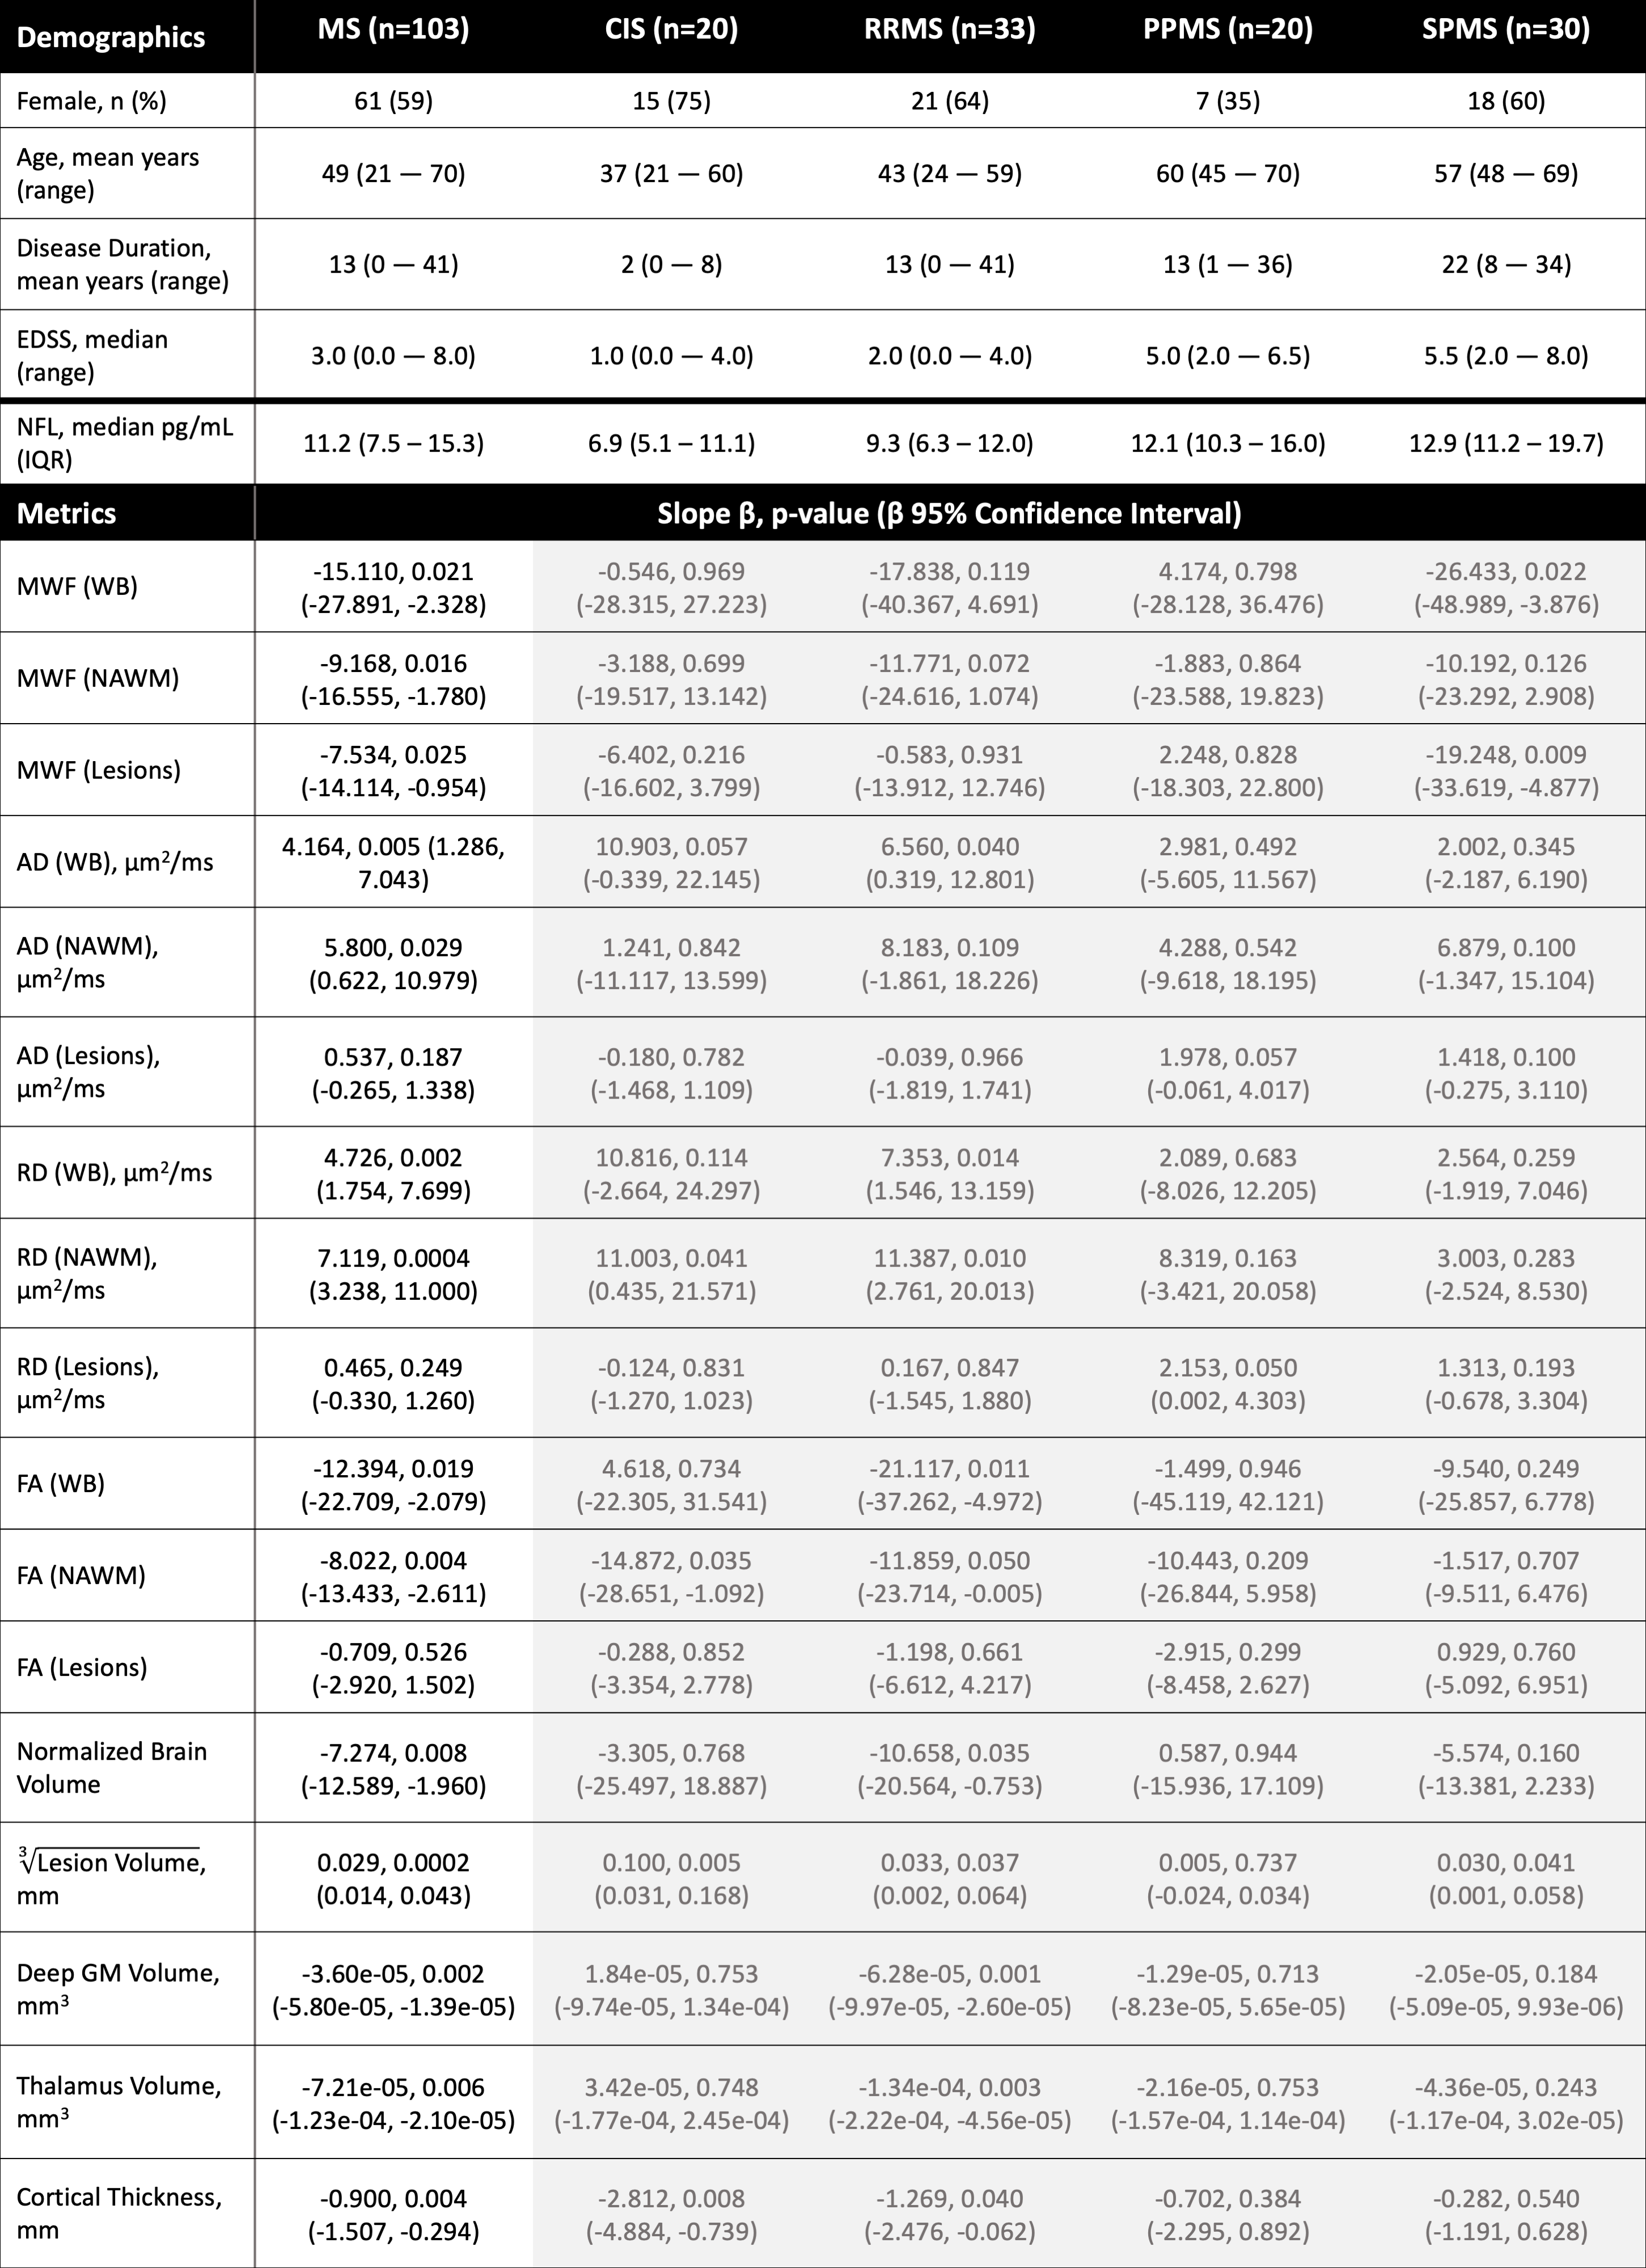
Demographic information and serum neurofilament light chain level of the participants, along with parameters from the regression model with (shaded in grey) and without MS subtypes and subtype interactions with the metric included. The grey shading indicates the interaction and subtype terms were not significant when ANOVA test was conducted between the model with and without those terms.
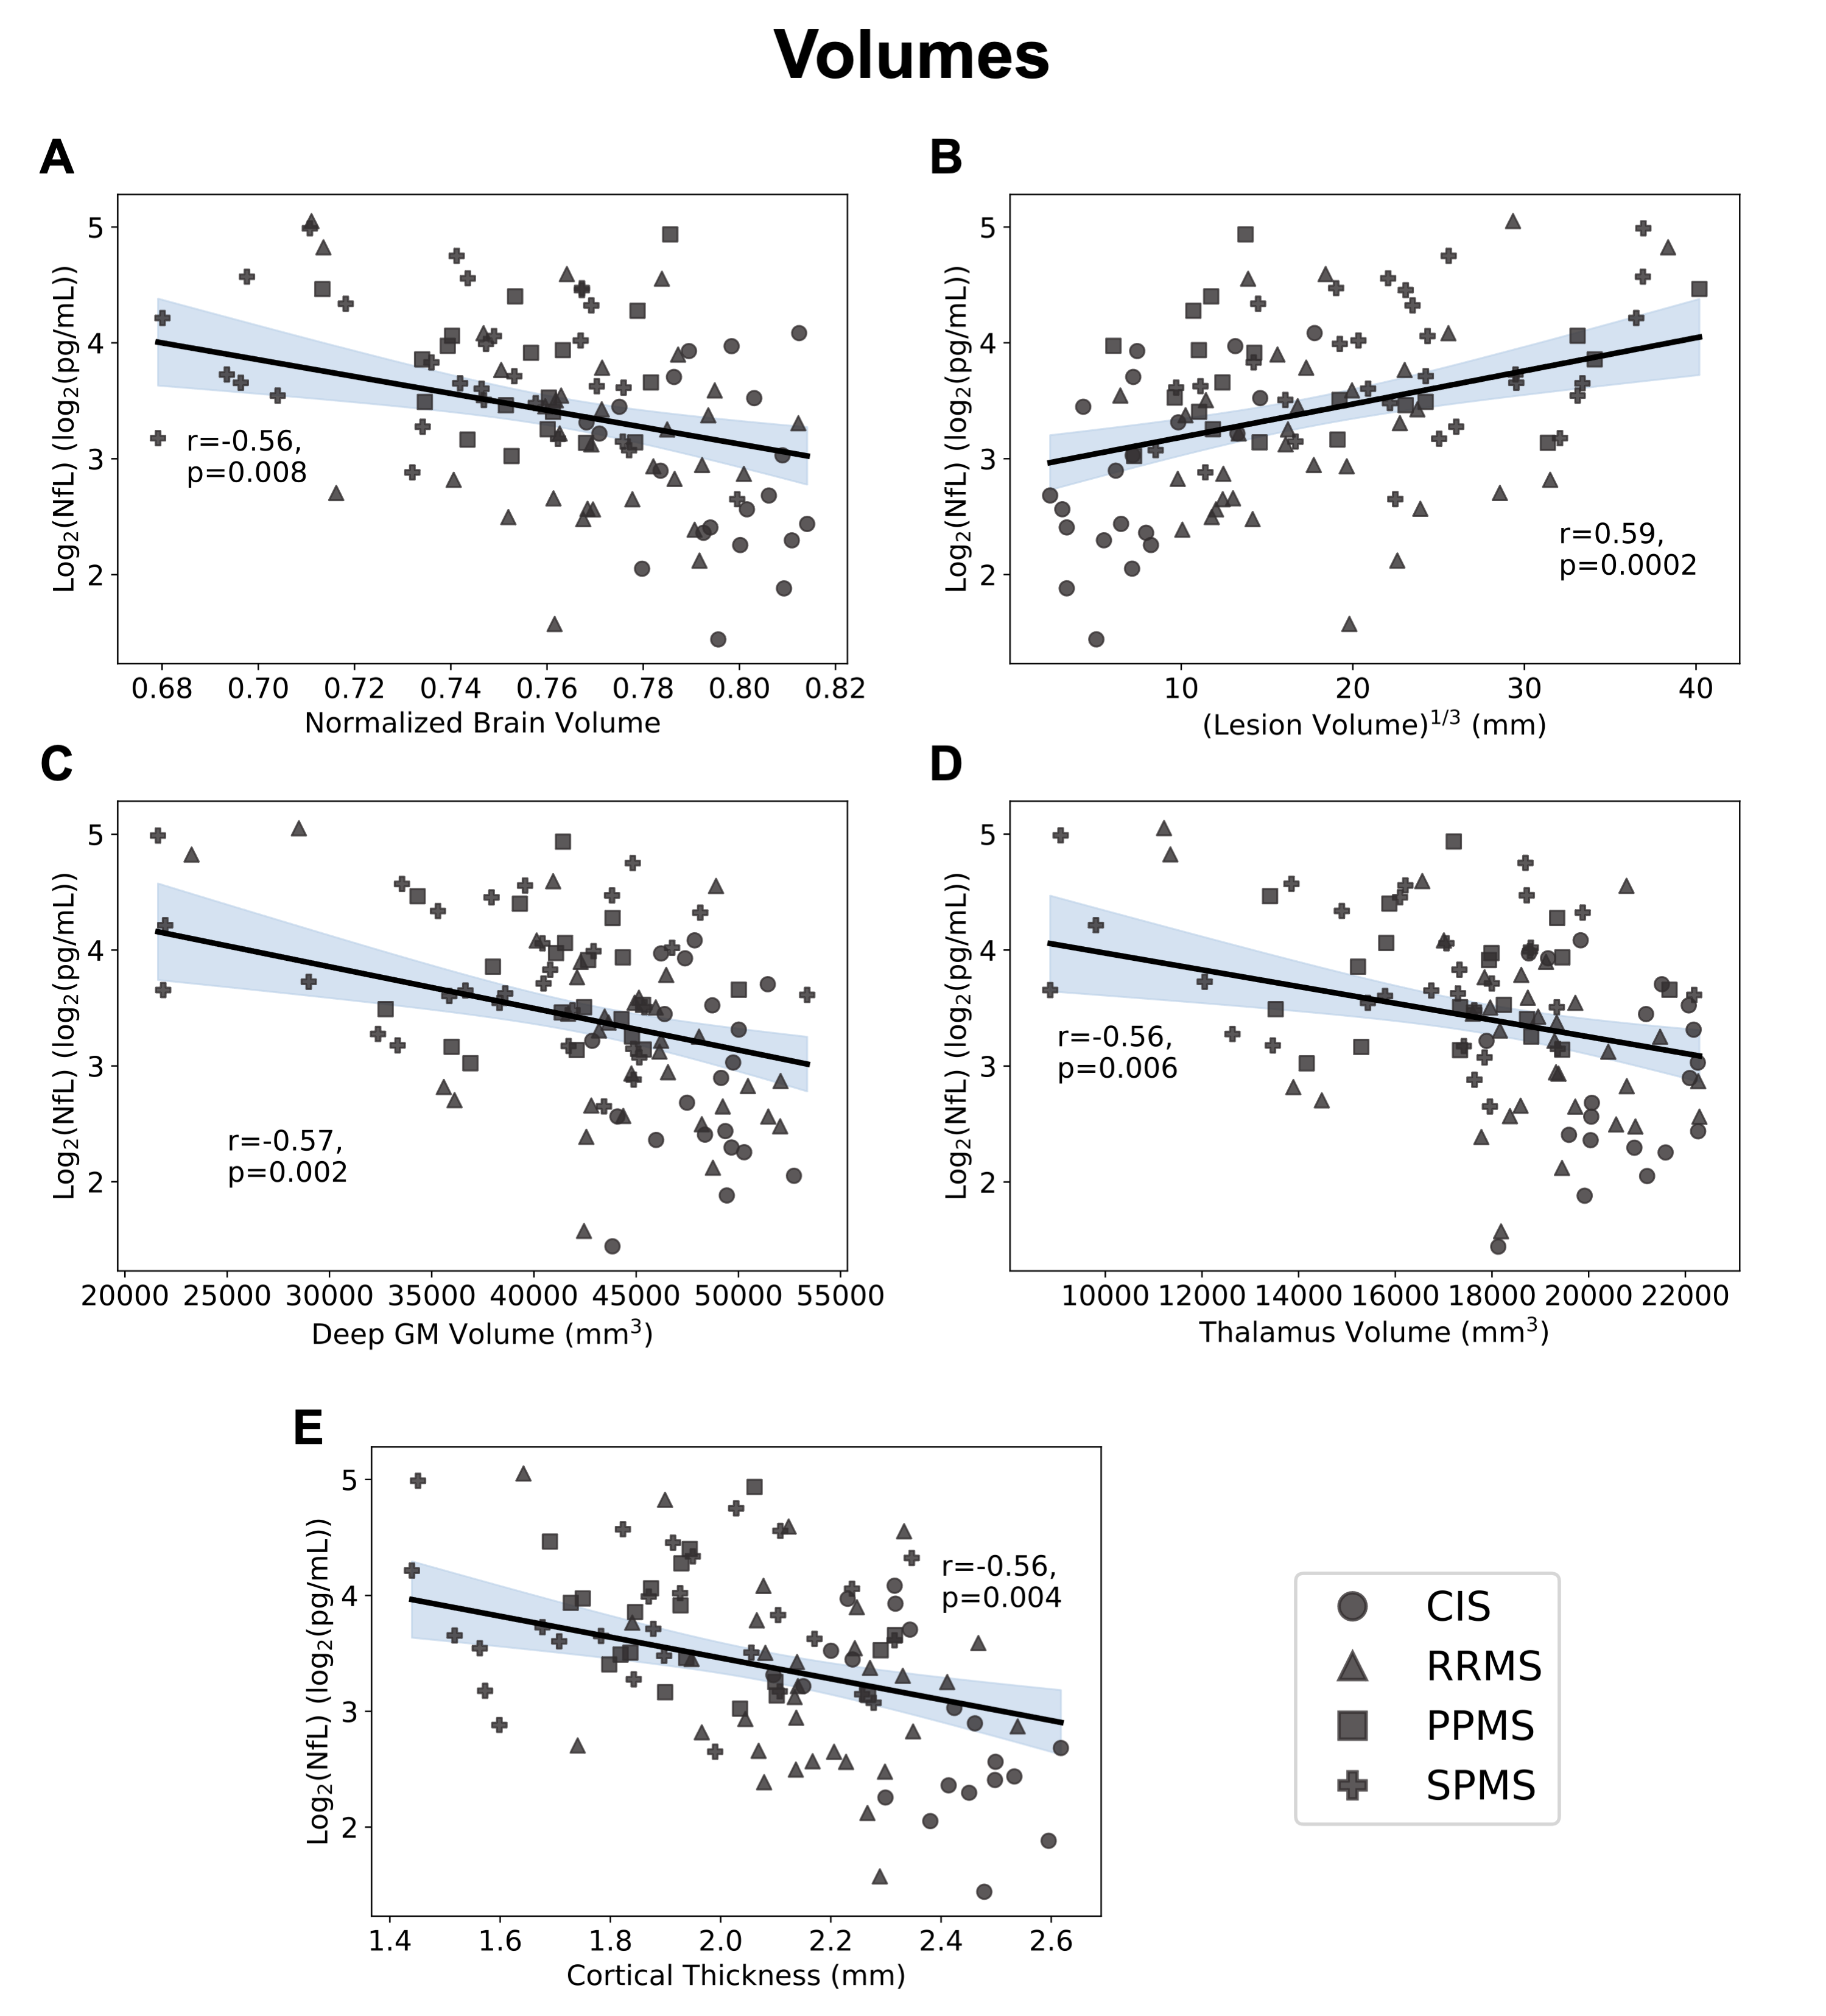
Regression plots for the relationship between logarithmically transformed serum neurofilament light chain (NfL) and volumetric imaging measures (normalized brain volume (A) r=-0.56, p=0.008; cube root lesion volume (B) r=0.59, p=0.0002; deep grey matter volume (C) r=-0.57, p=0.002; thalamus volume (D) r=-0.56, p=0.006; cortical thickness (E) r=-0.56, p=0.004). 95% confidence interval is shaded.
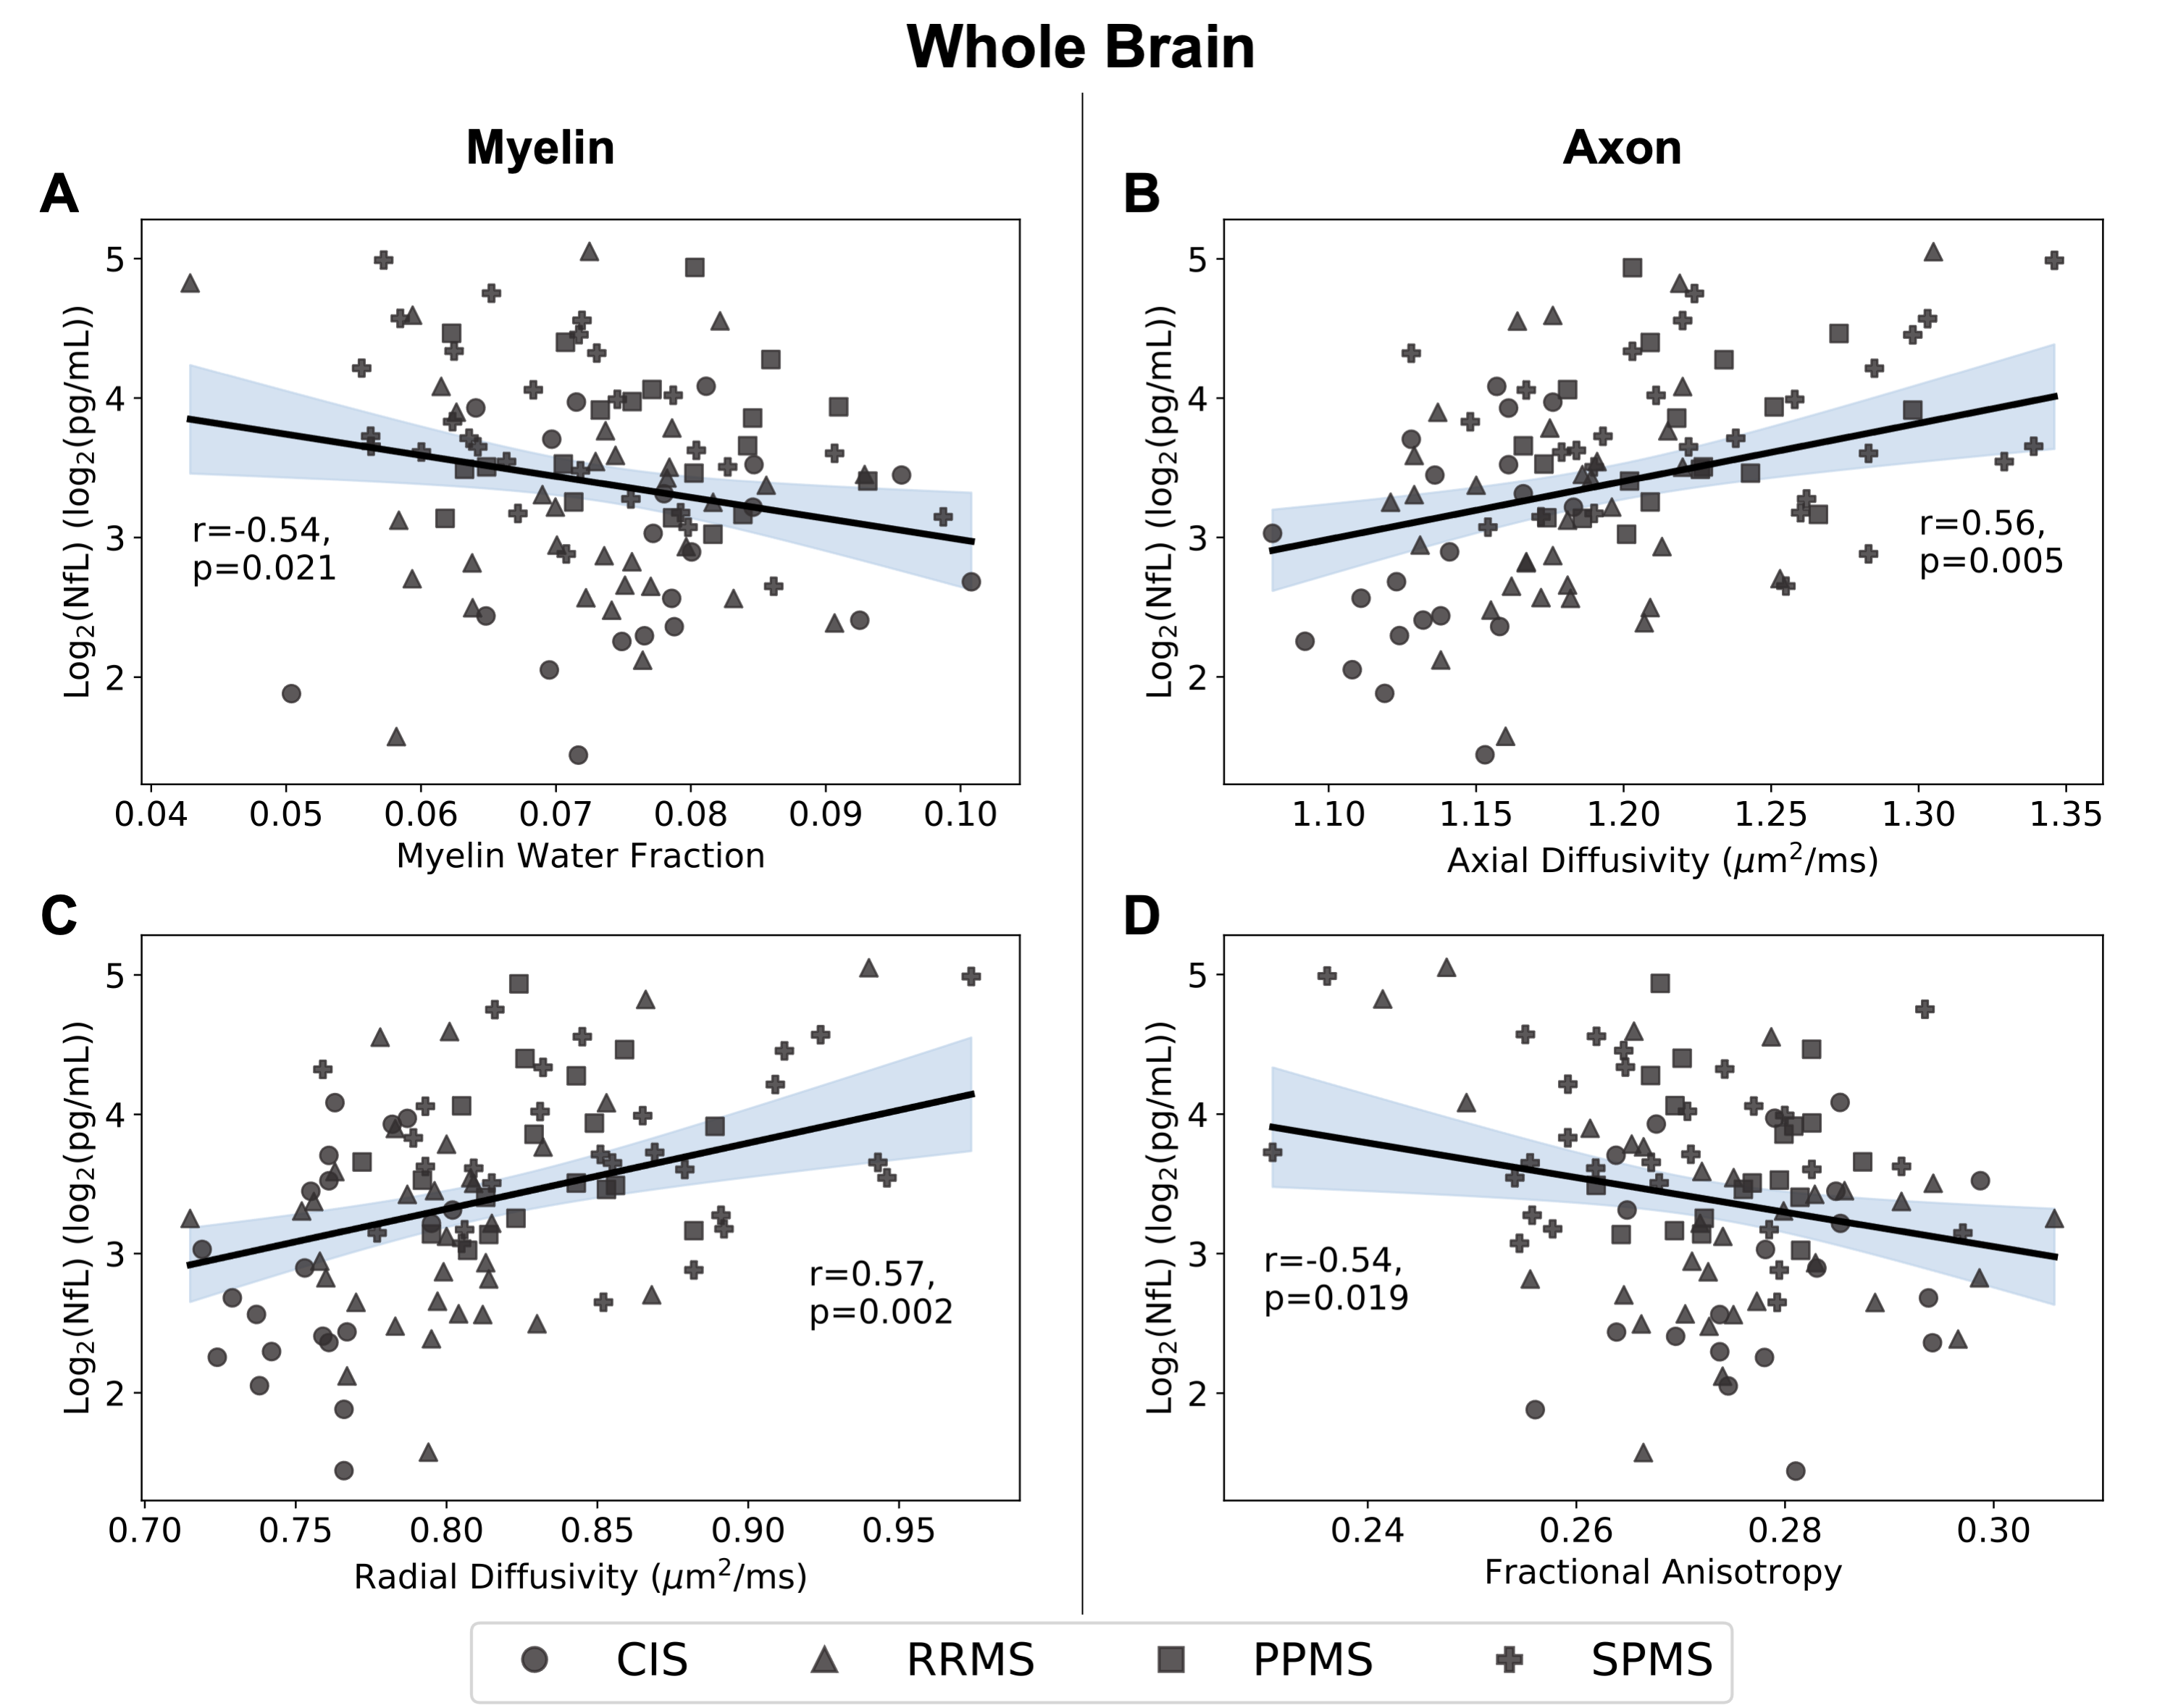
Regression plots for the whole brain region showing the relationship between logarithmically transformed serum neurofilament light (NfL) chain and measures for myelin content (myelin water fraction (A) r=-0.54, p=0.021; radial diffusivity (C) r=0.57, p=0.002) or axon integrity (axial diffusivity (B) r=0.56, p=0.005; fractional anisotropy (D) r=-0.54, p=0.019). 95% confidence interval is shaded.
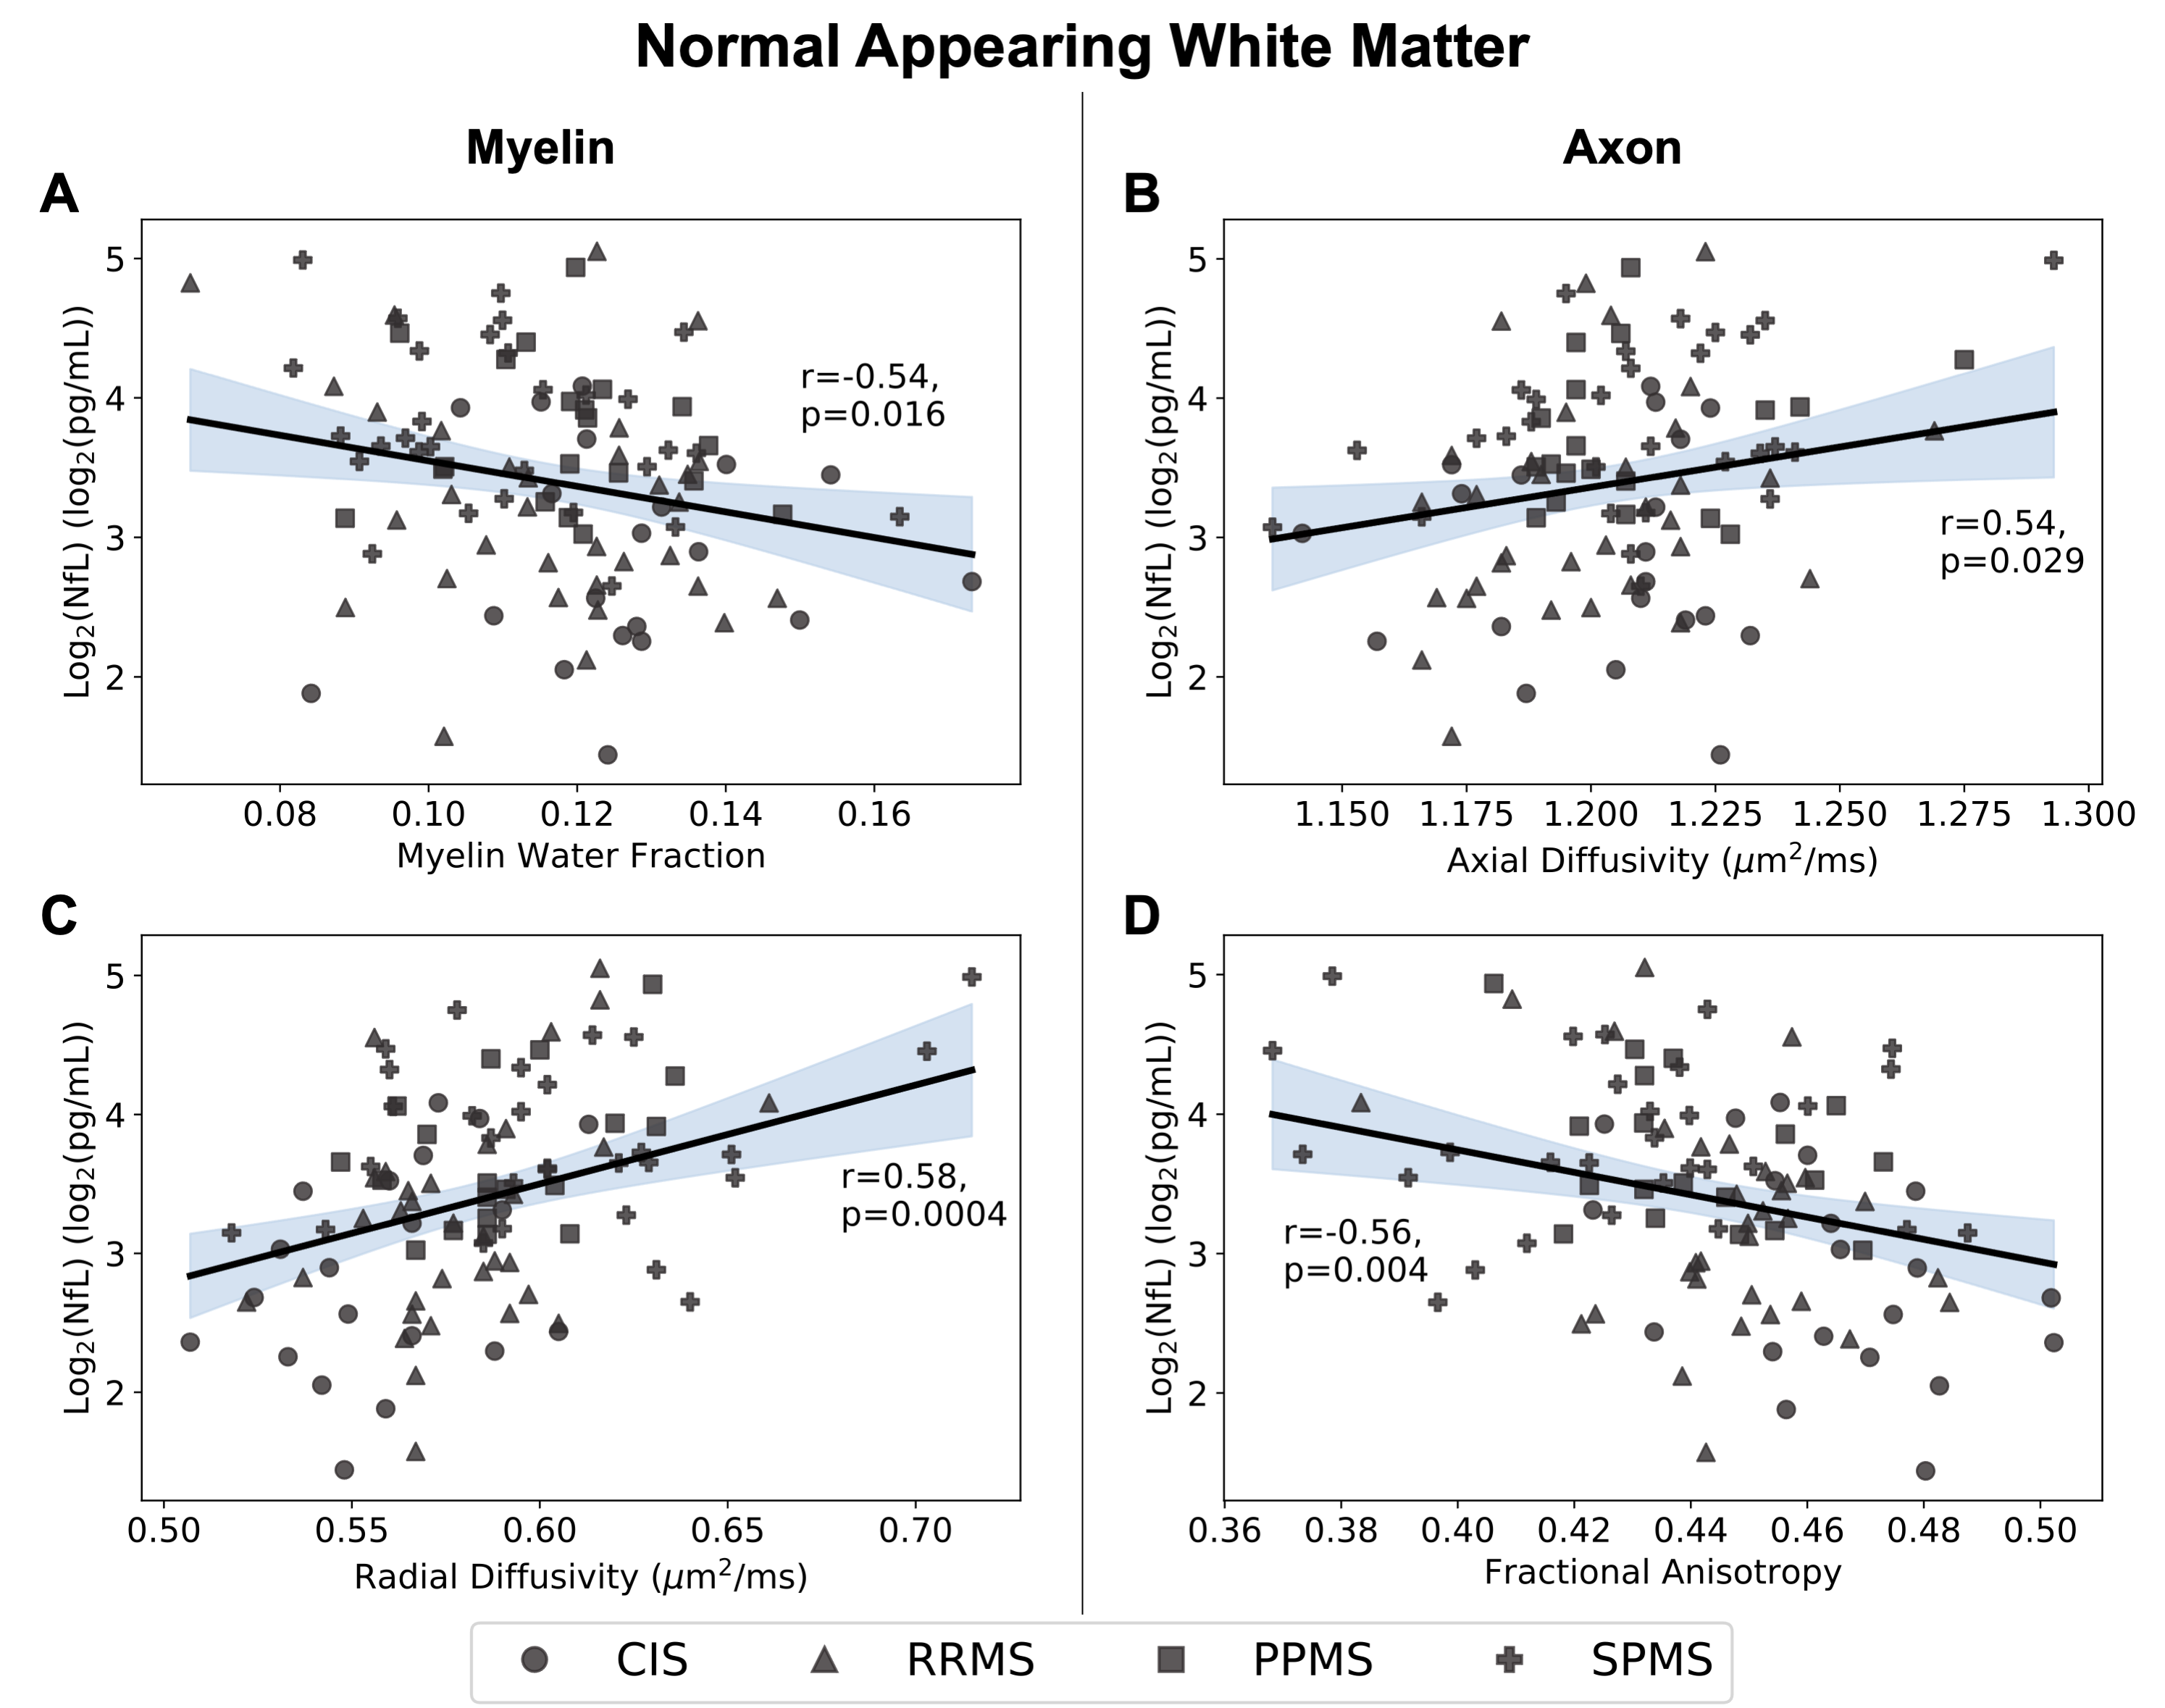
Regression plots for the normal appearing white matter region showing the relationship between logarithmically transformed serum neurofilament light (NfL) chain and measures for myelin content (myelin water fraction (A) r=-0.54, p=0.016; radial diffusivity (C) r=0.58, p=0.0004) or axon integrity (axial diffusivity (B) r=0.54, p=0.029; fractional anisotropy (D) r=-0.56, p=0.004). 95% confidence interval is shaded.
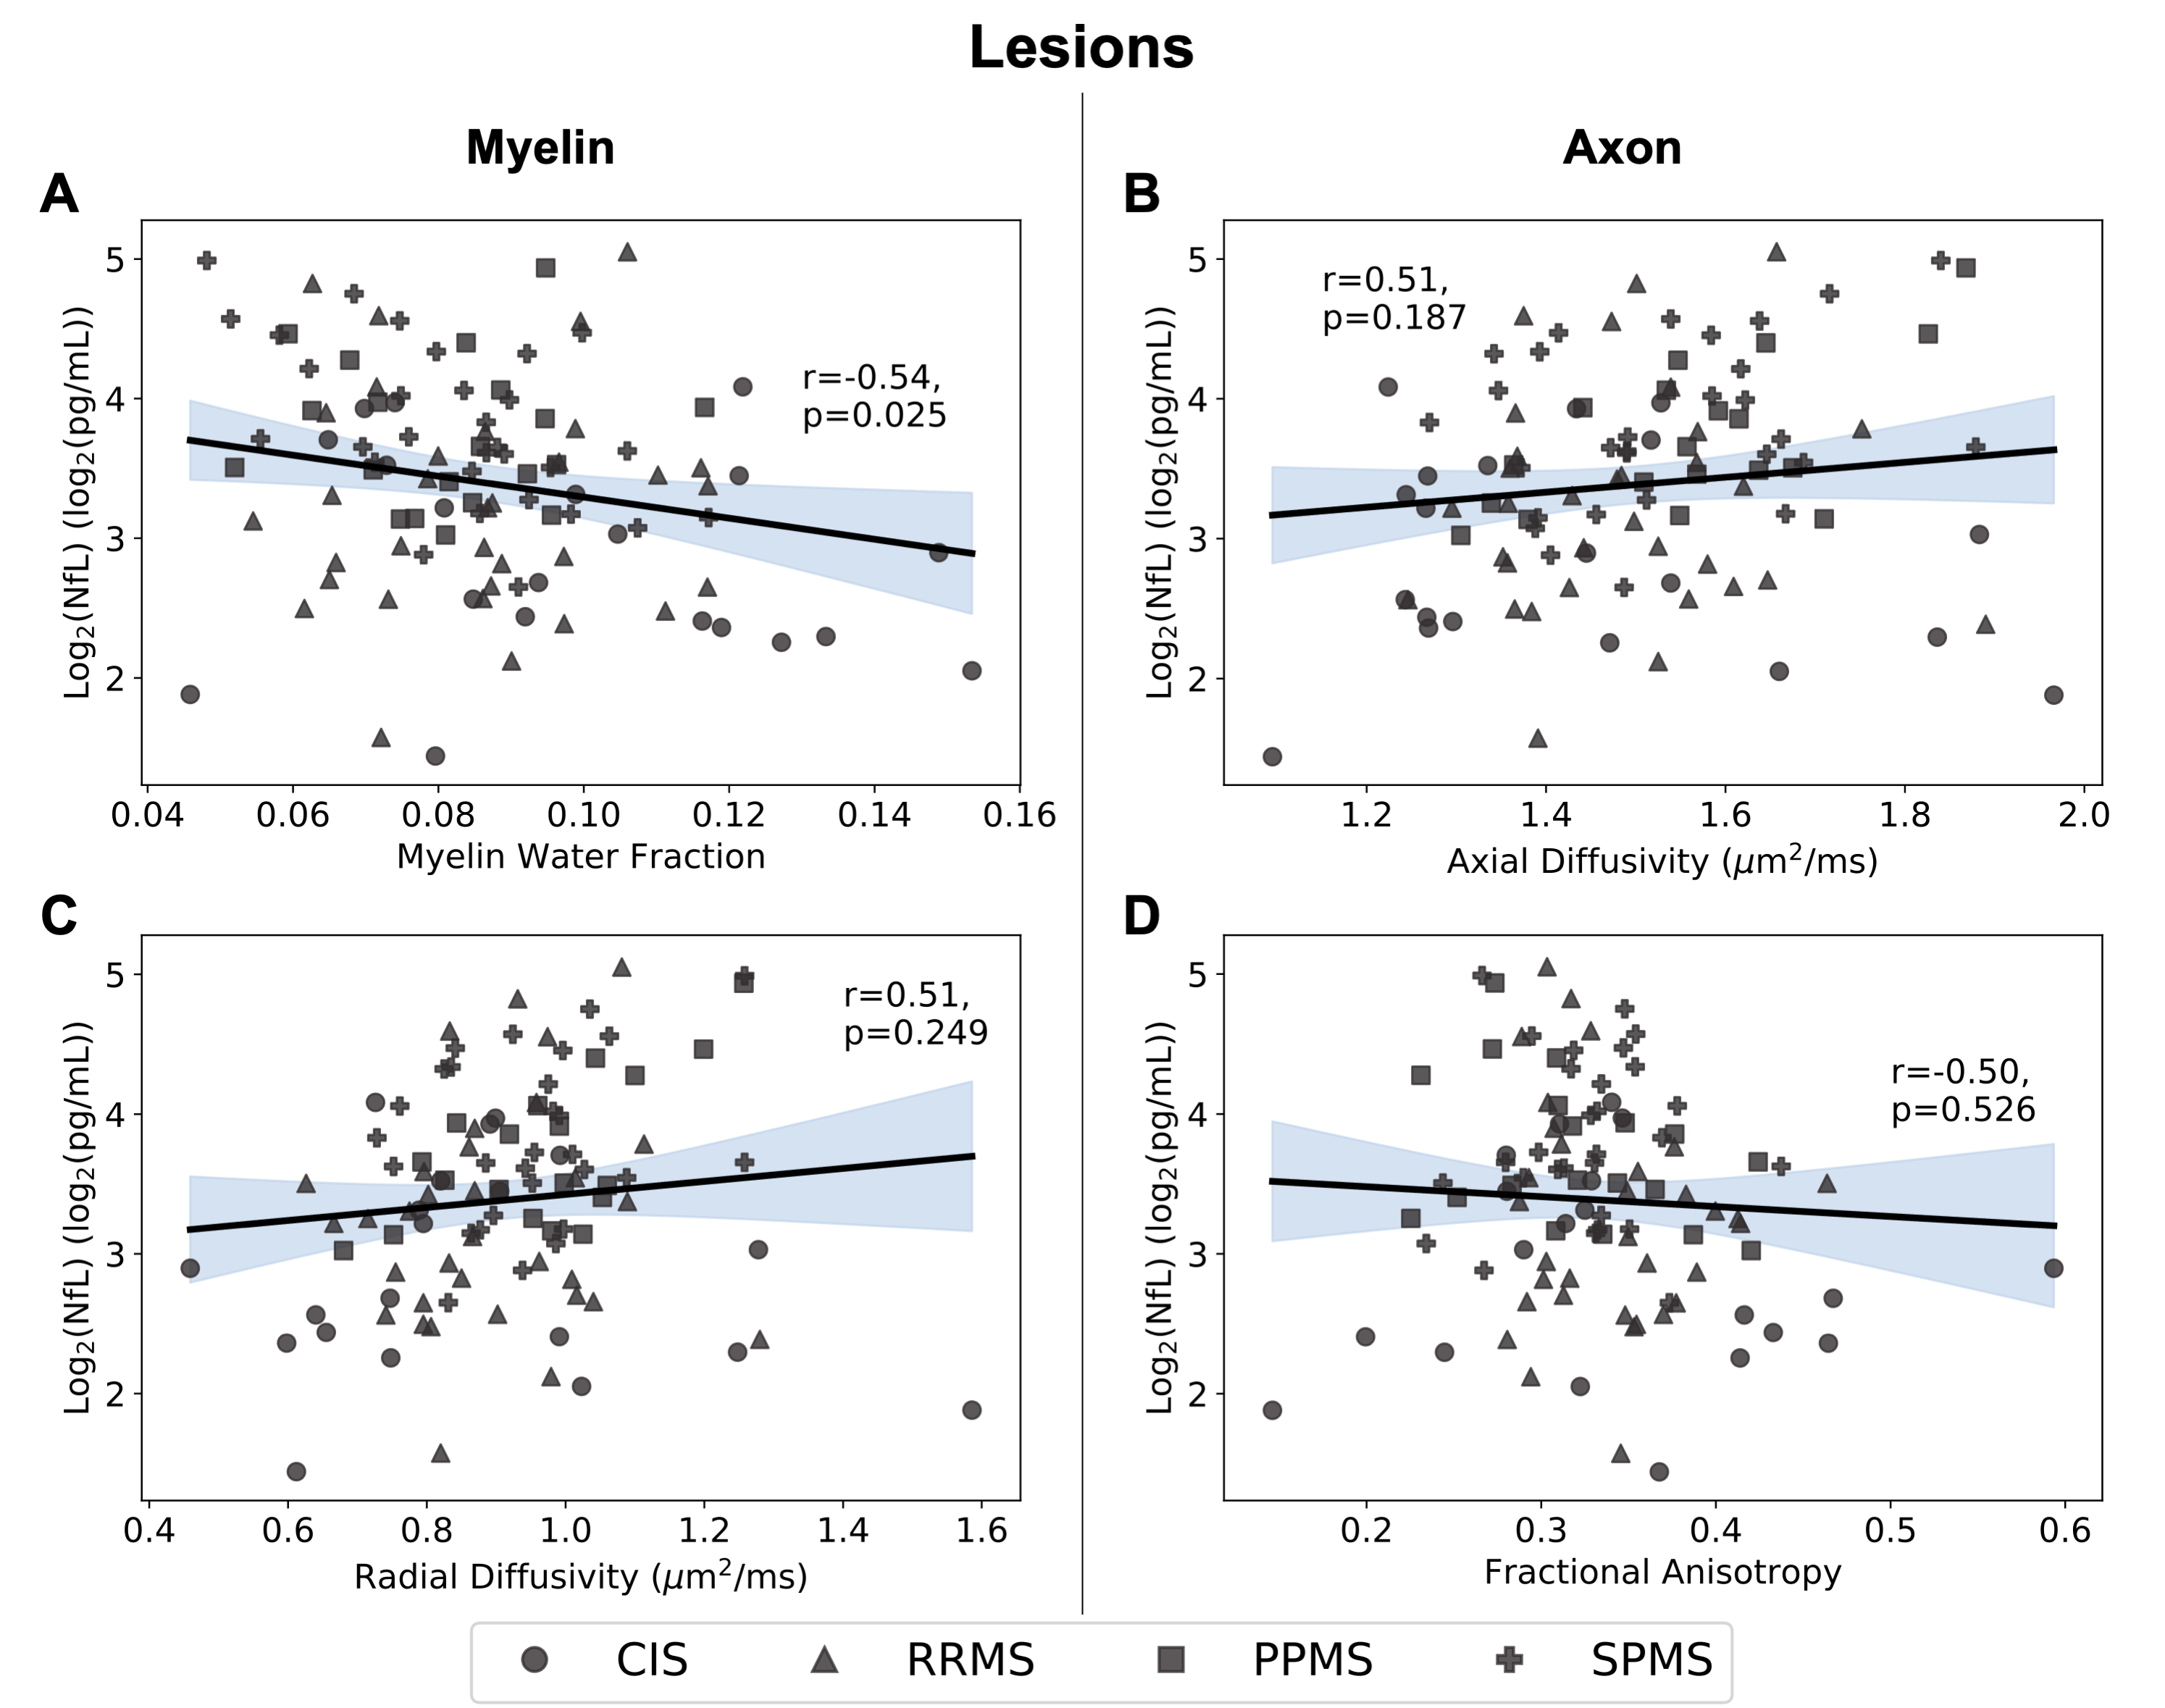
Regression plots for the lesions showing the relationship between logarithmically transformed serum neurofilament (NfL) light chain and measures for myelin content (myelin water fraction (A) r=-0.54, p=0.025; radial diffusivity (C) r=0.51, p=0.249) or axon integrity (axial diffusivity (B) r=0.51, p=0.187; fractional anisotropy (D) r=-0.50, p=0.526). 95% confidence interval is shaded.