0480
Comparison of Quantitative 3D Magnetic Resonance Cholangiopancreatography Biliary Tree Metrics derived from 3 Different Acquisition Methods1Imaging Research Center, Cincinnati Children's Hospital Medical Center, Cincinnati, OH, United States, 2Perspectum Ltd., Oxford, United Kingdom, 3Department of Radiology, Cincinnati Children's Hospital Medical Center, Cincinnati, OH, United States, 4Department of Radiology, University of Cincinnati College of Medicine, Cincinnati, OH, United States, 5Department of Pediatrics, University of Cincinnati College of Medicine, Cincinnati, OH, United States, 6Center for Autoimmune Liver Disease, Cincinnati Children's Hospital Medical Center, Cincinnati, OH, United States
Synopsis
Comparison of the performance of different methods of acquiring three-dimensional (3D) magnetic resonance cholangiopancreatography (MRCP) data have been largely qualitative. MRCP+ prototype software (Perspectum Ltd.; Oxford, UK) was used to derive quantitative biliary tree metrics from 3D MRCP acquired using three different methods. Intra-class correlation coefficients (ICCs) demonstrated strong agreement on biliary tree volume, median intrahepatic duct diameters, number of ducts, and length of dilations between 3D FSE and CS-FSE MRCP (ICCs=0.84-0.93); there was slightly less agreement between CS-FSE and 3D GRASE MRCP. Our results suggest that CS-FSE provides comparable visualization of the biliary system to conventional 3D FSE MRCP.
Introduction
Magnetic resonance cholangiopancreatography (MRCP) is the non-invasive imaging modality of choice to assess diseases of the pancreaticobiliary system1. Respiratory-triggered (RT) three-dimensional (3D) fast spin-echo (FSE) MRCP provides high signal-to-noise ratio and excellent spatial resolution2. However, it is limited by long acquisition times which, combined with variable triggering/navigation performance, often leads to suboptimal image quality3-6. Two methodologies, compressed sensing (CS) and gradient and spin-echo (GRASE) sequences, have recently been shown to reduce acquisition times while providing comparable image quality to standard 3D-FSE MRCP6-9. However, most published studies comparing MRCP acquisitions have been predominantly based on qualitative comparisons of image quality. In an era of increasing shift towards quantitative imaging, there is a need to compare acquisition techniques in terms of the quantitative results they produce. MRCP+ (Perspectum Ltd., Oxford, UK) is an image processing tool that provides quantitative metrics of the pancreaticobiliary ducts using 3D MRCP data. The purpose of this study is to compare MRCP+ prototype-derived biliary tree measurements using three different 3D MRCP acquisition methods.Methods
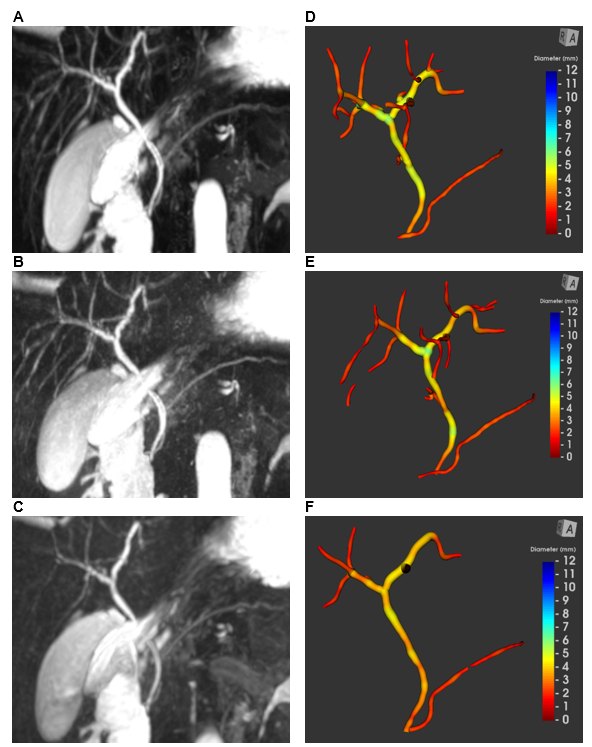
This is a single-center institutional review board-approved retrospective study. Clinically indicated MRI examinations acquired from October 2018 to March 2020 for patients up to 18 years of age that included combinations of 3D FSE MRCP, 3D CS-FSE (acceleration factor 8) MRCP, and 3D GRASE MRCP were identified and anonymized. All exams were acquired on 1.5T scanners (Ingenia; Philips Healthcare, Best, The Netherlands), with a 16-channel phased-array anterior surface coil. 3D models of the biliary trees were segmented from each image using a prototype version of MRCP+10 (Perspectum Ltd.; Oxford, UK). Representative MRCP images and 3D models are presented in Figure 1. The MRCP+ operator remained blinded to patient information as well as the acquisition method of each dataset. The following biliary tree metrics were quantified: biliary tree volume, median and maximum diameters of common bile duct and left and right hepatic bile ducts, total number of ducts, total number and length of strictures, and total number and length of dilations. Absolute agreement in metrics between the acquisition methods (3D FSE vs. CS-FSE and 3D CS-FSE vs. 3D GRASE) was assessed using intra-class correlation coefficients (ICC), with 95% confidence intervals (MedCalc Software; MedCalc Software, Ltd., Ostend, Belgium).Results
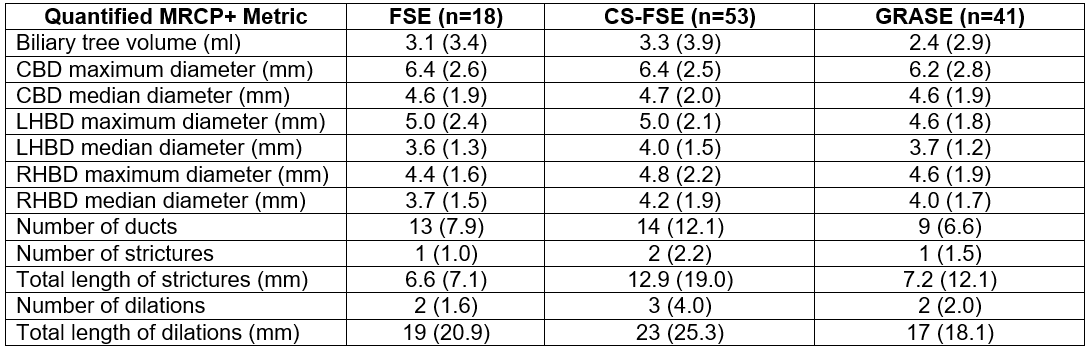
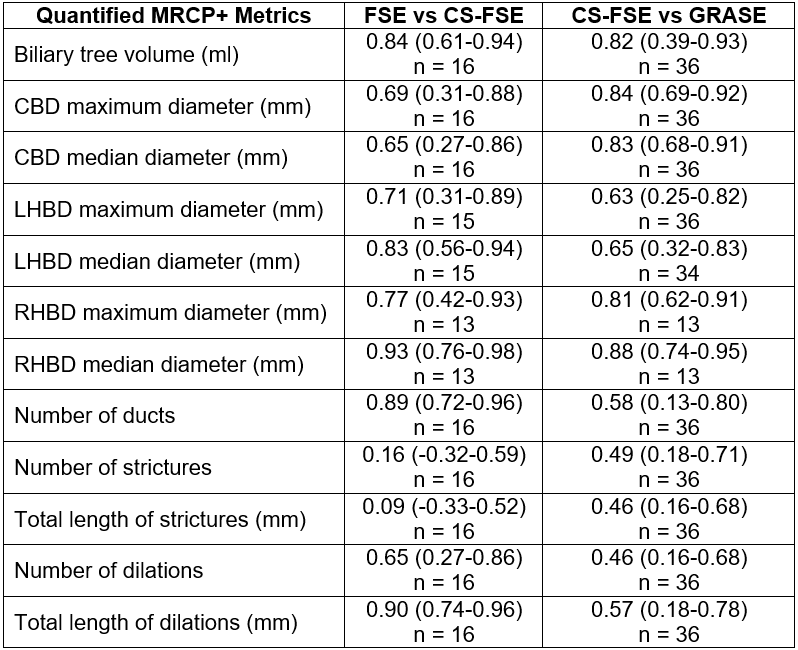
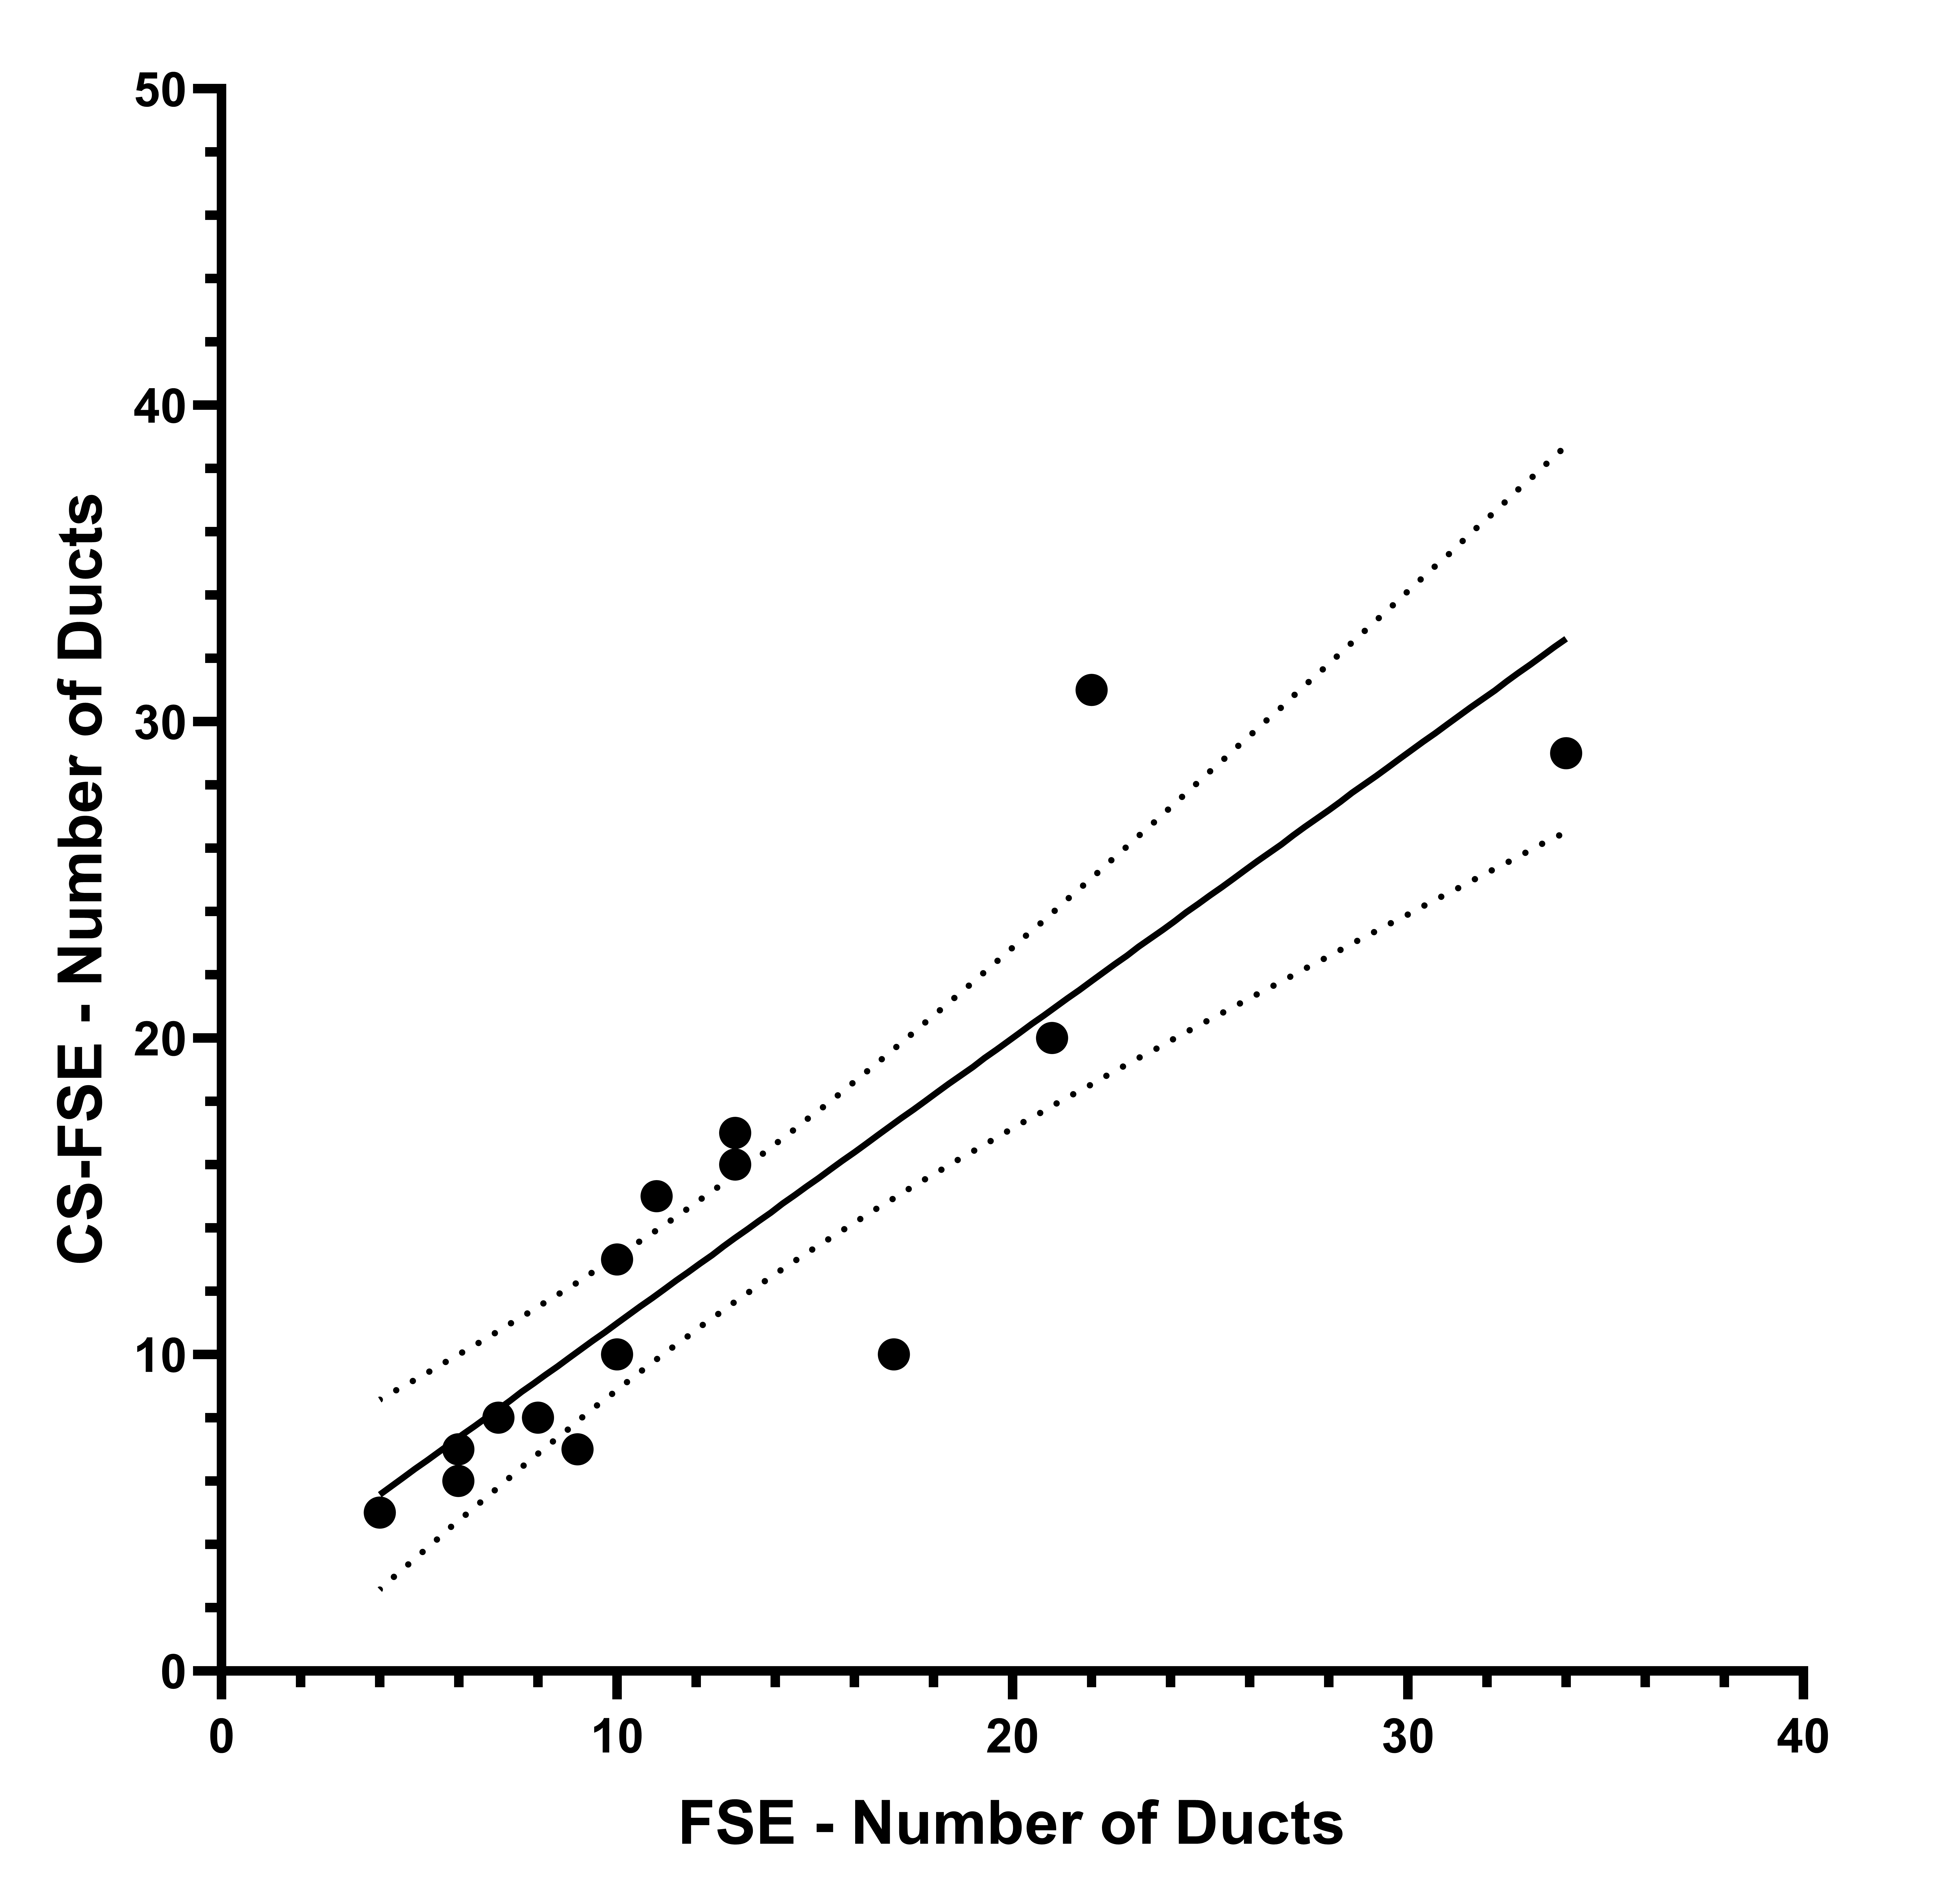
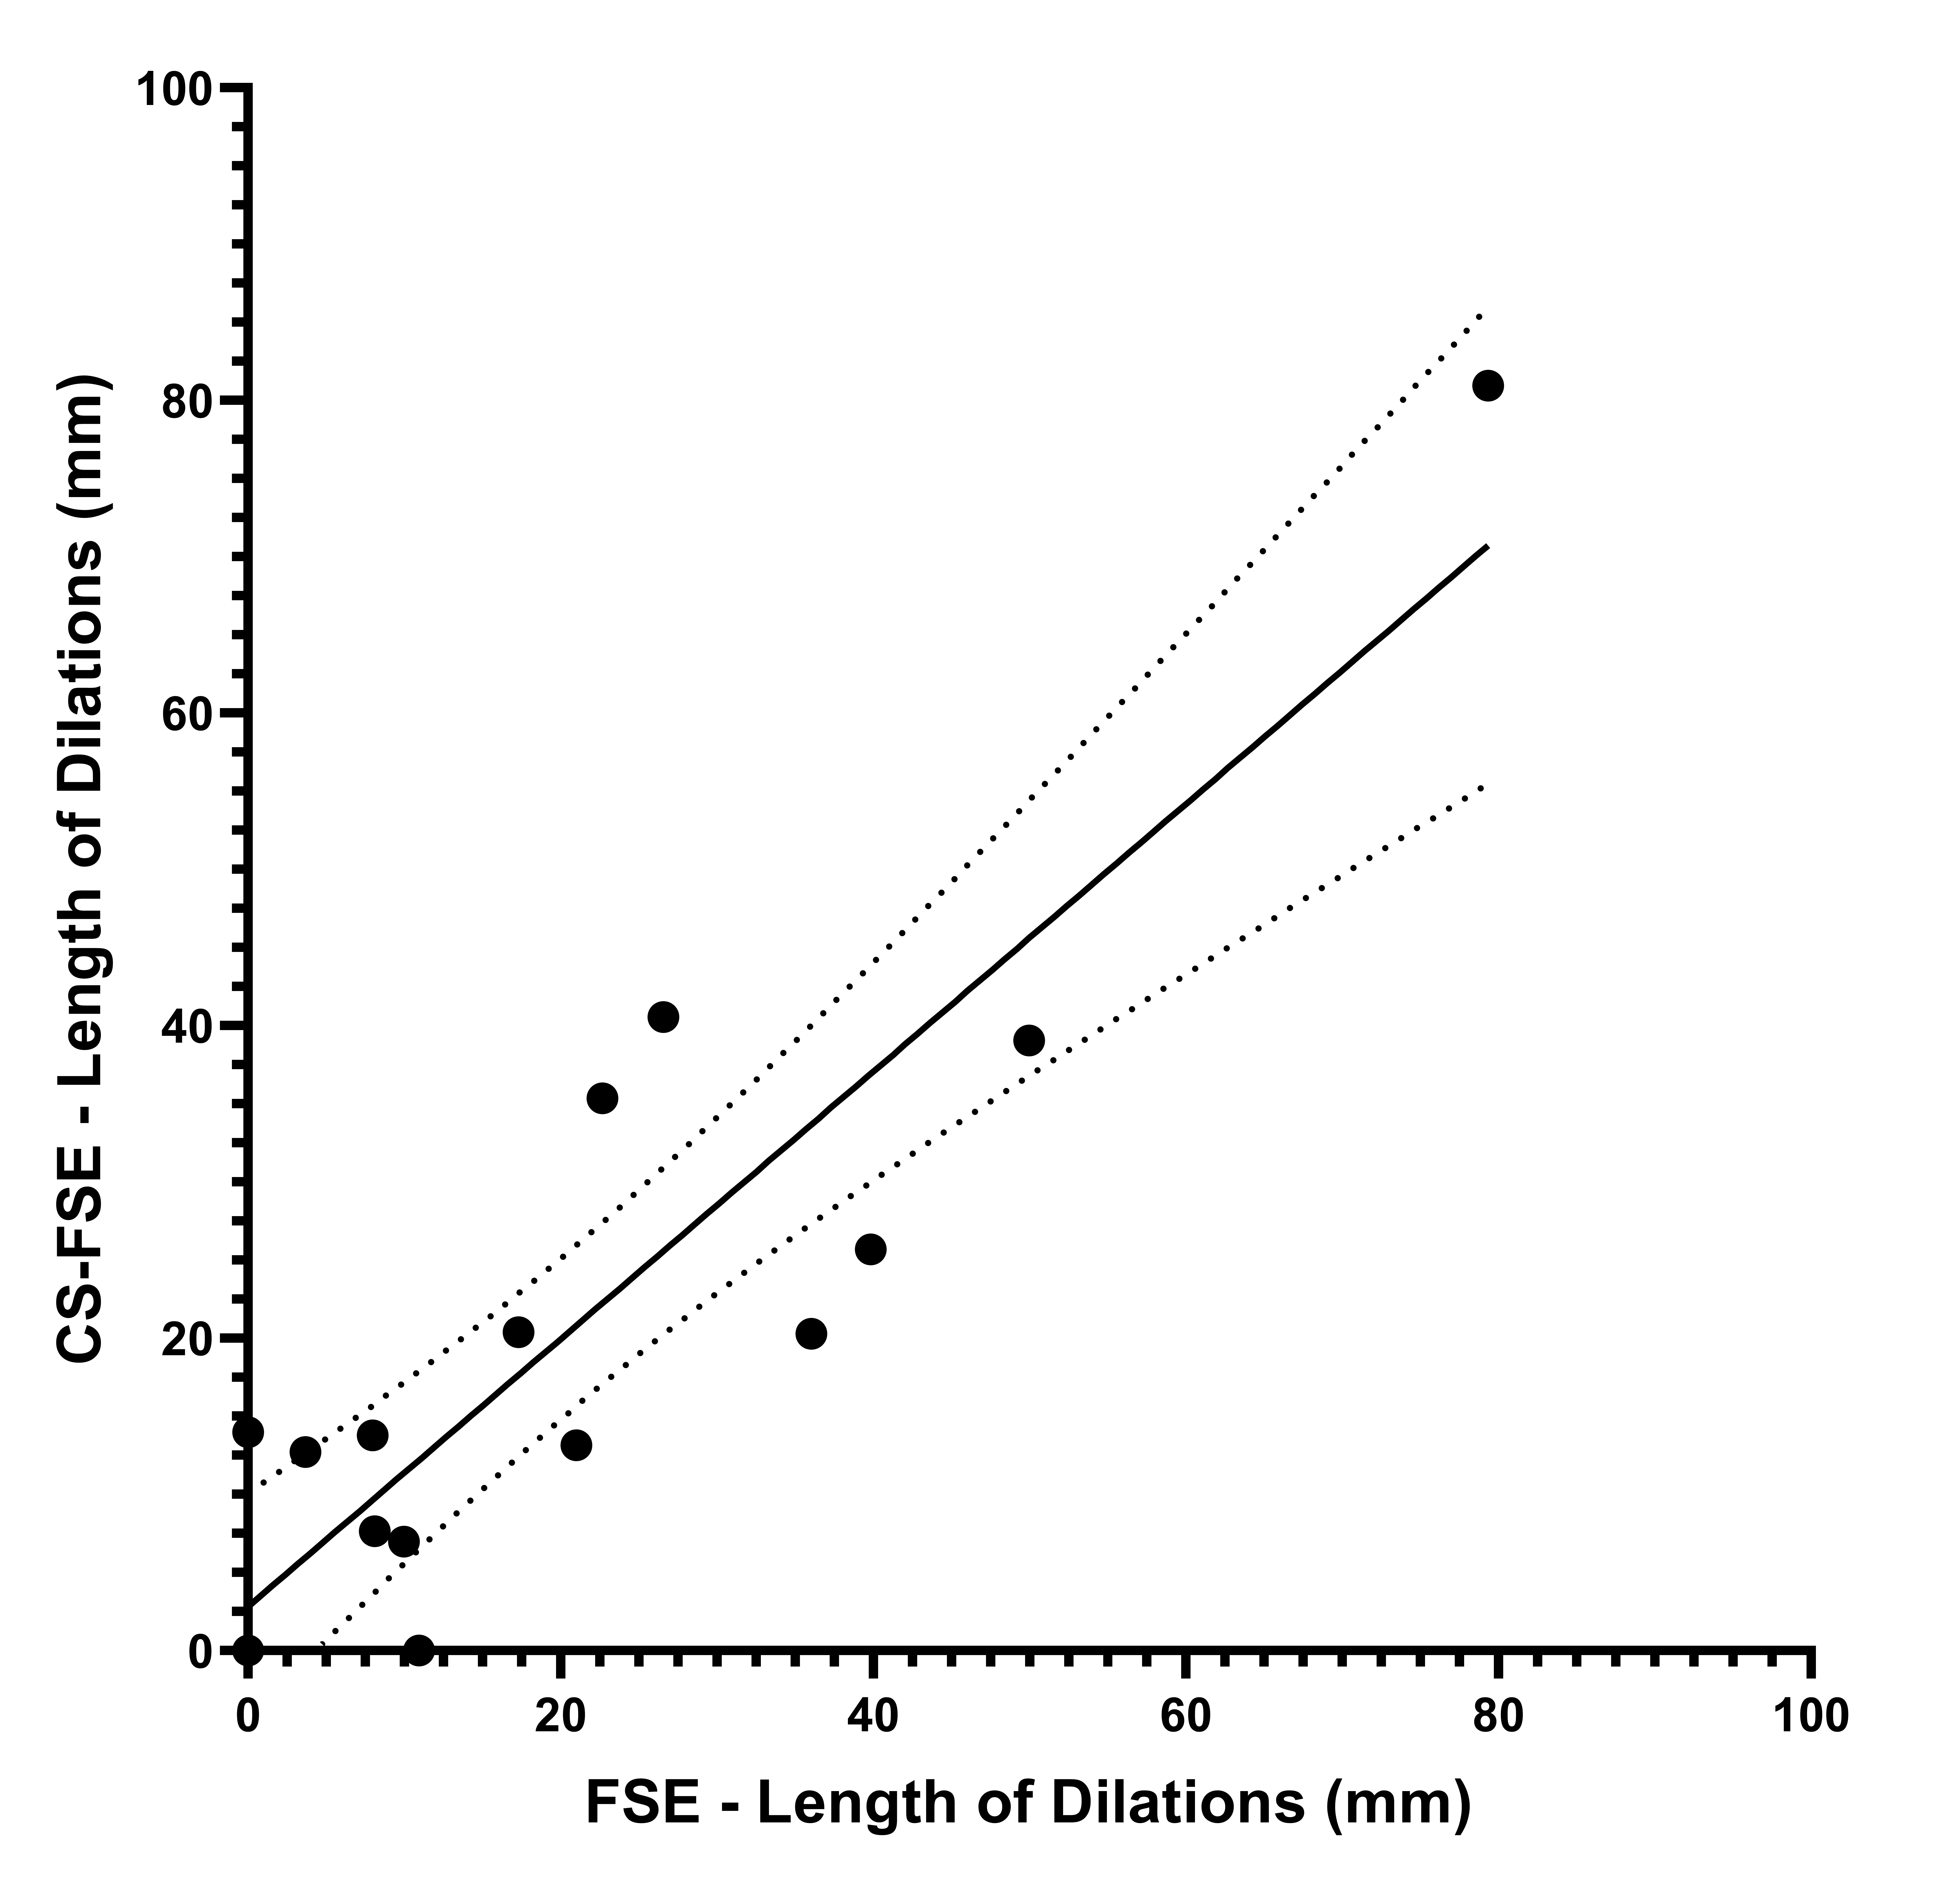
160 MRCP datasets (25 3D FSE, 67 3D CS-FSE, and 68 3D GRASE) were collected from 69 patients. Forty-eight of 160 MRCP examinations (7 (28%) 3D FSE, 14 3D CS-FSE (21%), and 27 (40%) 3D GRASE) failed post-processing due to motion artifact or poor biliary contrast. The remaining 112 MRCP datasets (18 3D FSE, 53 3D CS-FSE, and 41 3D GRASE) from 60 patients were included in the analysis. Mean (standard deviation) patient age was 15.4 (5.2) years; 29 patients were female. Quantitative MRCP metric means and standard deviations are presented in Figure 2. Measurements of absolute agreement (ICCs) between two pairs of acquisition methods (3D FSE vs. CS-FSE; 3D CS-FSE vs. 3D GRASE) are summarized in Figure 3. There was strong agreement in biliary tree volume, median right and left hepatic duct diameters, number of ducts, and total length of dilations between 3D FSE and CS-FSE MRCP (ICC=0.84-0.93). Strong agreement also was observed in biliary tree volume, median/maximum common bile duct diameters, and median/maximum right hepatic duct diameters between CS-FSE and GRASE MRCP (ICC=0.81-0.88). Scatter plots comparing number of ducts and total length of dilations measurements between 3D FSE and 3D CS-FSE are presented in Figures 4 and 5.Discussion
Intra-class correlation coefficients (ICC) demonstrated strong agreement in multiple quantitative biliary metrics, including biliary tree volume, median/maximum common bile duct diameters, and median/maximum right hepatic bile duct diameter between 3D CS-FSE and 3D GRASE MRCP. This is consistent with the work of He et al8, where common bile duct as well as left and right hepatic duct visualization was shown to be comparable between 3D CS-FSE and 3D GRASE. Although we did not see strong agreement in the left hepatic duct measurements, moderate agreement was still observed (ICC=0.63-0.65). We also have demonstrated strong agreement in biliary tree volume, number of ducts, and total length of dilations between 3D FSE and 3D CS-FSE MRCP. This suggests that global metrics produced from 3D FSE MRCP with CS are comparable to measurements from conventional 3D FSE MRCP. This is consistent with current literature, where the visibility and sharpness of the pancreatobiliary ducts using 3D CS-FSE has been shown to be comparable with conventional 3D FSE MRCP6, 11. Interestingly, unlike previously reported results where 3D CS-FSE did not perform comparably to standard MRCP regarding intrahepatic bile duct visibility, we have demonstrated strong agreement in median left and right hepatic duct diameters between 3D FSE and 3D CS-FSE (ICC=0.83 and 0.93, respectively). Our results suggest that 3D FSE MRCP with CS has the potential to achieve comparable bile duct visualization and quantitative assessments when compared to conventional 3D FSE MRCP.Conclusion
Our results suggest that that 3D FSE MRCP with CS achieves similar intrahepatic and global biliary visualization and measurements compared to conventional 3D FSE MRCP. Further investigations with larger cohorts, including adult patients, are needed to confirm these results and further validate the use of 3D CS-FSE for quantitative biliary evaluation.Acknowledgements
Perspectum Ltd. provided in-kind research support in the form of MRCP+ prototype image processing software through a formal research agreement.References
1. Barish MA, Yucel EK, Ferrucci JT. Magnetic resonance cholangiopancreatography. N Engl J Med. 1999;341(4):258-64.
2. Masui T, Katayama M, Kobayashi S, et al. Magnetic resonance cholangiopancreatography: comparison of respiratory-triggered three-dimensional fast-recovery fast spin-echo with parallel imaging technique and breath-hold half-Fourier two-dimensional single-shot fast spin-echo technique. Radiat Med. 2006;24(3):202-9.
3. Anupindi SA, Victoria T. Magnetic resonance cholangiopancreatography: techniques and applications. Magn Reson Imaging Clin N Am. 2008;16(3):453-66, v.
4. Chavhan GB, Almehdar A, Moineddin R, et al. Comparison of respiratory-triggered 3-D fast spin-echo and single-shot fast spin-echo radial slab MR cholangiopancreatography images in children. Pediatr Radiol. 2013;43(9):1086-92.
5. Nam JG, Lee JM, Kang HJ, et al. GRASE Revisited: breath-hold three-dimensional (3D) magnetic resonance cholangiopancreatography using a Gradient and Spin Echo (GRASE) technique at 3T. Eur Radiol. 2018;28(9):3721-8.
6. Yoon JH, Lee SM, Kang HJ, et al. Clinical Feasibility of 3-Dimensional Magnetic Resonance Cholangiopancreatography Using Compressed Sensing: Comparison of Image Quality and Diagnostic Performance. Invest Radiol. 2017;52(10):612-9.
7. Chandarana H, Doshi AM, Shanbhogue A, et al. Three-dimensional MR Cholangiopancreatography in a Breath Hold with Sparsity-based Reconstruction of Highly Undersampled Data. Radiology. 2016;280(2):585-94.
8. He M, Xu J, Sun Z, et al. Comparison and evaluation of the efficacy of compressed SENSE (CS) and gradient- and spin-echo (GRASE) in breath-hold (BH) magnetic resonance cholangiopancreatography (MRCP). J Magn Reson Imaging. 2020;51(3):824-32.
9. Yoshikawa T, Mitchell DG, Hirota S, et al. Focal liver lesions: breathhold gradient- and spin-echo T2-weighted imaging for detection and characterization. J Magn Reson Imaging. 2006;23(4):520-8.
10. Ralli GP, Ridway GR, Brady M. Segmentation of the biliary tree from MRCP images via the monogenic signal. In: Papież B., Namburete A., Yaqub M., Noble J. (eds) Medical Image Understanding and Analysis. MIUA 2020. Communications in Computer and Information Science. Springer, Cham. p 105-117.
11. Taron J, Weiss J, Notohamiprodjo M, et al. Acceleration of Magnetic Resonance Cholangiopancreatography Using Compressed Sensing at 1.5 and 3 T: A Clinical Feasibility Study. Invest Radiol. 2018;53(11):681-8.
Figures