0478
Free Breathing 2D Abdominal Magnetic Resonance Fingerprinting with quadratic RF phase1Biomedical Engineering, Case Western Reserve University, Cleveland, OH, United States, 2Radiology, Case Western Reserve University, Cleveland, OH, United States, 3Physics, Case Western Reserve University, Cleveland, OH, United States, 4University Hospitals Cleveland Medical Center, Cleveland, OH, United States
Synopsis
This study presents a Pilot Tone (PT) based free-breathing technique for two-dimensional simultaneous quantification of T1, T2, T2*, fat fraction (FF), water fraction (WF), and off-resonance. This technique integrates quadratic RF phase-based Magnetic Resonance Fingerprinting (qRF-MRF) and PT navigator to retrospectively provide simultaneous quantification of multiple tissue properties in the abdomen at end-inhalation and end-expiration states.
Introduction:
Quantitative mapping in the abdomen can create opportunities for in vivo assessment of diseased and healthy tissue such as lesion detection (1), cirrhotic liver tissue differentiation (2), and assessment of kidney injury and functions (3–5). However, quantitative T1 and T2 mapping of the abdomen can be immensely challenging because of respiratory motion. While this commonly mitigated by breath-hold acquisitions, traditional quantitative methods require multiple acquisitions, which results in images that are not co-registered, thereby introducing additional variability from subject motion in between acquisitions. Clinically, a free breathing acquisition in the abdomen is significant, since it would allow robust quantification of parenchymal changes during functional tests in a clinical setting. In this study, we integrate the completely self-navigated pilot tone (PT) navigator (6–8) with two-dimensional quadratic RF phase-based Magnetic Resonance Fingerprinting (qRF-MRF) (9,10). qRF-MRF quantifies T2* in addition to T1, T2, and off-resonance. Abdominal T2* mapping would allow disease characterization such as iron deposits, microbleeds, and liver fibrosis (11,12). Furthermore, by integrating partial volume (PV) dictionaries(13), the same framework can generate fat fraction (FF) and water fraction (WF) maps. Thus, this method integrates multiple important abdominal quantitative mapping techniques all in one free-breathing acquisition.Methods
PT:The PT navigator was implemented as described in (14). This study was performed on the 3.0-T Siemens Vida scanner (Siemens Healthineers) and the PT frequency was adjusted accordingly to at the edge of the imaging FOV. The function generator was synchronized to the 10 MHz clock of the scanner. PT signals were encoded in the raw data through receiver arrays (TIM body 18, spinal arrays, Siemens Healthineers, Erlangen, Germany). Principal component analysis (PCA) was applied to PT signals extracted from all coils. The navigator signal was chosen from the principal component that showed the most relative power in the frequency band of the respiratory motion, roughly 0.14-0.9 Hz. The temporal resolution of the pilot tone signal is determined by sequence repetition time (8.1 ms).
Acquisition:
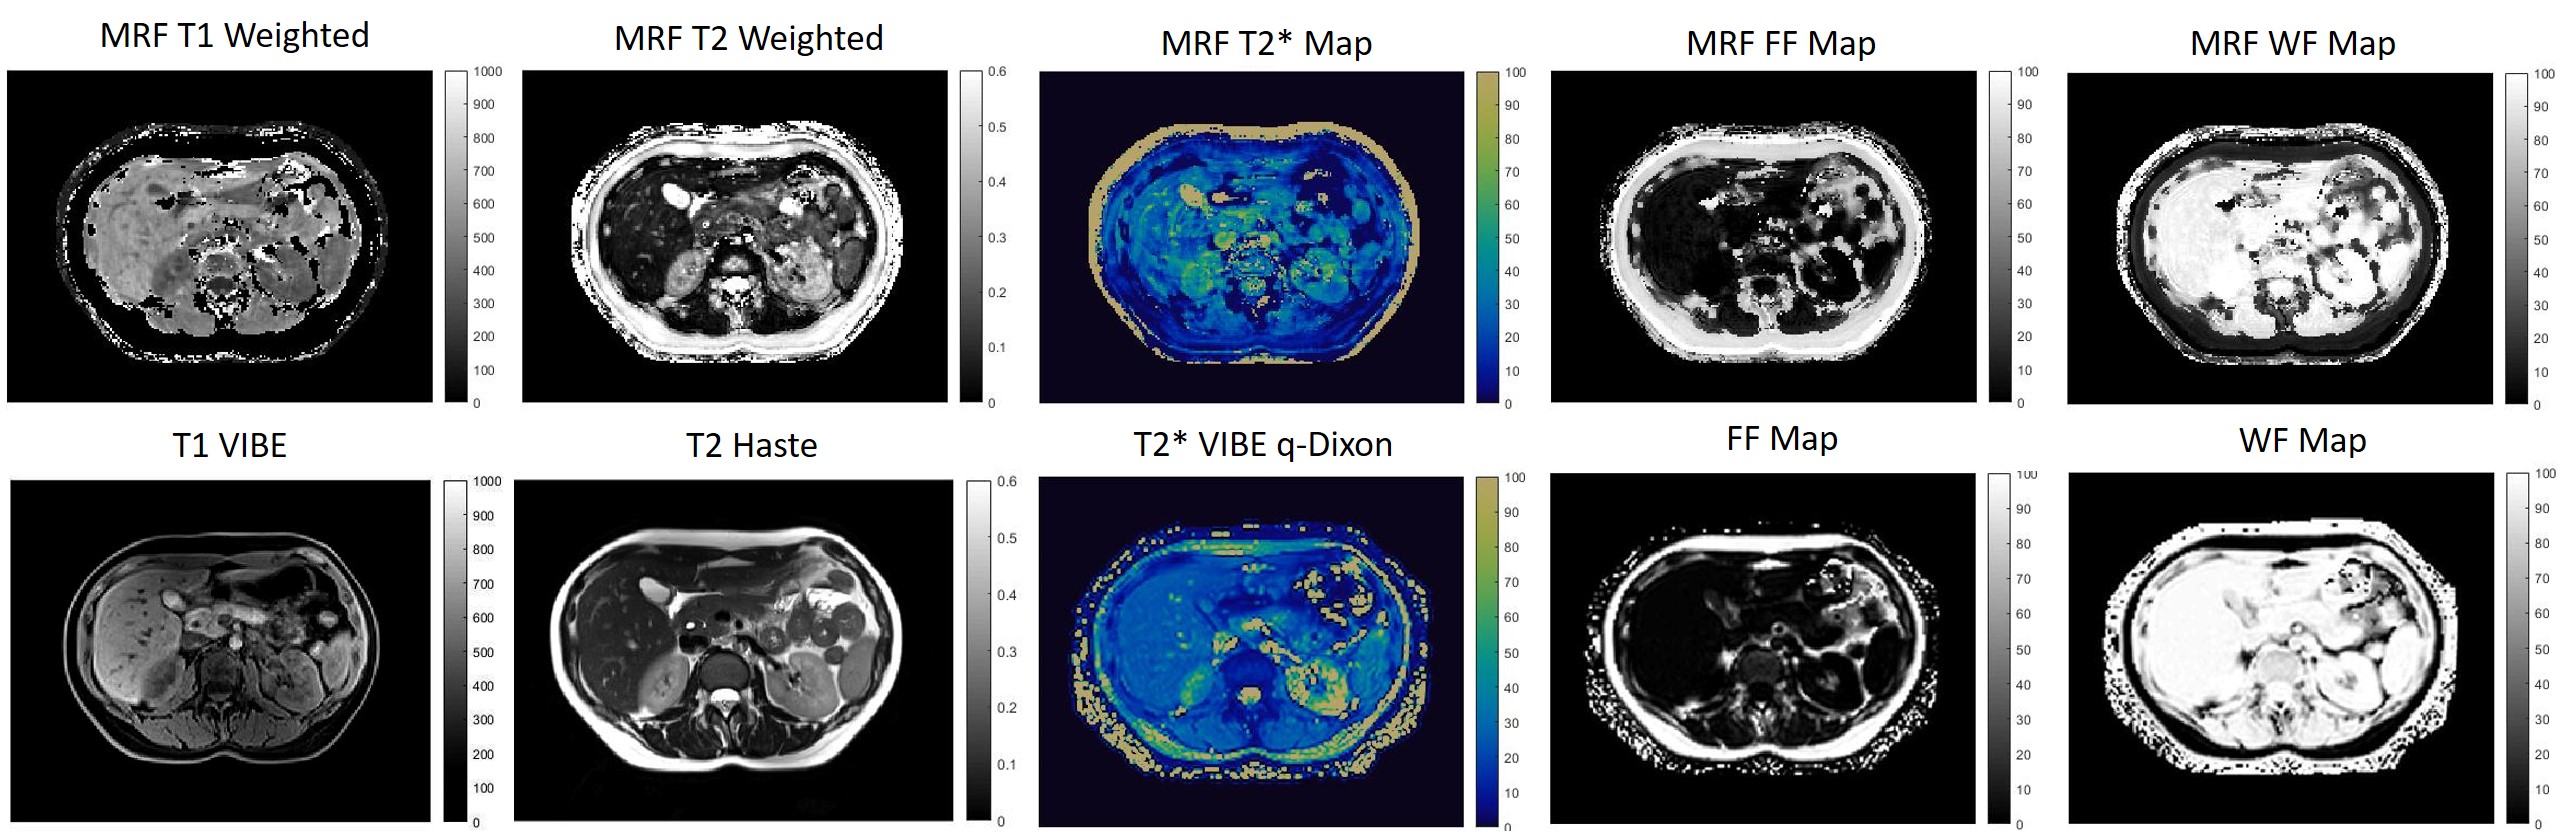
qRF-MRF has been previously implemented in 2D (9) and 3D (10). qRF-MRF is a balanced SSFP based MRF acquisition where the RF phase is varied with a quadratic function resulting in linear sweep and encoding of the on-resonance frequency. T2* is mapped via T2’ which is directly associated with frequency dispersion around a center frequency for each voxel. Here, we improved the most recent implementation (10) to enable mapping in a breath hold-feasible scan time: 1172 time points, TR=8.1 msec, total scan time=9.5 s, FOV, 400 x 400 mm2; matrix size, 256 x 256; slice thickness, 5 mm. The same slice position was acquired using clinical sequences for T1 weighted image (T1 VIBE), T2 weighted image (T2 HASTE), T2* map, fat fraction (FF) map, and water fraction (WF) map (VIBE q Dixon) for comparison.
This implementation of PT qRF-MRF used purely retrospective gating. Nine measurements of an axial slice were acquired to ensure sufficient respiratory data has been gathered, with a total of 10548 time-points. In between each measurement, a wait time of 2 seconds was applied to ensure the transverse magnetization was sufficiently relaxed. The total acquisition time was 1.5 minutes. To evaluate the performance of PT free-breathing acquisition, breath-hold scans with a similar slice position is obtained.
Reconstruction:
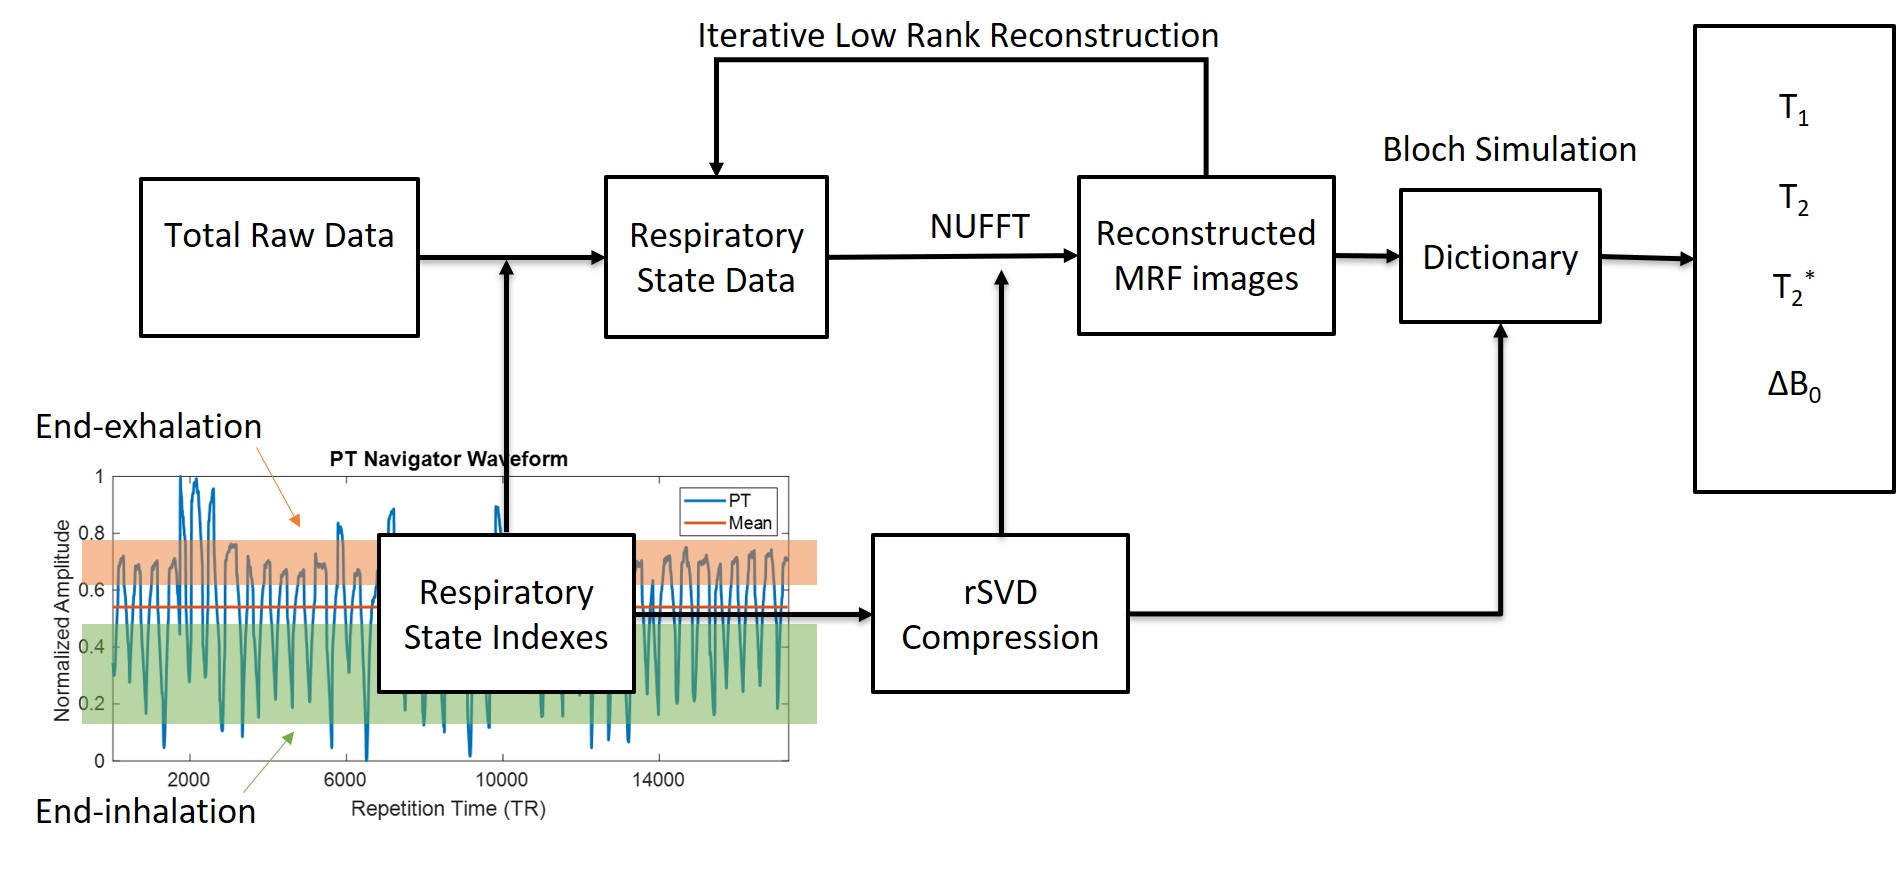
The reconstruction pipeline is shown in figure 1. The qRF-MRF dictionary was generated using the Bloch simulation with combinations of signal evolution with T1 in a range of 10 – 5000ms, T2 and T2* in a range of 2 – 2000ms, and off-resonance in a range of -682 Hz to 682 Hz. The dictionary was compressed using rSVD (15) to reduce memory requirement. Quadratic interpolation was used to improve the resolution of the dictionary (16). To improve image quality in reconstruction, iterative low-rank reconstruction was implemented for both breath-hold and PT reconstructions (17).
The respiratory state indexes were selected based on a window of accepted data points defined by respiratory state thresholds. In this study, we extracted the end-inhalation and end-exhalation states by binning all the time points within the threshold together. Approximately 3000 time-points in each respiratory state were selected. The spiral sampling distribution was compensated based on the occurrence of each spiral arm. A pattern matching algorithm was performed on the subset image series with the corresponding compressed dictionary and trajectory (18). A partial volume MRF dictionary (13) was generated to create the FF and WF maps.
Results
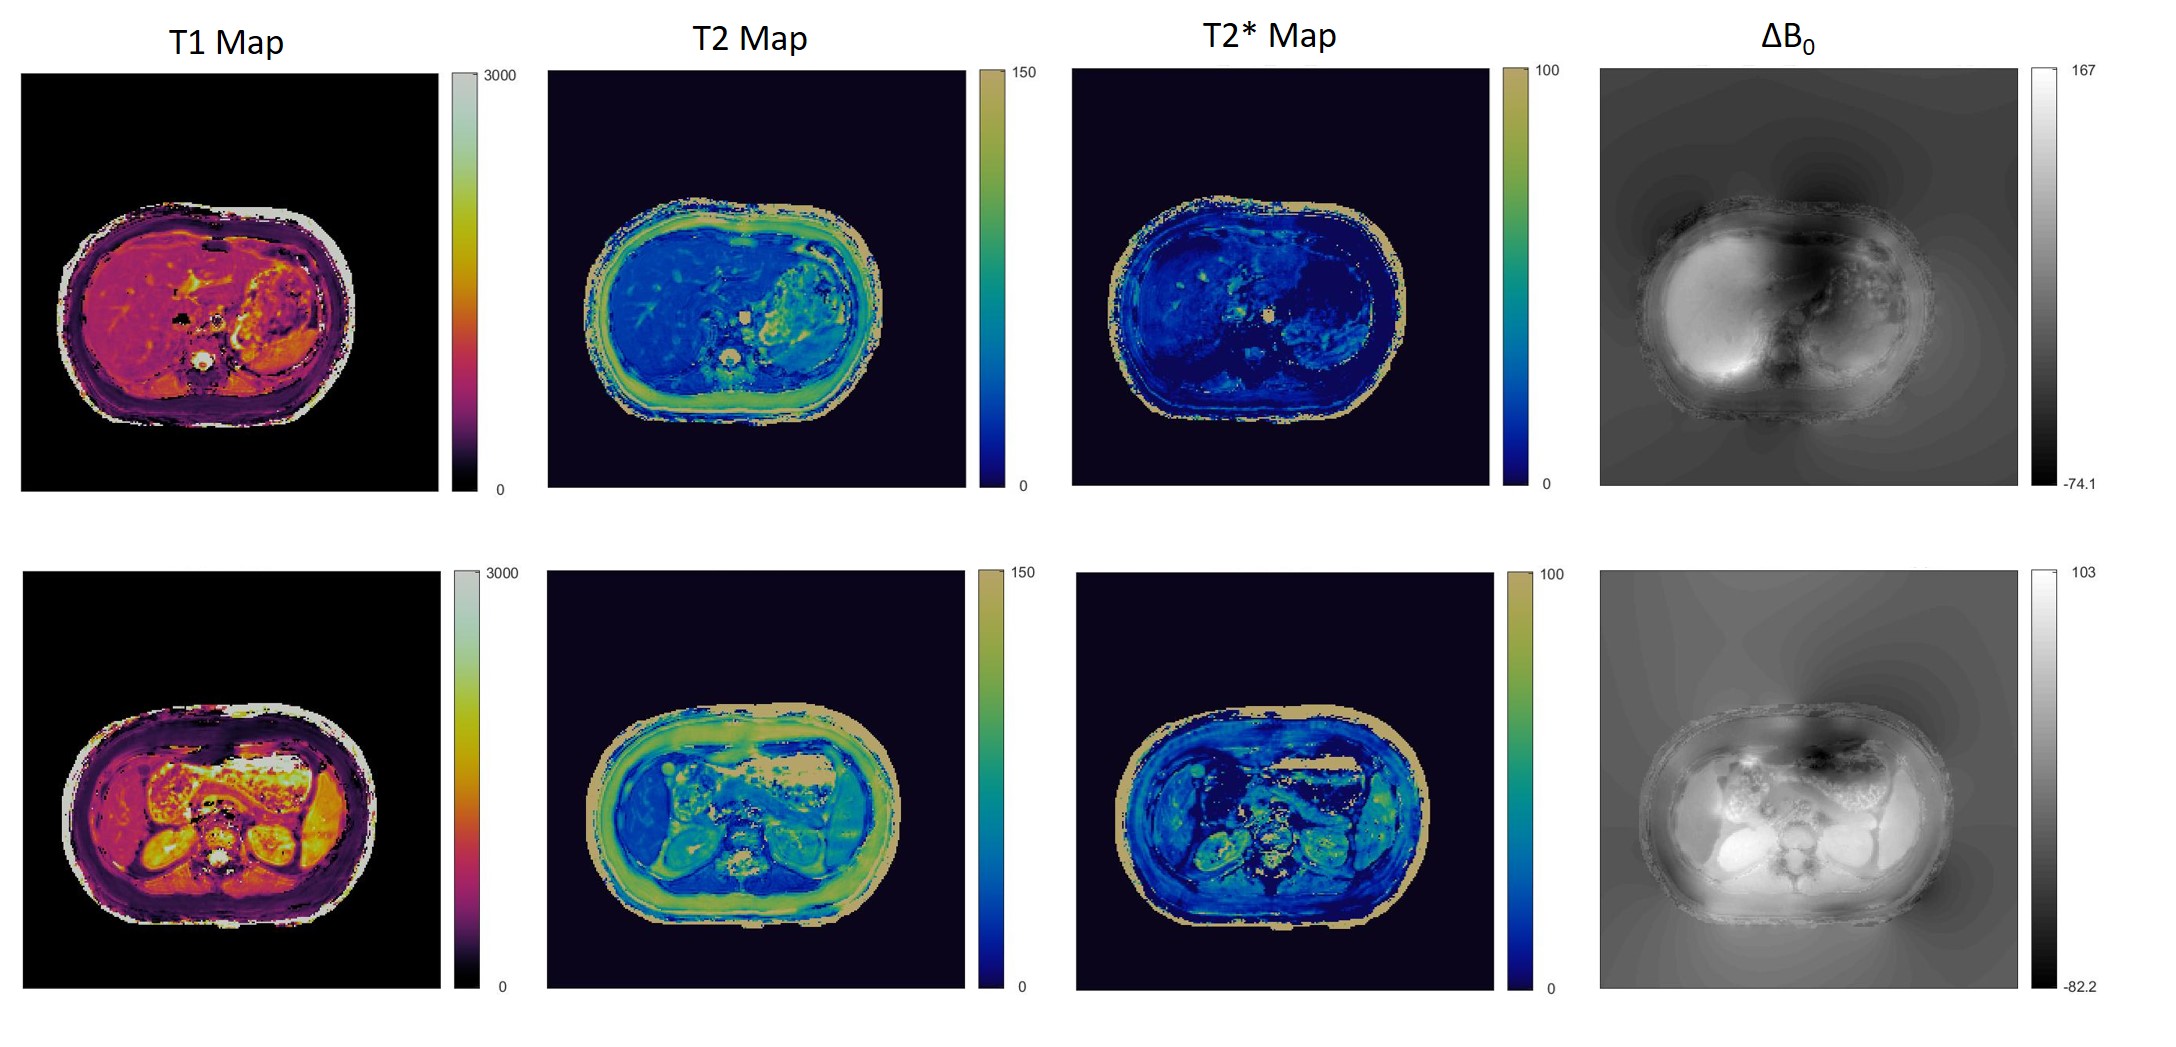
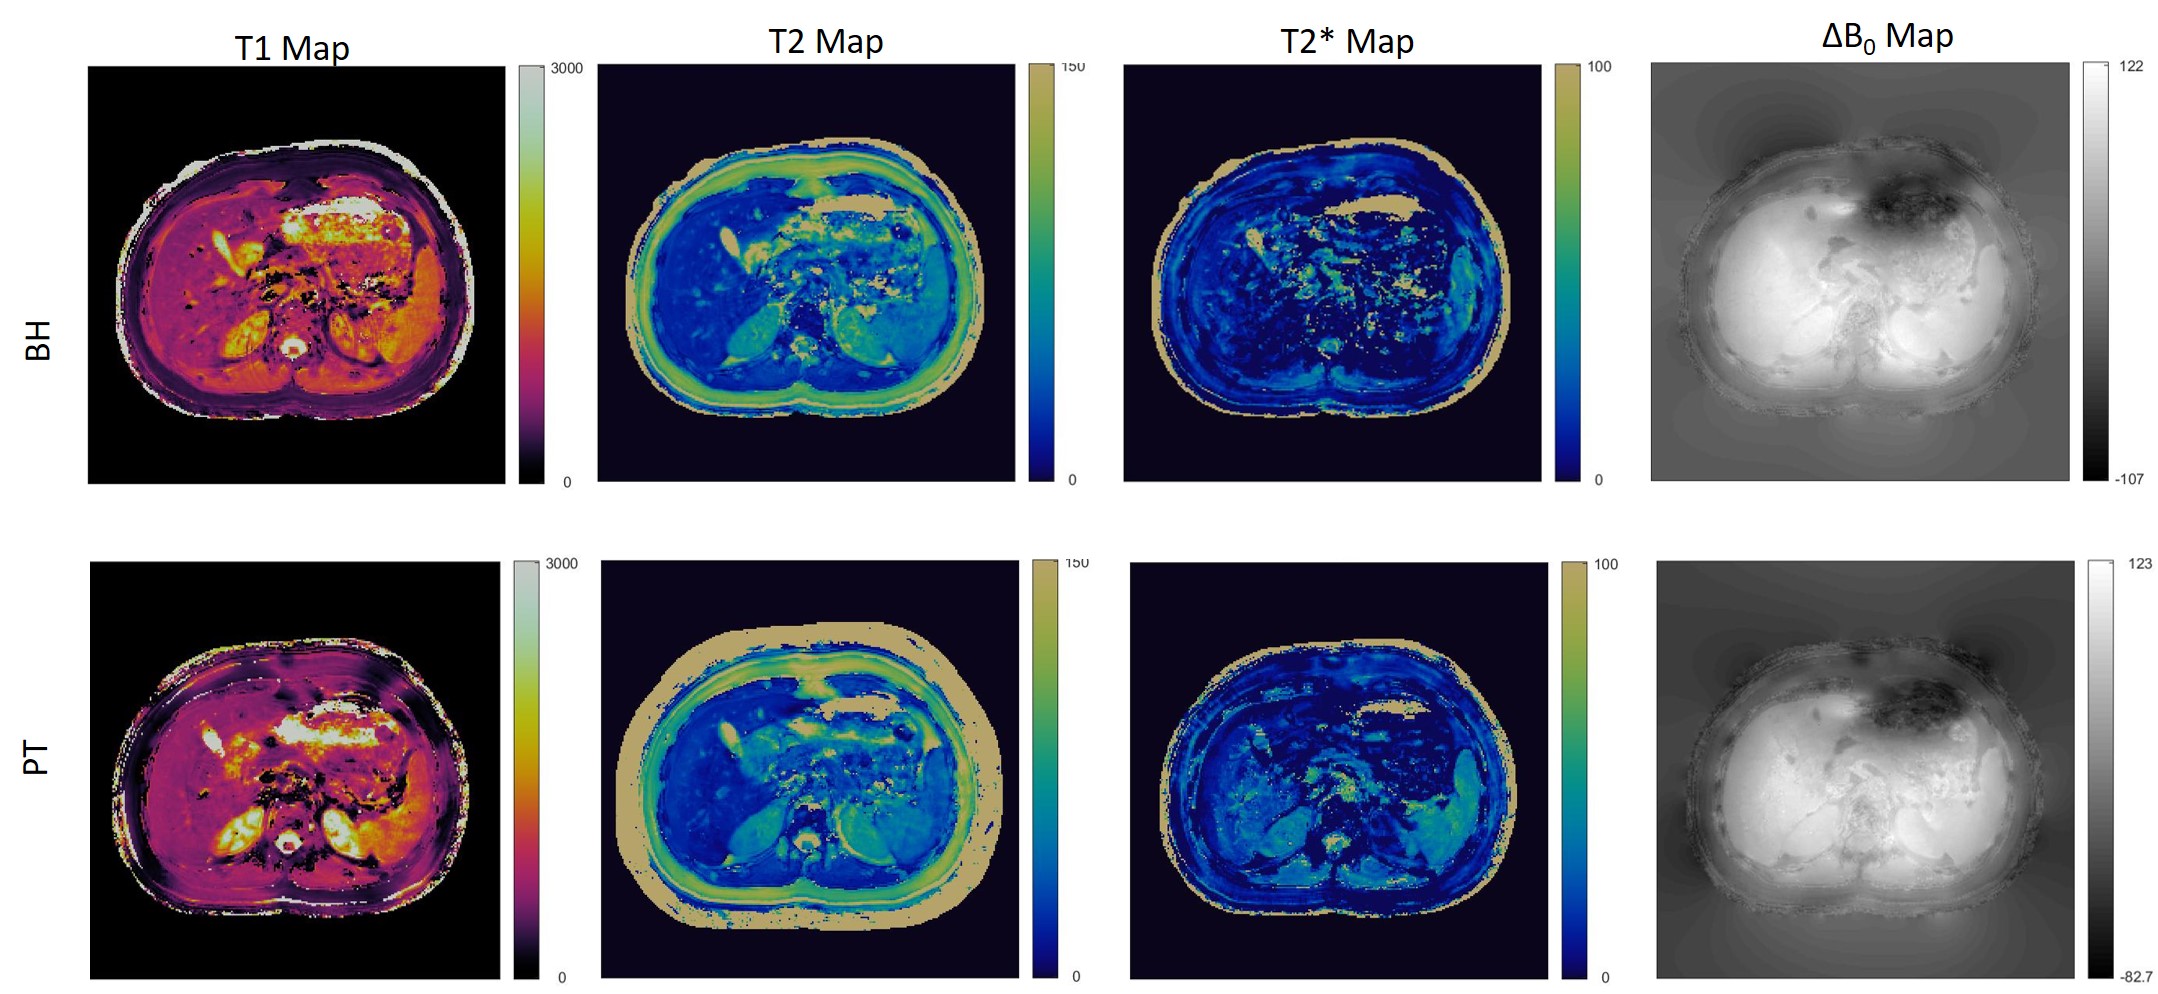
Figure 2 shows the breath-hold T1, T2, T2*, and off resonance MRF maps in two abdominal positions. The qRF -MRF implementation can generate quantitative maps in a 10s breath-hold acquisition. In figure 3, MRF generated maps and synthetic images are compared to their corresponding clinical scan outputs. Figure 4 shows the PT qRF-MRF generated maps in comparison to breath-hold qRF-MRF maps with a comparable slice position.Discussion and conclusion
This proof-of-concept study shows the feasibility of PT Navigator based 2D- qRF-MRF technique for quantitative free-breathing abdominal imaging. The 2D acquisition can simultaneously generate co-registered T1, T2, T2*, off resonance, FF and WF. The retrospectively gated free-breathing maps are similar to the breath-hold scans. This method could open up the door of multi-property mapping to characterize disease throughout the abdomen using a completely free-breathing acquisitionAcknowledgements
This material is supported by Siemens Healthcare and the National Science Foundation Graduate Research Fellowship Grant No. CON501692. This work is also supported by the Interdisciplinary Biomedical Imaging Training Program, NIH T32EB007509 administered by the Department of Biomedical Engineering, Case Western Reserve University. This report is solely the responsibility of the authors and does not necessarily represent the official views of the NIH.References
1. Deng J, Larson AC. Modified PROPELLER approach for T2-mapping of the abdomen. Magn. Reson. Med. 2009;61:1269–1278 doi: 10.1002/mrm.21989.
2. Kim KA, Park M-S, Kim I-S, et al. Quantitative evaluation of liver cirrhosis using T1 relaxation time with 3 tesla MRI before and after oxygen inhalation. J. Magn. Reson. Imaging 2012;36:405–410 doi: 10.1002/jmri.23620.
3. Hueper K, Peperhove M, Rong S, et al. T1-mapping for assessment of ischemia-induced acute kidney injury and prediction of chronic kidney disease in mice. Eur. Radiol. 2014;24:2252–2260 doi: 10.1007/s00330-014-3250-6.
4. Peperhove M, Vo Chieu VD, Jang M-S, et al. Assessment of acute kidney injury with T1 mapping MRI following solid organ transplantation. Eur. Radiol. 2018;28:44–50 doi: 10.1007/s00330-017-4943-4.
5. Wolf M, de Boer A, Sharma K, et al. Magnetic resonance imaging T1- and T2-mapping to assess renal structure and function: a systematic review and statement paper. Nephrol. Dial. Transplant. Off. Publ. Eur. Dial. Transpl. Assoc. - Eur. Ren. Assoc. 2018;33:ii41–ii50 doi: 10.1093/ndt/gfy198.
6. Ludwig J, Speier P, Seifert F, Schaeffter T, Kolbitsch C. Pilot tone-based prospective respiratory motion correction for 2D cine cardiac MRI. In: Pilot tone-based prospective respiratory motion correction for 2D cine cardiac MRI. Vol. 27. Montreal: International Society For Magnetic Resonance in Medicine; 2019. p. 73. doi: 10.1007/s10334-015-0487-2.
7. Schroeder L, Wetzl J, Maier A, Rehner R, Fenchel M, Speier P. Two-Dimensional Respiratory-Motion Characterization for Continuous MR Measurements Using Pilot Tone Navigation. In: Vol. 24. Singapore: International Society For Magnetic Resonance in Medicine; 2016. p. 310.
8. Speier P, Fenchel M, Rehner R. PT-Nav: A Novel Respiratory Navigation Method for Continuous Acquisition Based on Modulation of a Pilot Tone in the MR-Receiver. Magn. Reson. Mater. Phys. Biol. Med. 2015;28:97–98 doi: 10.1007/s10334-015-0487-2.
9. Wang CY, Coppo S, Mehta BB, Seiberlich N, Yu X, Griswold MA. Magnetic resonance fingerprinting with quadratic RF phase for measurement of T2* simultaneously with δf, T1, and T2. Magn. Reson. Med. 2019;81:1849–1862 doi: https://doi.org/10.1002/mrm.27543.
10. Boyacioglu R, Wang C, Ma D, McGivney DF, Yu X, Griswold MA. 3D magnetic resonance fingerprinting with quadratic RF phase. Magn. Reson. Med. 2020 doi: 10.1002/mrm.28581.
11. Henninger B, Benjamin H, Kremser C, et al. Evaluation of liver fat in the presence of iron with MRI using T2* correction: a clinical approach. Eur. Radiol. 2013;23:1643–1649 doi: 10.1007/s00330-012-2745-2.
12. Hector S, Jafari R, Koehne de Gonzalez A, et al. Integrated QSM and R2* for Evaluation of Liver Fibrosis -An Ex Vivo Feasibility Study. In: Virtual.
13. Deshmane A, McGivney DF, Ma D, et al. Partial volume mapping using magnetic resonance fingerprinting. NMR Biomed. 2019;32:e4082 doi: https://doi.org/10.1002/nbm.4082.
14. Huang S, Boyacioğlu R, Bolding R, Chen Y, Griswold MA. Free-Breathing Abdominal Magnetic Resonance Fingerprinting Using a Pilot Tone Navigator. In: Proc. Intl. Soc. Mag. Reson. Med. Virtual.
15. Yang M, Ma D, Jiang Y, et al. Low rank approximation methods for MR fingerprinting with large scale dictionaries. Magn. Reson. Med. 2018;79:2392–2400 doi: https://doi.org/10.1002/mrm.26867.
16. McGivney D, Boyacioglu R, Jiang Y, Wang C, Ma D, Griswold M. Towards Continuous Dictionary Resolution in MR Fingerprinting using a Quadratic Inner Product Model. In: 25th Annual Meeting of ISMRM. Vol. 27. Montréal, QC, Canada; 2019. p. 4526.
17. Hamilton JI, Jiang Y, Ma D, et al. Simultaneous multislice cardiac magnetic resonance fingerprinting using low rank reconstruction. NMR Biomed. 2019;32:e4041 doi: https://doi.org/10.1002/nbm.4041.
18. Ma D, Gulani V, Seiberlich N, et al. Magnetic Resonance Fingerprinting. Nature 2013;495:187–192 doi: 10.1038/nature11971.
Figures