0476
Quantification of arterial obstruction in pediatric patients with pulmonary embolism using arterial spin labeled perfusion MRI of the lungs1Pediatrics, UT Southwestern Medical Center, Dallas, TX, United States, 2Radiology, UT Southwestern Medical Center, Dallas, TX, United States, 3Advanced Imaging Research Center, UT Southwestern Medical Center, Dallas, TX, United States
Synopsis
In this study, pulmonary perfusion imaging using arterial spin labeling (ASL) was demonstrated in pediatric patients with pulmonary embolism. A method to quantify pulmonary vascular obstruction was proposed using ASL to estimate improvements in pulmonary perfusion following treatment, which moderately agreed with obstruction measured by CTA. Perfusion defects were successfully detected in all patients. A follow-up ASL scan also showed significantly improved perfusion in a patient following treatment, and a few patients had residual perfusion defects in ASL images that were not seen by CTA, suggesting that perfusion to the microvasculature was not immediately restored following resolution of the emboli.
Introduction
Pediatric venous thromboembolism (VTE), clinically presenting as deep venous thrombosis (DVT) and pulmonary embolism (PE), has dramatically increased in the past decade and now affects 1 in 200 hospitalized children (1). PE has explicitly experienced a more rapid rise in incidence, nearly 200%, disproportionately affecting adolescents (2). Pulmonary perfusion defects measured by SPECT may persist in up to 50% of PE patients 6 months after treatment (3). The clinical significance of residual perfusion defects is unclear, though unpredictable rates of thrombus resolution make it challenging to differentiate between recurrent PE and residual defects (4). Exposure to ionizing radiation by CT or SPECT also makes it challenging to monitor residual perfusion defects over time in pediatrics (5, 6). The purpose of this study was to demonstrate pulmonary perfusion imaging using arterial spin labeled (ASL) MRI in pediatric patients with PE to evaluate the extent of PE burden, and to develop a measure of pulmonary vascular obstruction (PVO) to evaluate patient’s response to treatment or changes in embolic burden over time without exposure to ionizing radiation.Methods
Six pediatric patients (16 ± 1.3 years, 2 male) with history of PE underwent ASL perfusion scans during cardiac MRI assessment of right heart function on a 1.5T scanner (Ingenia, Philips Healthcare, The Netherlands). Each patient had a CT angiography (CTA) scan performed for the clinical evaluation of PE, which were retrospectively reviewed and used to quantify PVO for comparison with ASL. One patient also had follow-up CTA and ASL scans 6 months following tPA treatment to evaluate improvements in perfusion.ASL-MRI
Sagittal ASL images were acquired in each patient using multi-slice FAIR (MS-FAIR) (7, 8), with 5-8 slices across each lung with 15mm slice thickness, post-labeling delay of 1 R-R interval (9), ECG-triggered SShTSE acquisition at diastole, 3 averages, and scan time = 2.5 minutes per lung. Images were acquired during free-breathing with four non-selective FOCI inversion pulses for background suppression to reduce respiratory motion artifacts (7, 8). A separate M0 image was acquired for perfusion quantification (10, 11). Pooled blood in the major pulmonary vasculature was masked before measuring perfusion from each lobe of the lungs (10).
Quantification of pulmonary vascular obstruction
PVO was quantified using the obstruction index proposed by Qanadli et al. for CTA (12). Briefly, the pulmonary arteries in each lung are divided into ten branches, and occlusion of each segment is scored from 0-2 for no, partial, or complete obstruction. Percent PVO was reported as the sum of the occlusion scores in each lobe out of the maximum possible score for that lobe.
An ASL-based PVO score was developed to compare the severity and location of perfusion defects measured by ASL and CTA. This was calculated as the percent reduction in perfusion from the minimum perfusion value expected in healthy patients of 400 mL/100g/min (9). This is similar to an approach used for SPECT (13), but makes use of the quantified ASL perfusion values, allowing for meaningful comparison of PVO scores over time.
Results
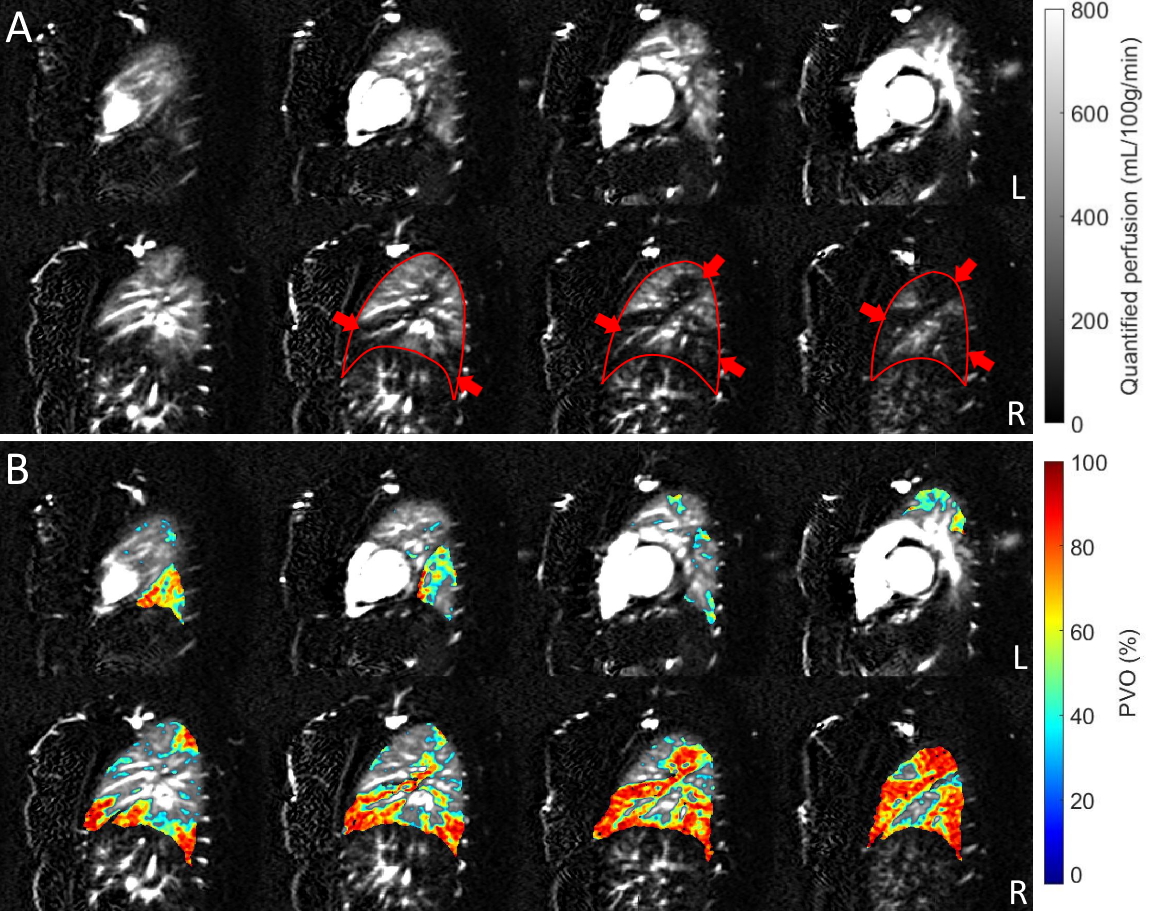
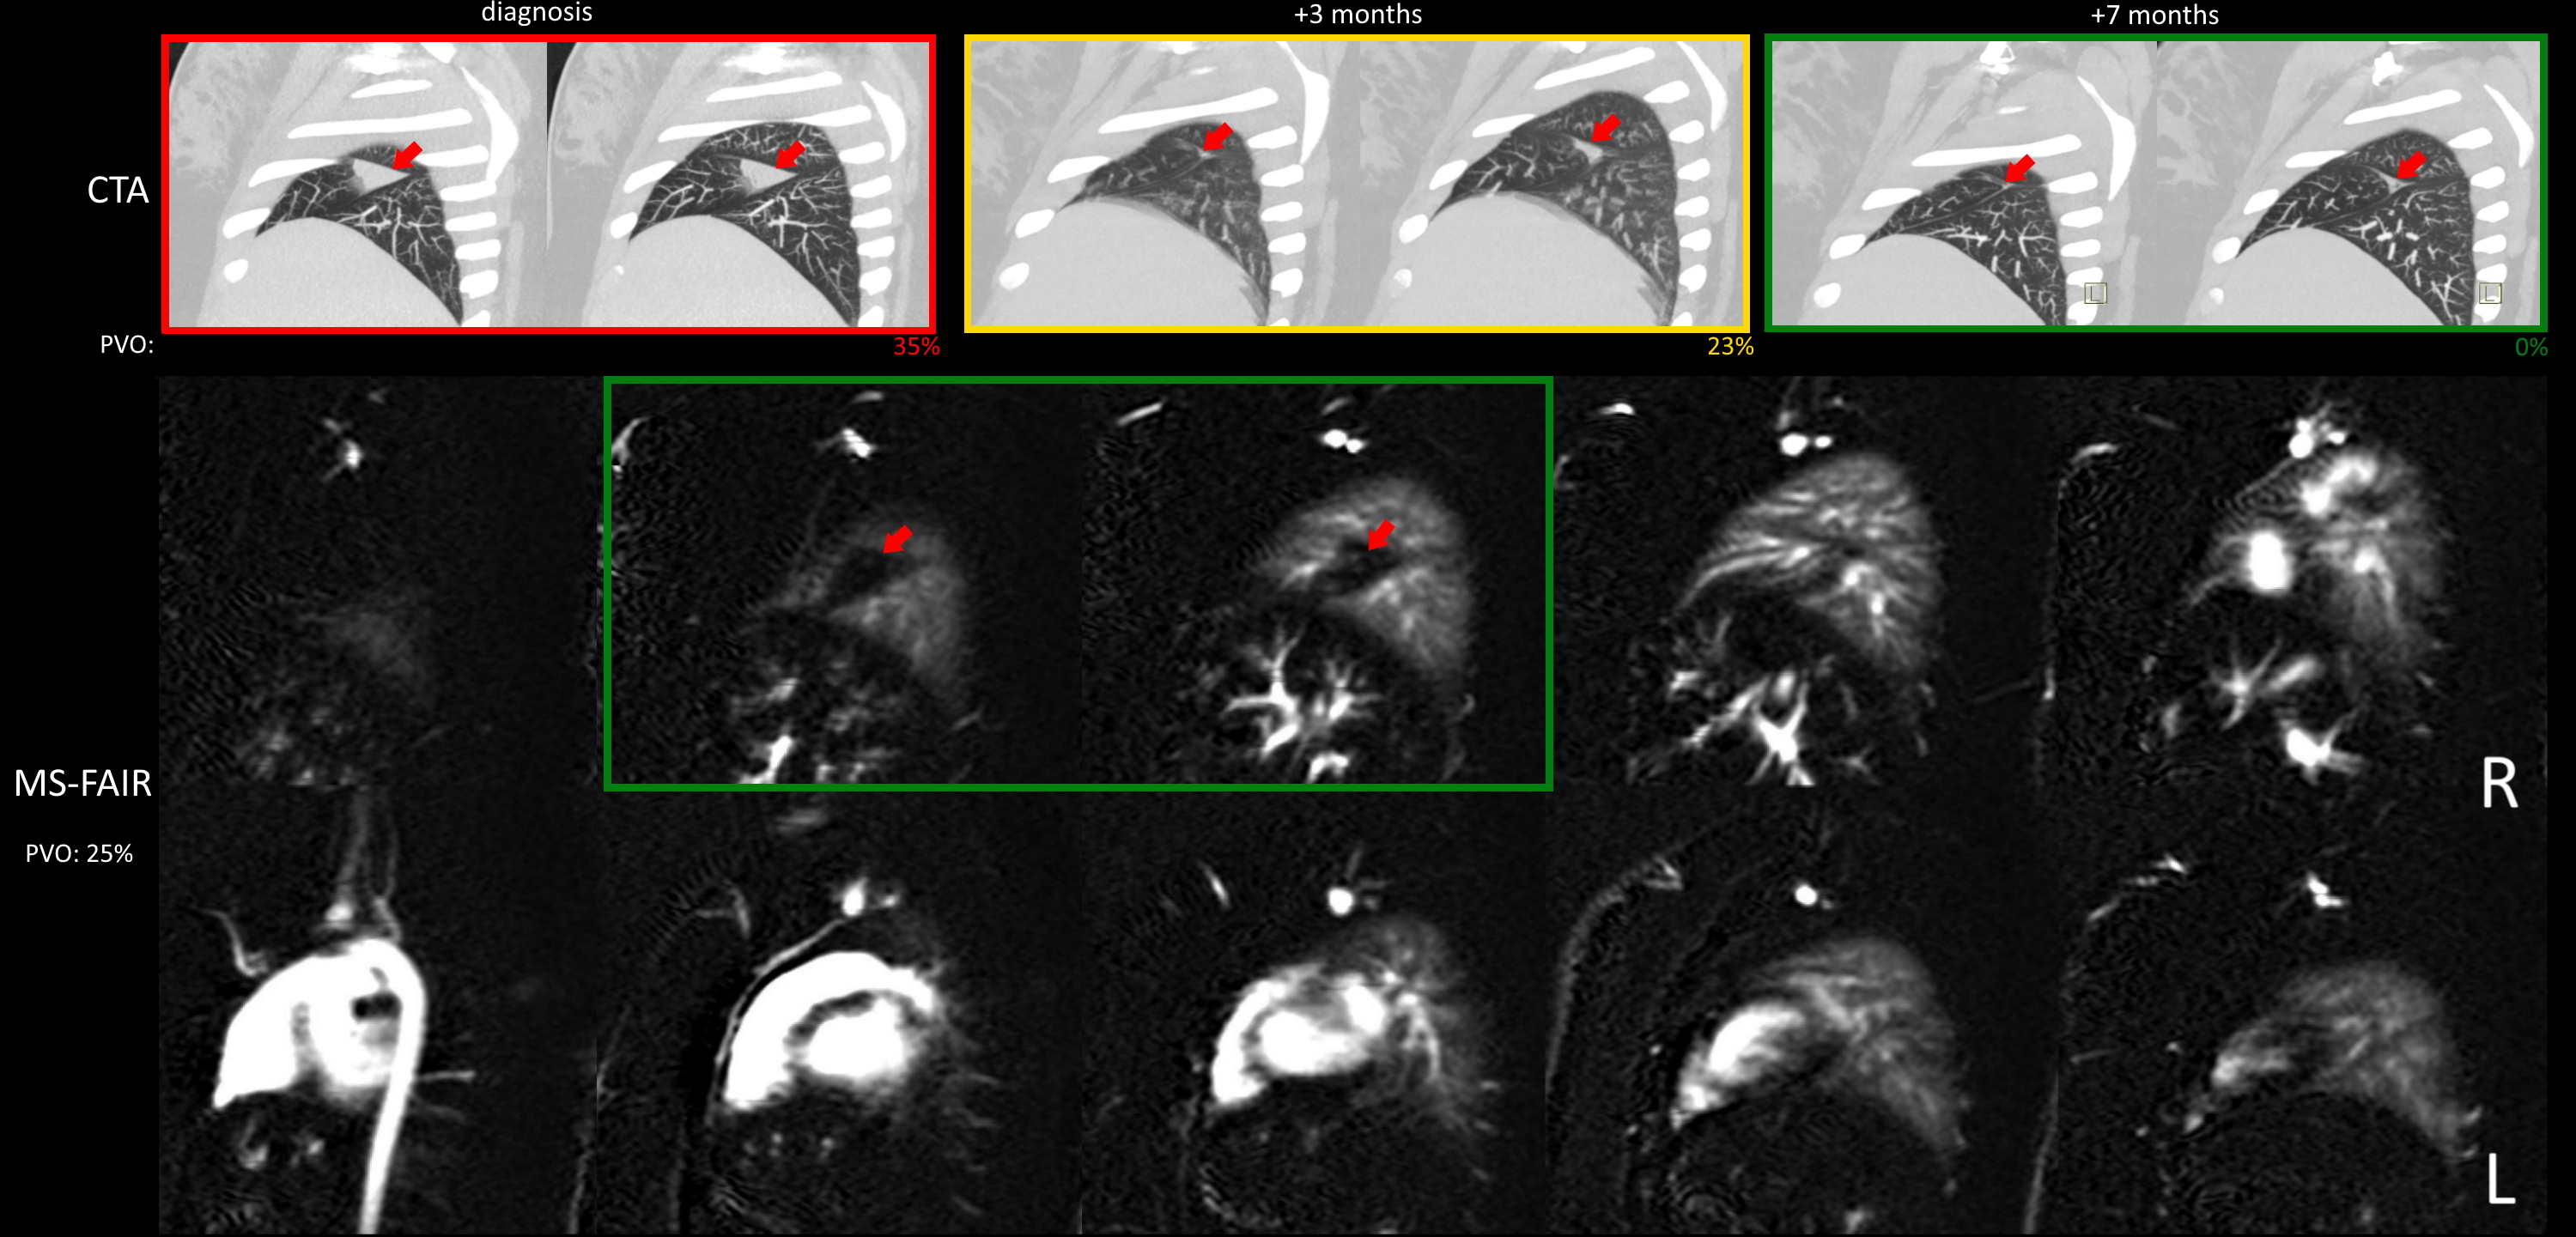
Figure 1A shows quantified MS-FAIR perfusion images in a patient with significant clot burden and large filling defects visible in the right lung. Figure 1B shows the calculated PVO map overlaid on the perfusion images.Figure 2 shows a patient with PE and subsequent pulmonary infarct of the middle right lobe. They received 3 CTA scans over the course of their anticoagulant treatment, with progressive reduction in the clot burden and infarct size shown by CT at 3 and 7 months. Despite this reduction in vascular obstruction, a significant perfusion defect could be seen by ASL at the pulmonary infarct location 7 months after treatment began, in agreement with previous observations by SPECT (3).
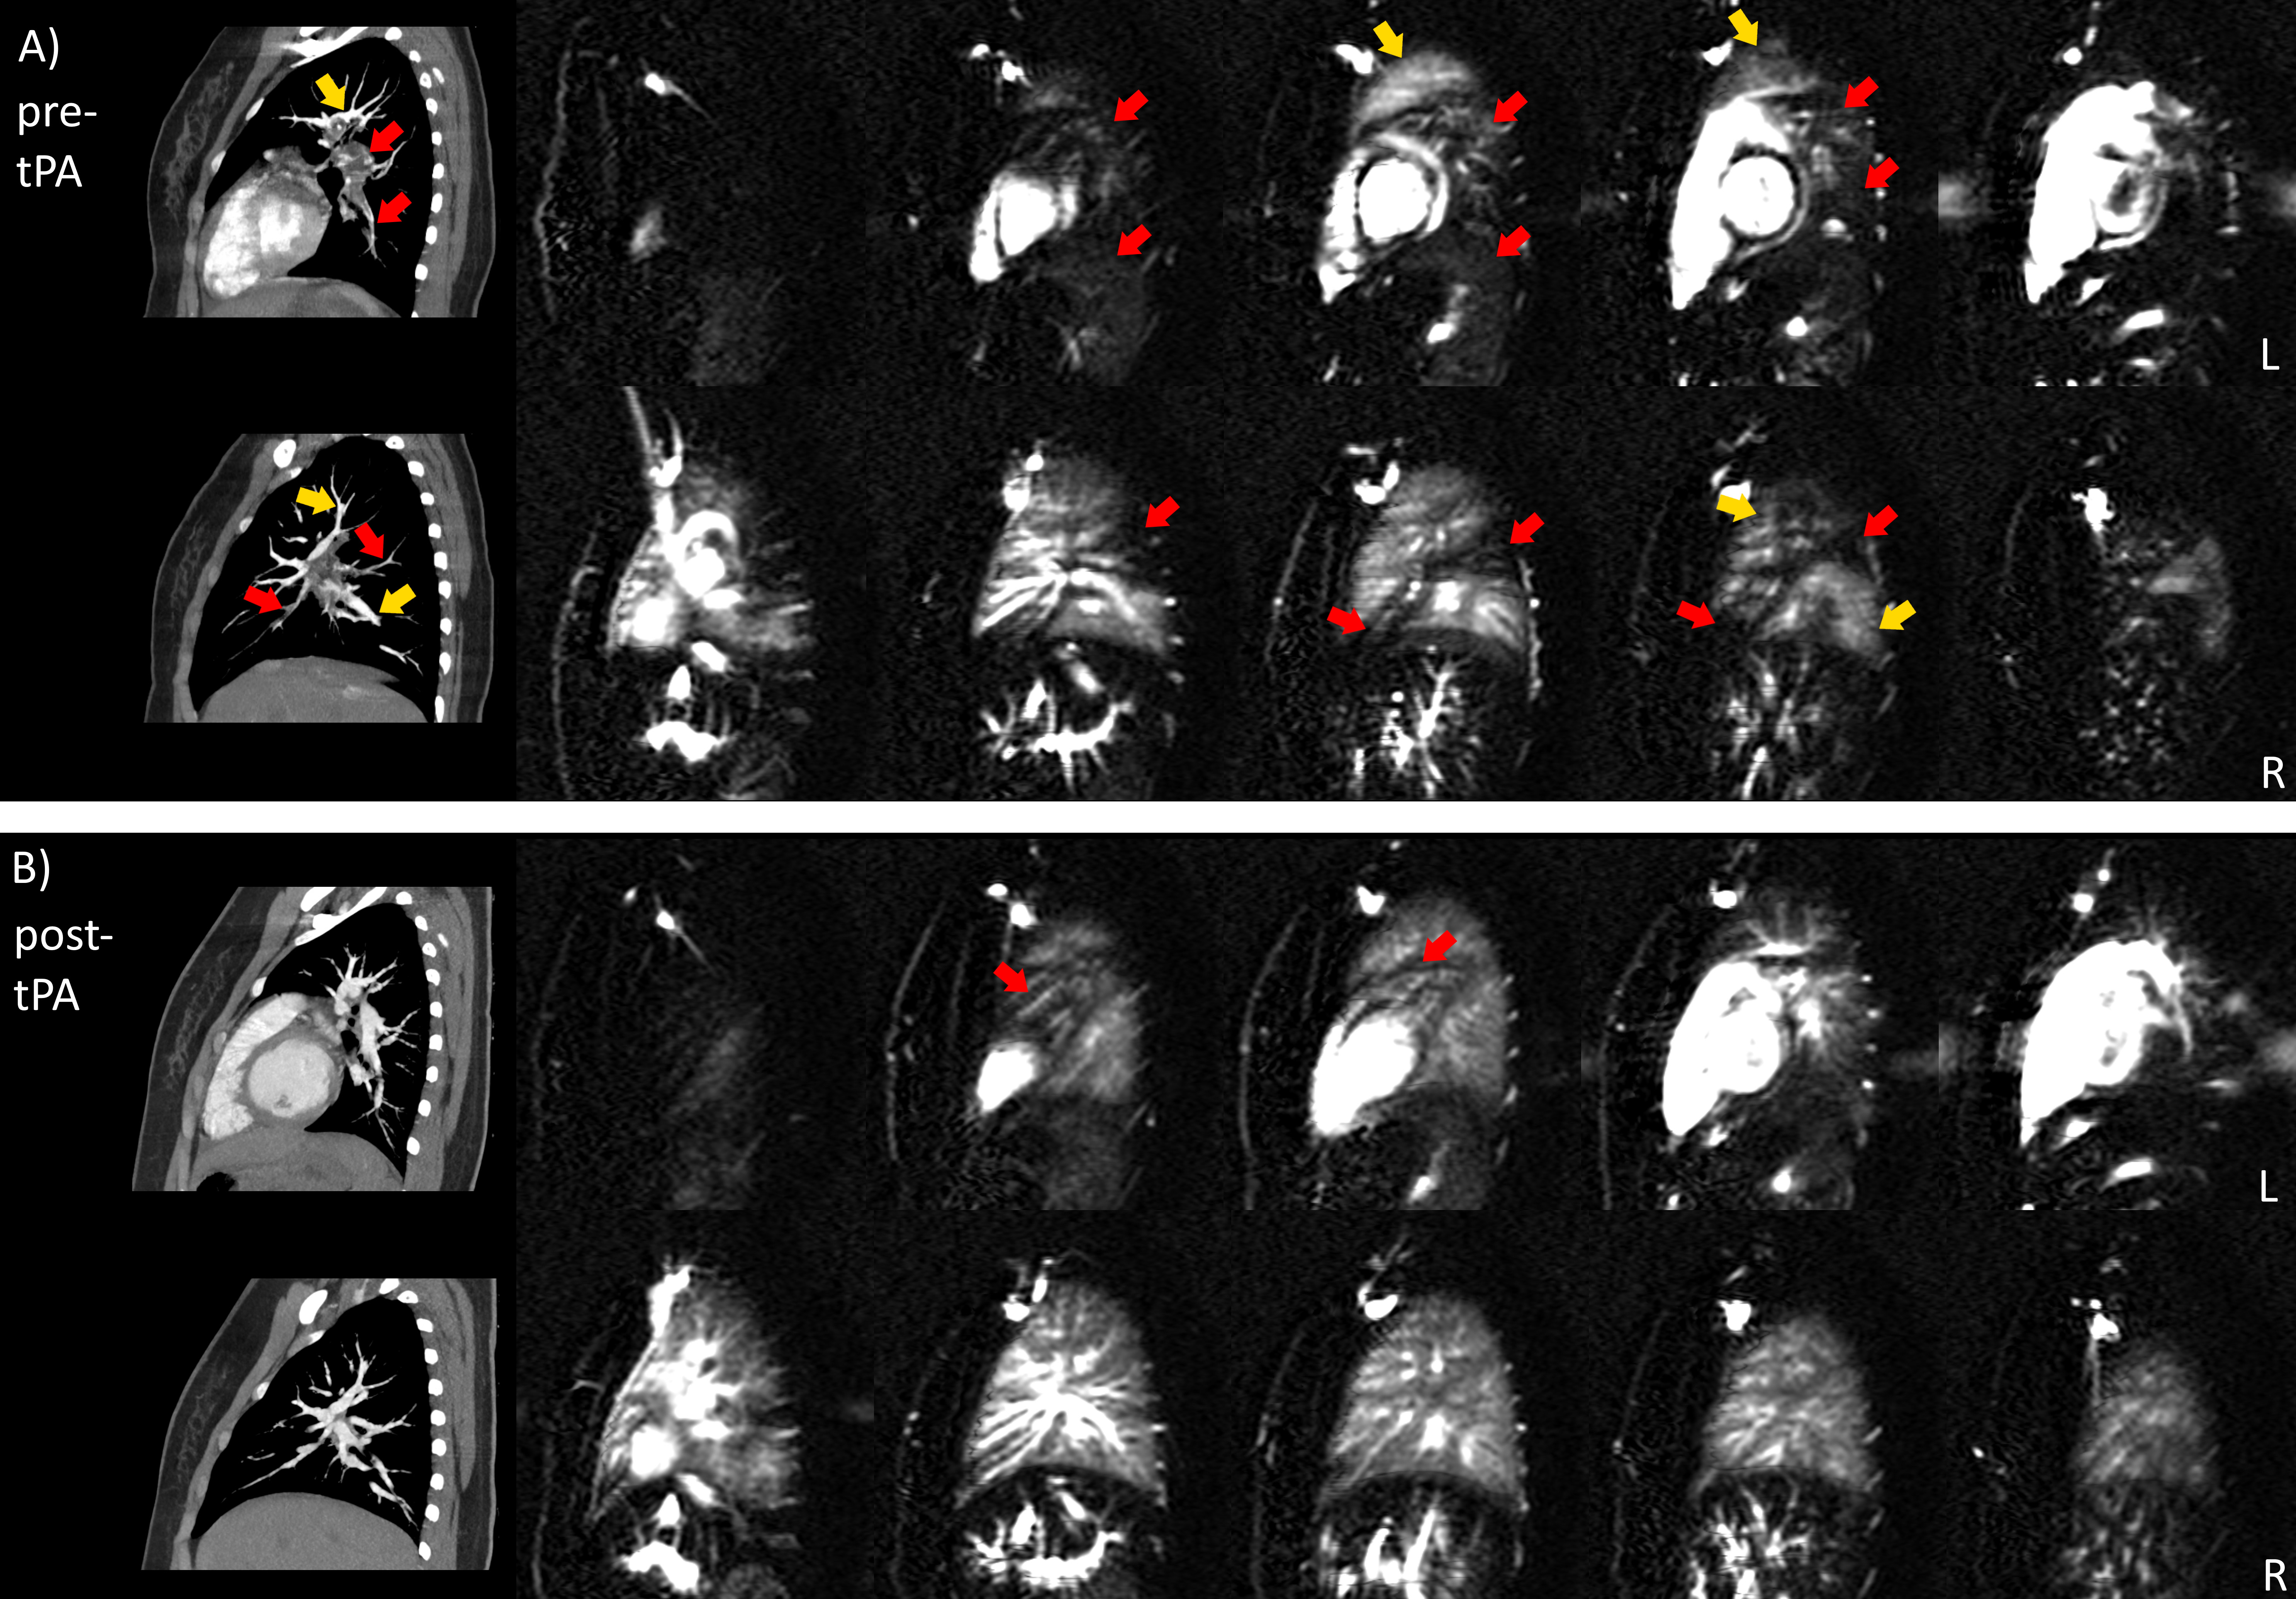
Figure 3A shows significant perfusion defects across both lungs of a patient with PE. CTA shows occluded pulmonary vessels that correspond well with regions of reduced ASL perfusion. Figure 3B shows the same patient 6 months after tPA treatment, with significantly improved vascular filling and pulmonary perfusion shown by CTA and ASL, respectively.
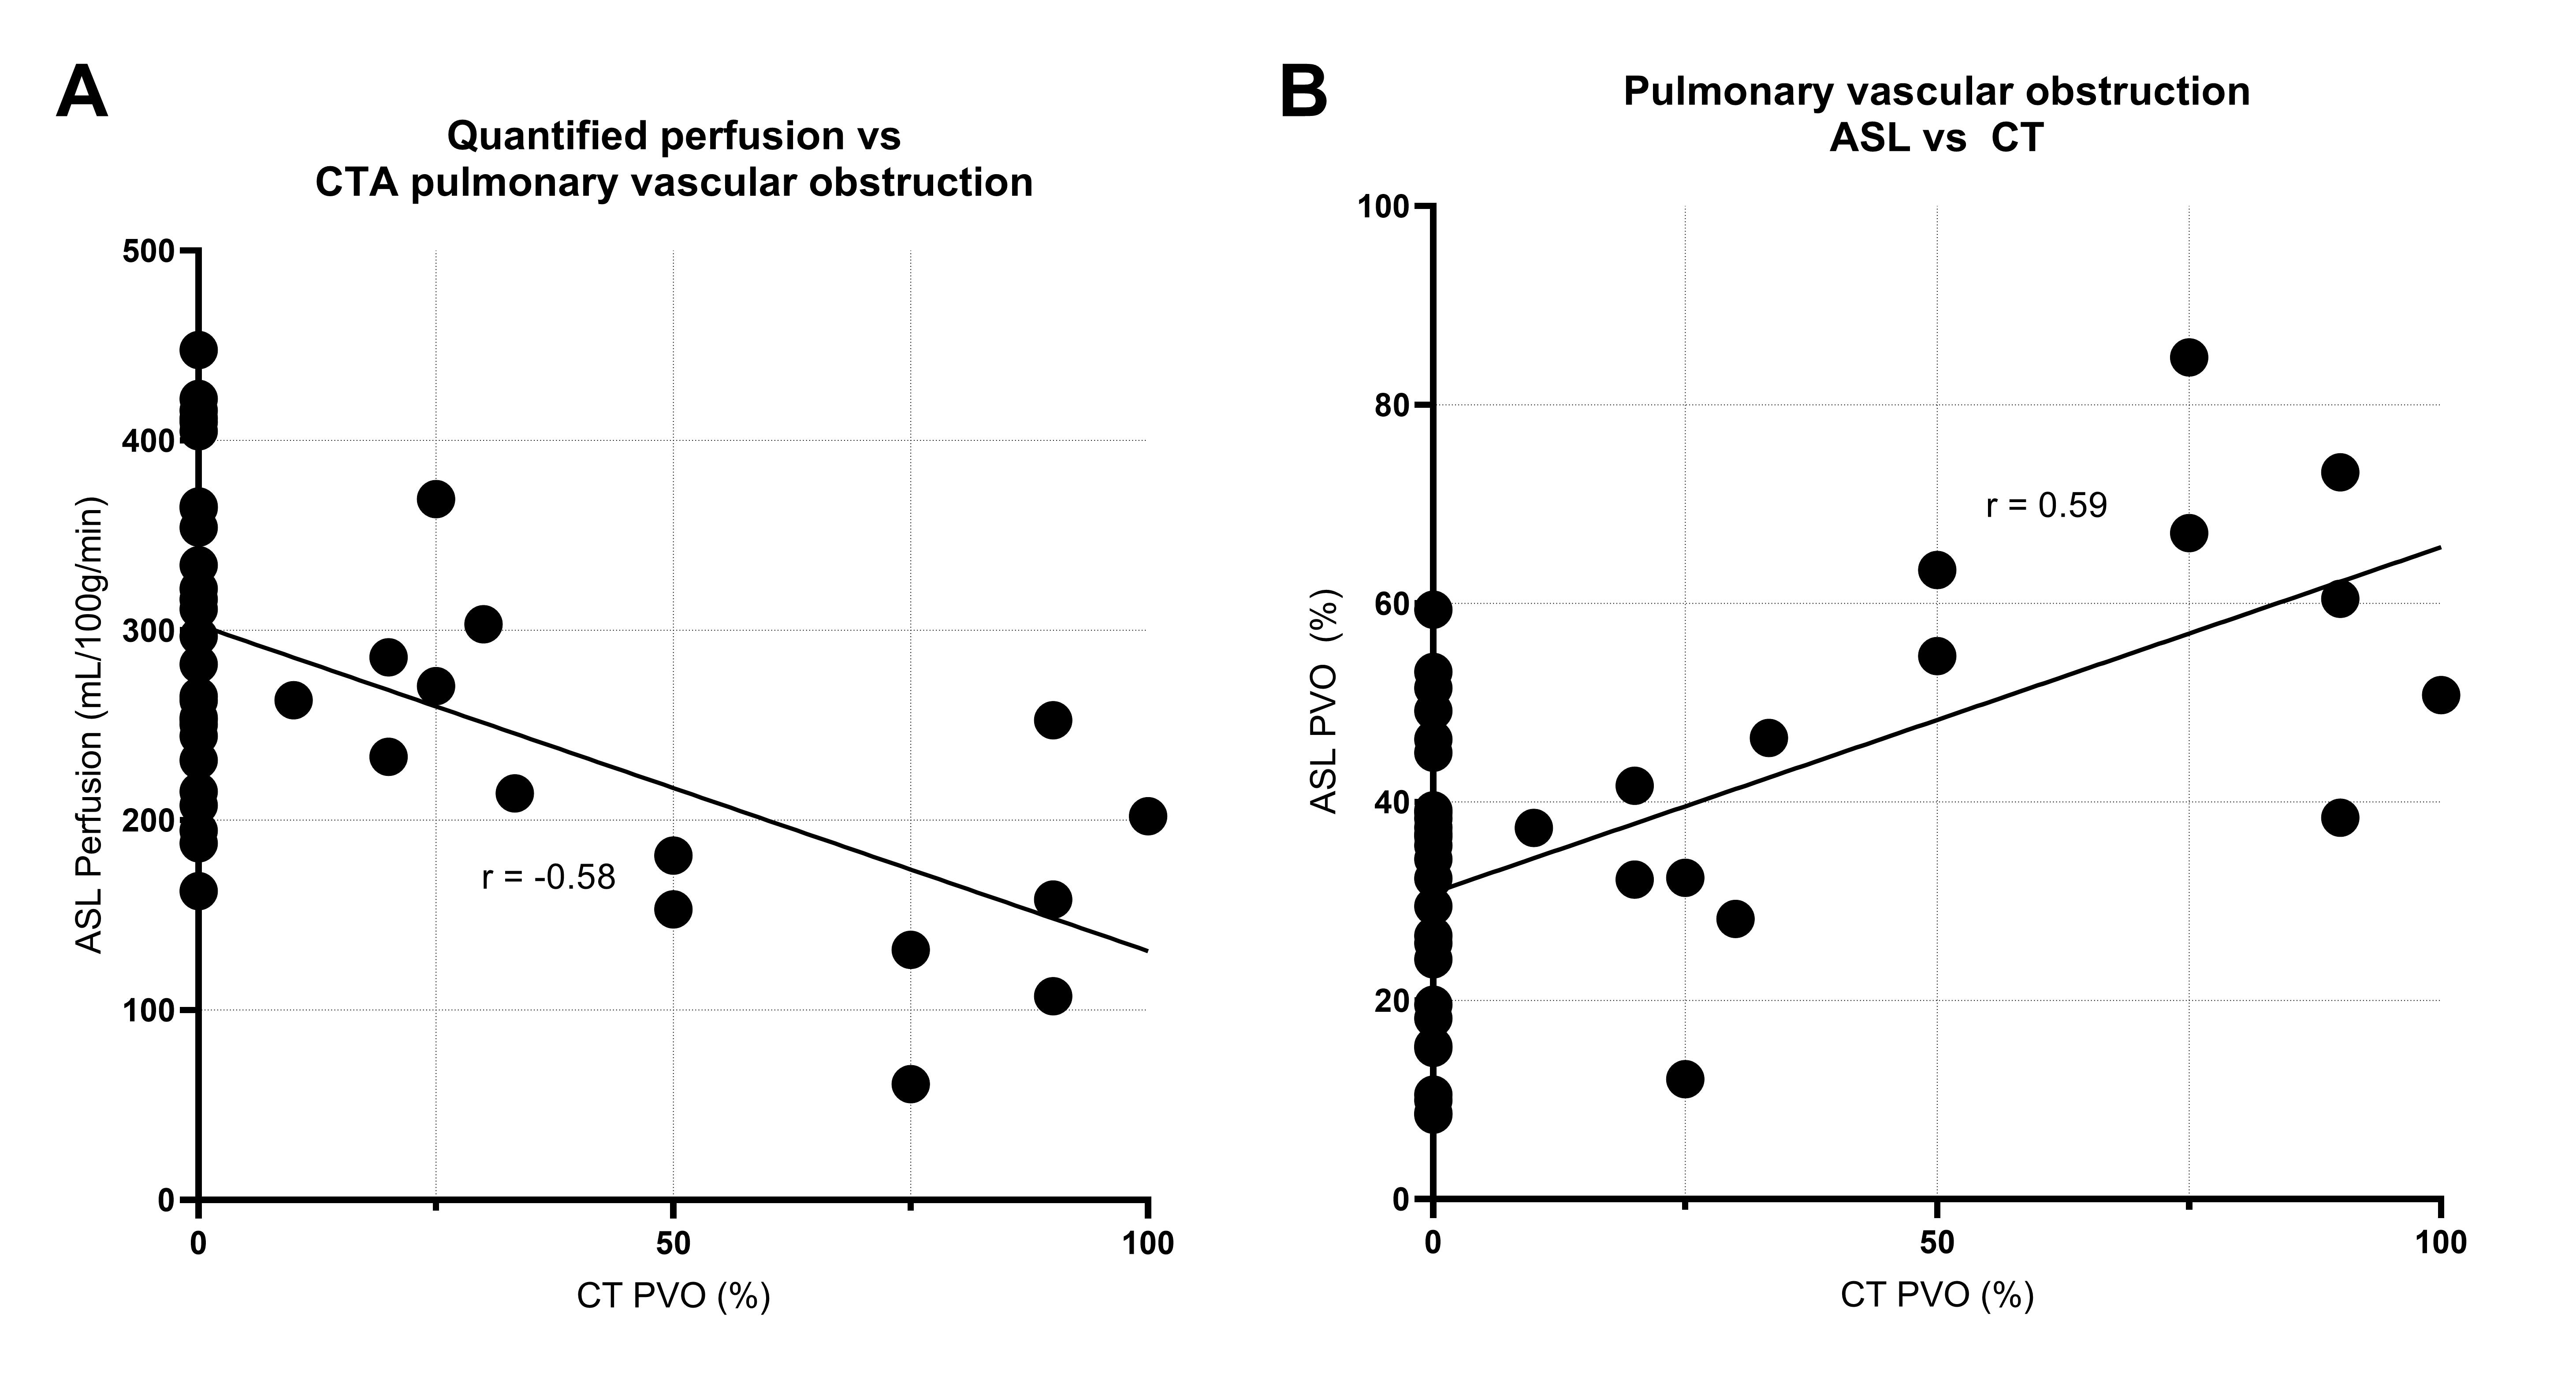
Figure 4 shows the expected negative correlation between CTA-based PVO and quantified ASL perfusion (A) and the positive correlation between PVO measured by CT and ASL across each lobe of all patients.
Discussion
MS-FAIR detected perfusion deficits in all patients in a clinically-acceptable scan time. There was a moderate correlation between ASL parameters and CT obstruction, likely due to them representing different physiological processes. For example, in Figure 2, the vasculature was no longer physically occluded, but perfusion had not been restored to the infarcted region. A similar “no-reflow phenomenon” has been described following myocardial infarction (14).MS-FAIR has the potential to be a valuable tool to monitor patients with a history of PE and determine whether perfusion defects have resolved over time and following treatment. This technique can additionally show perfusion defects not captured by CT without exposing patients to ionizing radiation.
Acknowledgements
No acknowledgement found.References
1. Raffini L, Huang Y-S, Witmer C, Feudtner C. Dramatic increase in venous thromboembolism in children's hospitals in the United States from 2001 to 2007. Pediatrics. 2009;124(4):1001-8.
2. Carpenter SL, Richardson T, Hall M. Increasing rate of pulmonary embolism diagnosed in hospitalized children in the United States from 2001 to 2014. Blood Advances. 2018;2(12):1403-8.
3. Meysman M, Everaert H, Vincken W. Factors determining altered perfusion after acute pulmonary embolism assessed by quantified single-photon emission computed tomography-perfusion scan. Annals of Thoracic Medicine. 2017;12(1):30.
4. Nijkeuter M, Hovens MM, Davidson BL, Huisman MV. Resolution of thromboemboli in patients with acute pulmonary embolism: a systematic review. Chest. 2006;129(1):192-7.
5. Pearce MS, Salotti JA, Little MP, McHugh K, Lee C, Kim KP, et al. Radiation exposure from CT scans in childhood and subsequent risk of leukaemia and brain tumours: a retrospective cohort study. The Lancet. 2012;380(9840):499-505.
6. Mathews JD, Forsythe AV, Brady Z, Butler MW, Goergen SK, Byrnes GB, et al. Cancer risk in 680 000 people exposed to computed tomography scans in childhood or adolescence: data linkage study of 11 million Australians. Bmj. 2013;346.
7. Greer JS, Wang X, Madhuranthakam AJ, editors. Robust non-contrast perfusion imaging of whole-lungs using multi-slice FAIR at 3T. International Society for Magnetic Resonance in Medicine; 2018; Paris, France.
8. Joshua S. Greer, Vasu Gooty, Animesh Tandon, Gerald F. Greil, Tarique Hussain, Madhuranthakam AJ. Non-contrast, free-breathing pulmonary perfusion imaging in pediatric patients with congenital heart disease using multi-slice FAIR at 1.5T. International Society for Magnetic Resonance in Medicine. 2019.
9. Bolar DS, Levin DL, Hopkins SR, Frank LF, Liu TT, Wong EC, et al. Quantification of regional pulmonary blood flow using ASL-FAIRER. Magn Reson Med. 2006;55(6):1308-17.
10. Greer JS, Maroules CD, Oz OK, Abbara S, Peshock RM, Pedrosa I, et al. Non-contrast quantitative pulmonary perfusion using flow alternating inversion recovery at 3 T: A preliminary study. Magnetic resonance imaging. 2018;46:106-13.
11. Buxton RB, Frank LR, Wong EC, Siewert B, Warach S, Edelman RR. A general kinetic model for quantitative perfusion imaging with arterial spin labeling. Magnetic resonance in medicine. 1998;40(3):383-96.
12. Qanadli SD, El Hajjam M, Vieillard-Baron A, Joseph T, Mesurolle B, Oliva VL, et al. New CT index to quantify arterial obstruction in pulmonary embolism: comparison with angiographic index and echocardiography. American Journal of Roentgenology. 2001;176(6):1415-20.
13. Meyer G, Collignon MA, Guinet F, Jeffrey AA, Barritault L, Sors H. Comparison of perfusion lung scanning and angiography in the estimation of vascular obstruction in acute pulmonary embolism. European journal of nuclear medicine. 1990;17(6-8):315-9.
14. Reffelmann T, Kloner RA. The “no-reflow” phenomenon: basic science and clinical correlates. Heart. 2002;87(2):162-8.
Figures