0475
Spatiotemporal characteristics of longitudinal changes in cerebral blood flow across the adult lifespan1Center for Biomedical Imaging Research, Department of Biomedical Engineering, School of Medicine, Tsinghua University, Beijing, China, 2The Russell H. Morgan Department of Radiology & Radiological Science, Johns Hopkins University School of Medicine, Baltimore, MD, United States, 3Department of Biomedical Engineering, Johns Hopkins University School of Medicine, Baltimore, MD, United States, 4Center for Vital Longevity, School of Behavioral and Brain Sciences, University of Texas at Dallas, Dallas, TX, United States, 5Department of Neurology, Johns Hopkins University School of Medicine, Baltimore, MD, United States, 6Department of Biostatistics, Johns Hopkins Bloomberg School of Public Health, Baltimore, MD, United States, 7Center for Imaging Science, Johns Hopkins University, Whiting School of Engineering, Baltimore, MD, United States, 8Advanced Imaging Research Center, University of Texas Southwestern Medical Center, Dallas, TX, United States, 9F.M. Kirby Center for Functional Brain Imaging, Kennedy Krieger Institute, Baltimore, MD, United States
Synopsis
Characterization of age-related changes in blood supply is important in understanding brain aging. The present work reports longitudinal studies of age-related changes in cerebral blood flow (CBF) in two separate cognitively-healthy cohorts using complementary MRI techniques. We found that CBF decreased with age and the longitudinal rate of decline was faster than that from the cross-sectional data. The rate of CBF reduction was faster in younger than in older individuals, in contrast to the temporal pattern of brain volume atrophy. There were also significant spatial differences and hemispheric asymmetry in CBF decline rates.
Introduction
Age is a ubiquitous risk factor for many vascular diseases of the brain such as stroke, atherosclerosis, and small vessel diseases. Characterization of age-related changes in blood supply is therefore important in understanding brain aging and may have implications in cognitive impairment and dementia.1, 2 Age-related differences in cerebral blood flow (CBF) have been extensively investigated in the literature, and many have observed a decrease in CBF with age. However, the majority of them have been based on a cross-sectional design3-5, thus the CBF change could not be assessed on an individual level and the rate of decline may be susceptible to sampling bias. The goal of the present study is to conduct a longitudinal investigation of age-related CBF changes in cognitively normal individuals by MR imaging techniques in two separate cohorts and compare these characteristics of CBF changes to those of brain volume.Methods
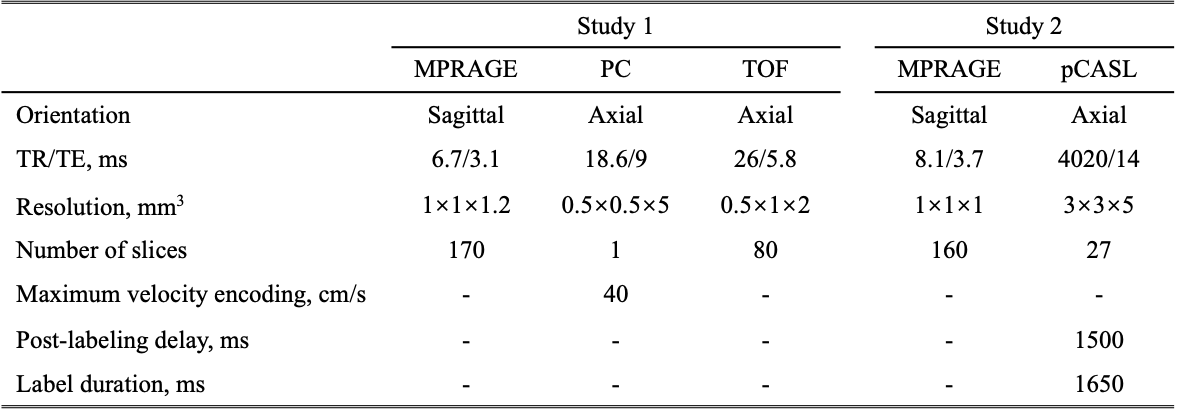
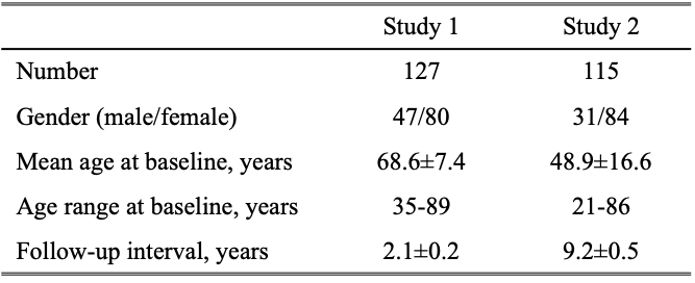
Study sample: The study was performed on two longitudinal cohorts, Biomarkers for Older Controls at Risk for Dementia (BIOCARD, Study 1)6 and Dallas Lifespan Brain Study (DLBS, Study 2)7, each with a relatively large sample size of 127 and 115, respectively. All subjects were free of mild cognitive impairment or dementia and finished the written informed contents at two time points. MR imaging: The MRI examinations of two studies were both conducted on the 3T MR system (Achieva, Philips Healthcare, Best, The Netherlands) and imaging protocols were listed in Table 1. Study 1 used phase-contrast (PC) MRI to quantify whole-brain CBF, while Study 2 used pCASL to quantify regional CBF. Image analysis: For Study 1, data processing of PC MRI followed procedures described previously.3 For Study 2, pCASL data were processed using ASL-MRICloud.8 There was an upgrade of the scanner software between baseline and follow-up in Study 2. Therefore, we re-calibrated the pCASL labeling efficiency in the baseline scans based on the annual PC CBF change rates in Study 1. MPRAGE images were processed using the online T1-MultiAtlas MRICloud tool to obtain brain volume (gray and white matter) and the ratio between brain volume and ICV accounting for variations in head sizes.9 Statistical analysis: Linear mixed effect (LME) models, with random intercepts at the subject level, were used to assess the cross-sectional and longitudinal changes of CBF or normalized brain volume simultaneously. CBF was the dependent variable. Age at baseline (age-related cross-sectional differences), time interval since baseline (age-related longitudinal changes), sex, GM probability and WM probability were used as fixed-effect independent variables. The age-by-time-interval interaction term was additionally added to examine whether the longitudinal change is age-dependent. Next, to compare rate of decline across brain regions, the annual change rate of CBF was calculated as (CBF2-CBF1)/CBF1/time interval. Regional dependence was analyzed using repeated-measure ANOVA which treated the rate of CBF decline as a within-subject variable.Results and Discussion
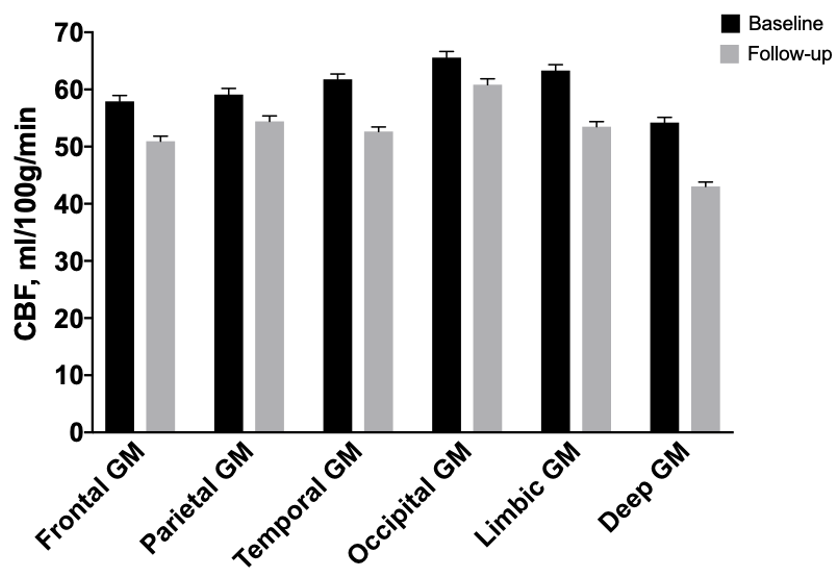
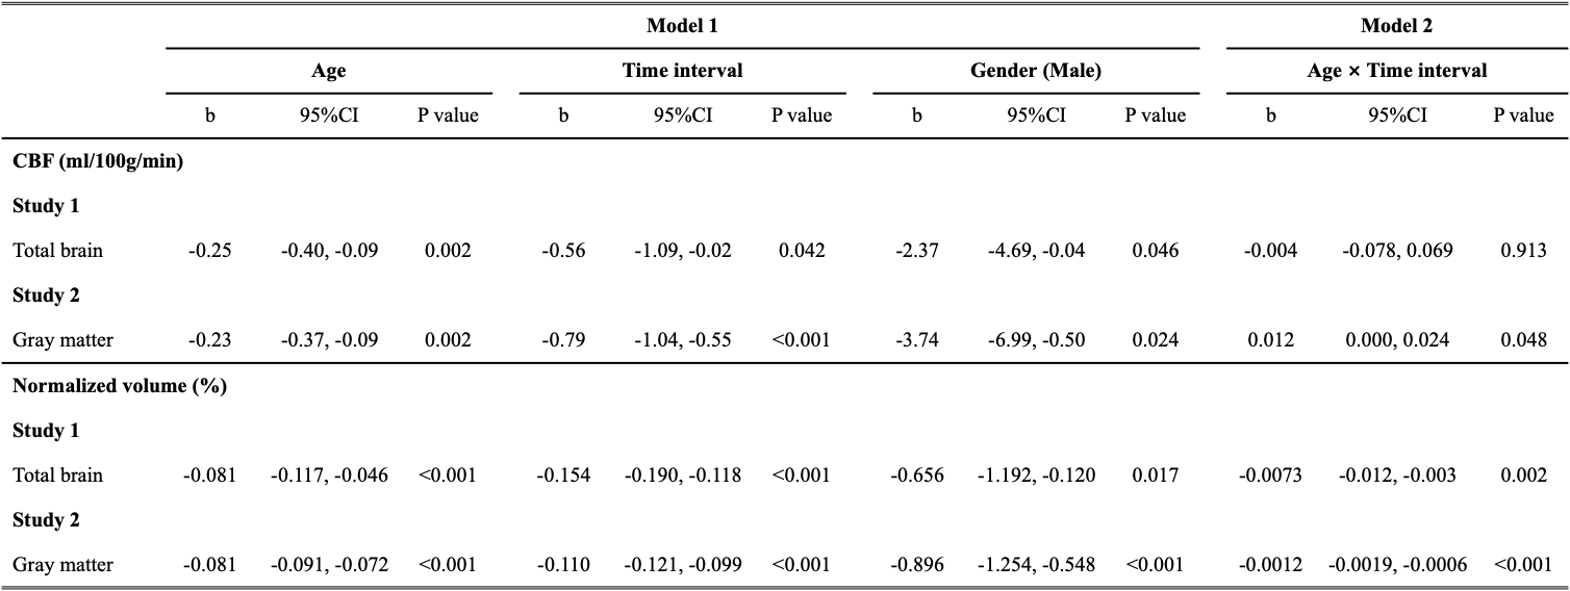
Table 2 lists the characteristics of the subjects. Average whole-brain CBF in Study 1 was 46.8±7.1 and 45.7±7.8 ml/100g/min at baseline and follow-up, respectively, showing a 2.4% reduction over 2.1 years. Figure 1 showed regional CBF reductions between baseline and follow-up in major GM regions in Study 2.LME analyses were then performed and the results were summarized in Table 3. In Study 1, there was a significant effect (p=0.042) of time interval, indicating a longitudinal decline in CBF. There was also a significant effect (p=0.002) of age, indicating a cross-sectional effect of age on CBF. Notably, the longitudinal rate of CBF reduction (-0.56 ml/100g/min per year) was more than double the rate for the cross-sectional effect (-0.25 ml/100g/min per year), suggesting that cross-sectional design may underestimate age-related CBF change. We note that, in cross-sectional comparison, there may exist a sampling bias when comparing CBF between (super-normal) older and (normal) younger subjects.
In Study 2 which is a lifespan cohort, we reproduced these findings but additionally found significant interaction effects of age-by-time-interval in total gray matter (p=0.048, Table 3), showing that the rate of CBF reduction is paradoxically faster in younger than in older individuals, in contrast to the rate of brain volume atrophy which is greater in older than in young (Table 3).
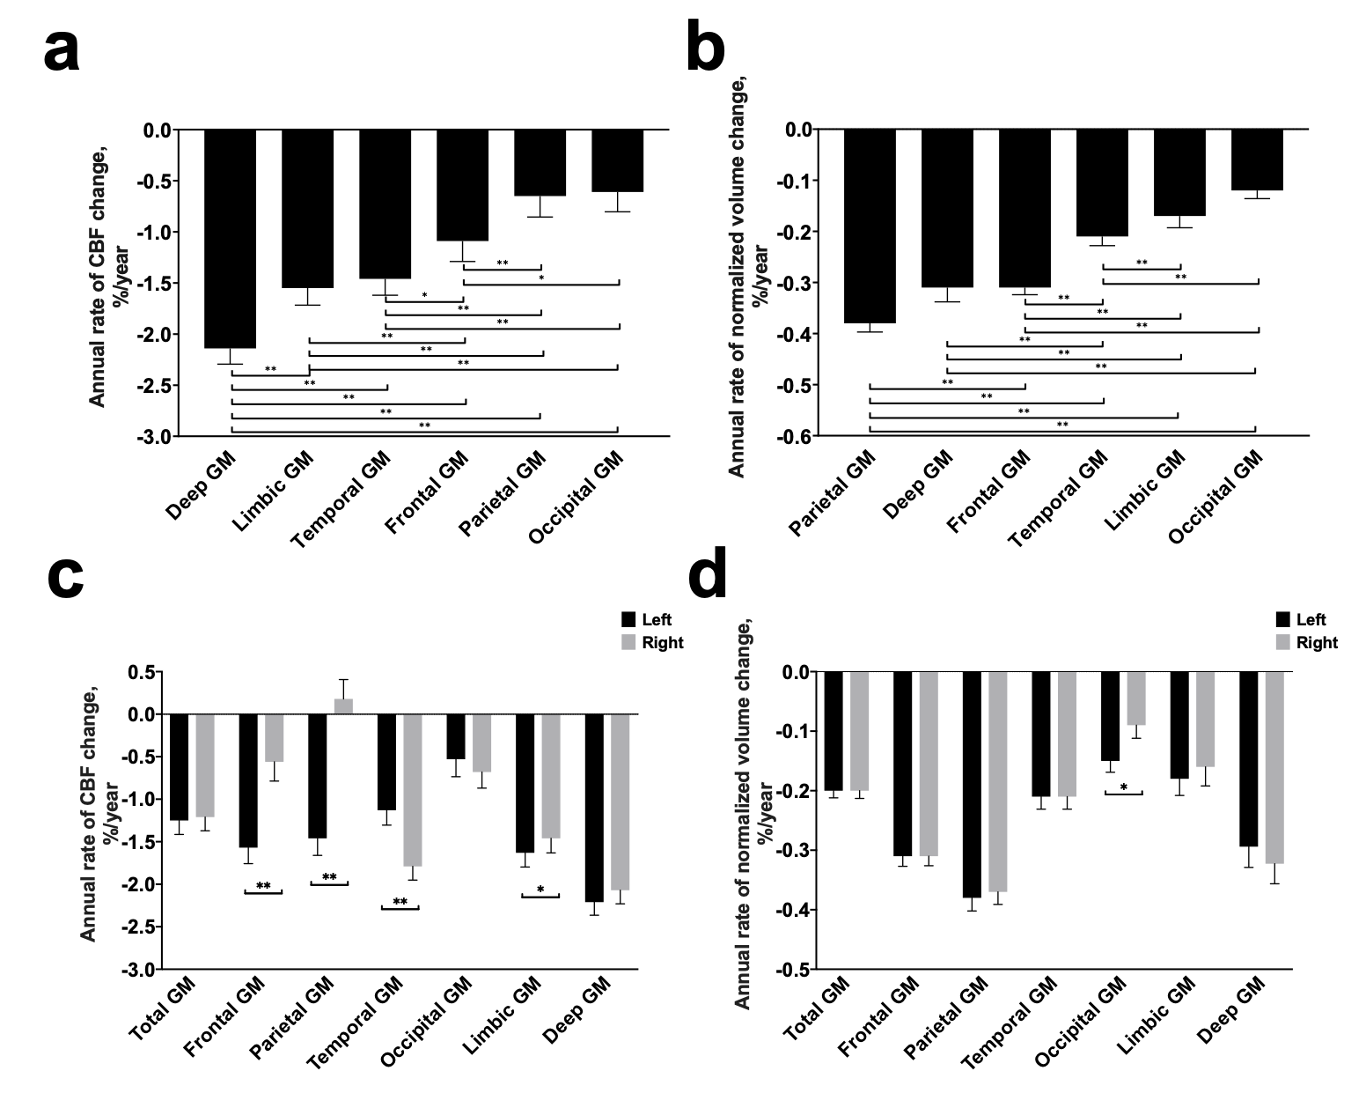
Using data in Study 2 which have regional values, we studied spatial characteristics of the age decline in CBF. There were significant differences across the brain regions (F(5,570)=49.90, P<0.001). Figure 2a shows pairwise comparisons of the annual change rates of CBF. Deep GM had the greatest rate of CBF decline whereas the parietal and occipital lobe showed the least. Note that the rate of volumetric change (Figure 2b) is slower than that of CBF. Comparing left and right hemispheres, there were no significant laterality effects on total GM CBF decline, however, anterior brain regions showed left-prominent reduction and posterior regions showed right-prominent reduction (Figure 2c), while such patterns were not seen volumetric data (Figure 2d).
Conclusion
Longitudinal changes in CBF across the lifespan was systematically characterized. The rate of CBF reduction was found to be substantially greater than cross-sectional observations and faster in young than in older participants, a pattern distinctive from that of brain volume atrophy. In terms of spatial distributions, there were lobe and hemispheric differences in CBF reduction rate.Acknowledgements
No acknowledgement found.References
1. Fantini S, Sassaroli A, Tgavalekos KT, et al. Cerebral blood flow and autoregulation: current measurement techniques and prospects for noninvasive optical methods. Neurophotonics 2016; 3: 031411. 2016/07/13. DOI: 10.1117/1.NPh.3.3.031411.
2. Sojkova J, Beason-Held L, Zhou Y, et al. Longitudinal cerebral blood flow and amyloid deposition: an emerging pattern? J Nucl Med 2008; 49: 1465-1471. 2008/08/16. DOI: 10.2967/jnumed.108.051946.
3. Lu H, Xu F, Rodrigue KM, et al. Alterations in cerebral metabolic rate and blood supply across the adult lifespan. Cereb Cortex 2011; 21: 1426-1434. DOI: 10.1093/cercor/bhq224.
4. Chen JJ, Rosas HD and Salat DH. Age-associated reductions in cerebral blood flow are independent from regional atrophy. Neuroimage 2011; 55: 468-478. DOI: 10.1016/j.neuroimage.2010.12.032.
5. Zhang N, Gordon ML and Goldberg TE. Cerebral blood flow measured by arterial spin labeling MRI at resting state in normal aging and Alzheimer's disease. Neurosci Biobehav Rev 2017; 72: 168-175. 2016/12/03. DOI: 10.1016/j.neubiorev.2016.11.023.
6. Soldan A, Pettigrew C, Cai Q, et al. Cognitive reserve and long-term change in cognition in aging and preclinical Alzheimer's disease. Neurobiol Aging 2017; 60: 164-172. 2017/10/03. DOI: 10.1016/j.neurobiolaging.2017.09.002.
7. Park J, Carp J, Kennedy KM, et al. Neural broadening or neural attenuation? Investigating age-related dedifferentiation in the face network in a large lifespan sample. J Neurosci 2012; 32: 2154-2158. 2012/02/11. DOI: 10.1523/JNEUROSCI.4494-11.2012.
8. Li Y, Liu P, Li Y, et al. ASL-MRICloud: An online tool for the processing of ASL MRI data. NMR in Biomedicine 2019; 32: e4051. DOI: 10.1002/nbm.4051.
9. Mori S, Wu D, Ceritoglu C, et al. MRICloud: Delivering High-Throughput MRI Neuroinformatics as Cloud-Based Software as a Service. Comput Sci Eng 2016; 18: 21-35. DOI: Doi 10.1109/Mcse.2016.93.
Figures