0473
VESPA ASL: VElocity and SPAtially selective Arterial Spin Labeling
Joseph G Woods1, Eric C Wong1, Emma Boyd2, and Divya S Bolar1
1Radiology, UCSD, La Jolla, CA, United States, 2Neurosciences, UCSD, La Jolla, CA, United States
1Radiology, UCSD, La Jolla, CA, United States, 2Neurosciences, UCSD, La Jolla, CA, United States
Synopsis
Velocity-selective ASL (VSASL) accurately depicts cerebral perfusion, even in regions of severely prolonged arterial transit time (ATT). In contrast, spatially-selective ASL, such as pulsed or pseudo-continuous ASL (PCASL), preserves macrovascular signal of blood flowing to these regions. Recent work highlights the importance of using both methods in a complementary way to more completely assess cerebrovascular pathology. In this study, we describe a novel ASL pulse sequence, dubbed VESPA ASL, in which VSASL and PCASL data are simultaneously acquired within a single scan. We further describe a signal model to quantify cerebral blood flow and ATT from these two data sets.
Introduction
Spatially-selective Arterial Spin Labeling (ASL), such as pseudo-continuous ASL (PCASL), is sensitive to arterial transit times (ATT) because arterial blood is labeled in arteries outside the imaging volume (1). This can lead to artifactually decreased perfusion if the labeled bolus is not entirely delivered, yet can also result in macrovascular signal that provides arterial transit information regarding proximal pathology or collateral pathways. In contrast, velocity selective ASL (VSASL) is insensitive to ATT because it labels blood inside the image volume (2), allowing immediate label delivery without delay. Thus, VSASL accurately reflects cerebral blood flow (CBF) even in cases of delayed blood arrival. It has been shown that acquiring both VSASL and spatially-selective ASL yields complementary, clinically useful information about perfusion and arterial transit delays, but requires twice the scan time (3).In this work, we introduce the VElocity and SPAtially selective (VESPA) ASL sequence, which combines VSASL and PCASL, in order to label two distinct arterial blood pools. A linearly independent control/label encoding scheme permits quantitative measurement of absolute CBF and ATT from decoded VSASL and PCASL signals. Other operating modes flexibly trade off macrovascular ASL signal, quantitation of CBF, and SNR.
Methods
Figure 1 provides the VESPA sequence timing diagram. The PCASL module is inserted in time between the first and second VSASL modules. The first module is spatially-selective to label spins within the imaging slab. The second module is non-selective and designed to suppress ASL signal flowing above the VSASL velocity cutoff (Vcut). A global pre-saturation resets the magnetization after the previous TR. The PCASL labeling plane is positioned directly below the inferior edge of the VSASL labeling volume. Label and control conditions are alternated in a linearly independent order (Figure 1, center). The different contrasts are encoded in the acquired images and decoded using simple image arithmetic (Figure 1, right). VSASL inflow time (TI) roughly equals PCASL labeling duration (LD).Two time periods are considered for quantification: TI<Δt and TI>Δt, where Δt is the ATT. When TI<Δt, no PCASL signal has arrived and VSASL bolus duration is TI. In this case, CBF can be estimated but the ATT is only known to be >TI. When TI>Δt, the PCASL bolus accumulates in the tissue and the VSASL bolus duration is Δt. CBF and ATT are estimated by fitting the following signal model to the data:
$${\Delta}M_{VSASL}=M_0{\cdot}{\alpha}{\cdot}{f}{\cdot}{TI}{\cdot}{e^{-\frac{TI}{T_1}}}{\cdot}(1-e^{-\frac{T_{sat}}{T_1}}),{\qquad}{\qquad}{\qquad}{\qquad}{\quad}{TI<{\Delta}t}\\{\qquad}{\quad}=M_0{\cdot}{\alpha}{\cdot}{f}{\cdot}{{\Delta}t}{\cdot}{e^{-\frac{TI}{T_1}}}{\cdot}(1-e^{-\frac{T_{sat}}{T_1}}),{\qquad}{\qquad}{\qquad}{\qquad}{\quad}{{\Delta}t}<TI\\~\\{\Delta}M_{PCASL}=0,{\qquad}{\qquad}{\qquad}{\qquad}{\qquad}{\qquad}{\qquad}{\qquad}{\qquad}{\;\,}{TI<{\Delta}t}{\;}\\{\qquad}{\quad}=2{\cdot}{M_0}{\cdot}{\alpha}{\cdot}{f}{\cdot}[({\Delta}t-TI){\cdot}e^{-\frac{T_{sat}+TI}{T_1}}+{T_1}{\cdot}({e^{-\frac{{\Delta}t}{T_1}}}-{e^{-\frac{TI}{T_1}}})],{\quad}{{\Delta}t}<TI$$
M0 is the equilibrium magnetization of blood, α is the labeling efficiency (0.85 for VSASL (simulation), 0.85 of PCASL (3), f is CBF in ml/ml/s, T1 is the longitudinal relaxation time of blood (1.65s), and Tsat is the time between pre-saturation and VS1.
VESPA data were acquired on a healthy volunteer at 3T (GE MR750) with TI/LD = 1800ms and Vcut = 2cm/s. Accuracy of the VESPA signal decoding was evaluated by comparing to separate VSASL and PCASL scans, acquired by disabling the appropriate labeling module. CBF and ATT were calculated by fitting the VESPA signal model to the decoded VSASL and PCASL data. VESPA data were also acquired at three different TIs (1s, 1.25s, 1.5s) with vascular suppression partially disabled in the second VSASL module, to preserve macrovascular signal in PCASL. Other parameters: scan duration 5:20 minutes, TR 4s, Vcut 2cm/s, 2D-SE spiral readout, TE 15.8ms, 5 slices, voxel size 3.1x3.1x8mm3, 40 averages.
Results
Figure 2 demonstrates accurate decoding of the VESPA signal via comparison to distinct VSASL and PCASL acquisitions.Figure 3 shows CBF and ATT maps after voxelwise fitting VESPA data with the proposed signal model.
Figure 4 demonstrates VESPA decoded VSASL and PCASL contrasts across three TIs with vascular suppression partially disabled. While VSASL signal is constant across TIs, the PCASL signal remains intravascular and flows deeper into the vascular tree as TI increases .
Discussion
VESPA ASL is a novel sequence that combines PCASL and VSASL into a signal scan. VESPA involves inserting PCASL labeling between two VSASL modules, which allows labeling of two distinct arterial blood pools. The bolus delivery delay between the PCASL and VSASL labels allow simultaneous quantitative measurement of CBF and ATT. A 50% scan time reduction relative to acquiring the data separately is achieved, in addition to obviating the need for multi-delay PCASL to estimate ATT.Other modes of VESPA operation may also be of interest. Disabling vascular suppression of the second VSASL module preserves macrovascular signal (so-called “arterial transit artifact”, ATA), which has significant clinical value. Acquiring only dual label and dual control scans (A and D in Figure 1) provides the highest SNR, but only allows approximate calculation of CBF, and no direct information about ATT. Disabling vascular suppression in this mode retains macrovascular signal/ATA in addition to high SNR CBF signal.
Given the clinical need for complementary CBF and arterial transit information in short imaging times (for example, in acute stroke), VESPA has potential to become a robust clinical ASL technique, possibly even replacing PCASL as the criterion-standard.
Conclusion
VESPA ASL introduces a novel and efficient way to simultaneously acquire VSASL and PCASL data. A VESPA signal model to quantify CBF and ATT is presented with generation of human CBF and ATT maps.Acknowledgements
Divya S. Bolar is supported by an RSNA Resident/Fellow Grant.References
- Alsop DC, Detre JA. Reduced transit-time sensitivity in noninvasive magnetic resonance imaging of human cerebral blood flow. J Cereb Blood Flow Metab. 1996 Nov;16(6):1236-49. doi: 10.1097/00004647-199611000-00019.
- Wong EC, Cronin M, Wu WC, Inglis B, Frank LR, Liu TT. Velocity-selective arterial spin labeling. Magn Reson Med. 2006 Jun;55(6):1334-41. doi: 10.1002/mrm.20906.
- Bolar DS, Gagoski B, Orbach DB, Smith E, Adalsteinsson E, Rosen BR, Grant PE, Robertson RL. Comparison of CBF Measured with Combined Velocity-Selective Arterial Spin-Labeling and Pulsed Arterial Spin-Labeling to Blood Flow Patterns Assessed by Conventional Angiography in Pediatric Moyamoya. AJNR Am J Neuroradiol. 2019 Nov;40(11):1842-1849. doi: 10.3174/ajnr.A6262.
- Lu H, Clingman C, Golay X, van Zijl PCM. Determining the longitudinal relaxation time (T1) of blood at 3.0 Tesla. Magn. Reson. Med. 2004;52:679–682 doi: 10.1002/mrm.20178.
Figures
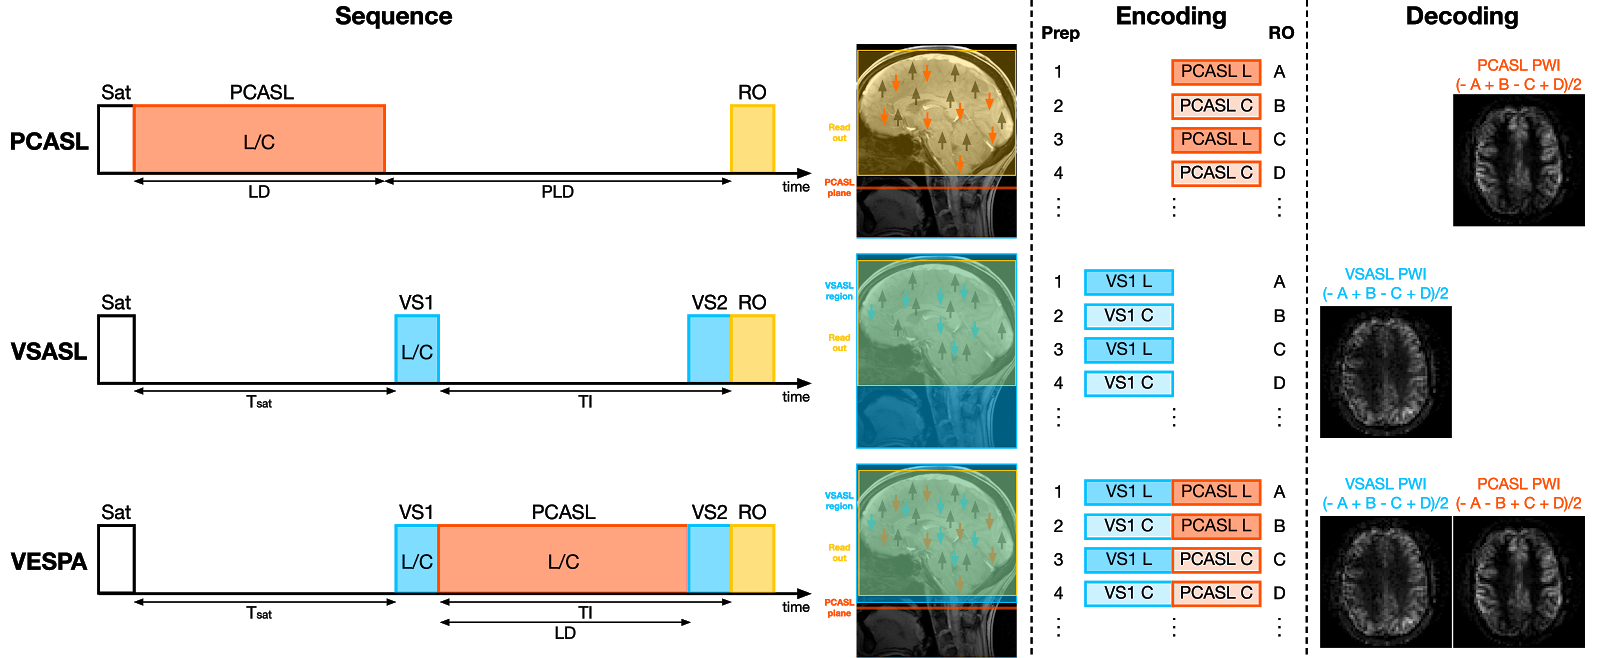
Figure 1: Sequence diagrams, label/control encoding, and contrast decoding strategies for PCASL, VSASL and VESPA. In VESPA, VSASL and PCASL are combined and used to label different pools of inflowing arterial blood. VSASL labeling (VS1) uses a spatially-selective VSASL module surrounding the imaging slab. The PCASL labeling plane is immediately inferior to the VSASL slab. By alternating label and control conditions in different orders, VSASL and PCASL contrasts can be linearly encoded into the acquired images and decoded by simple image arithmetic
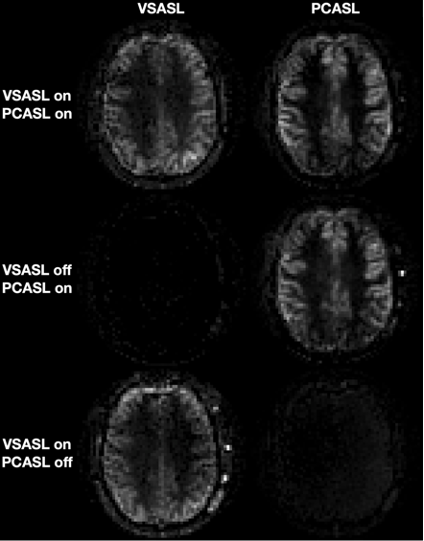
Figure 2: Successful separation of VSASL and PCASL signals from VESPA data. Top row: VS1 and PCASL are both on; middle row: VS1 is switched off while PCASL is kept on; bottom row: VS1 is on but PCASL has been switched off. TI = 1800 ms.
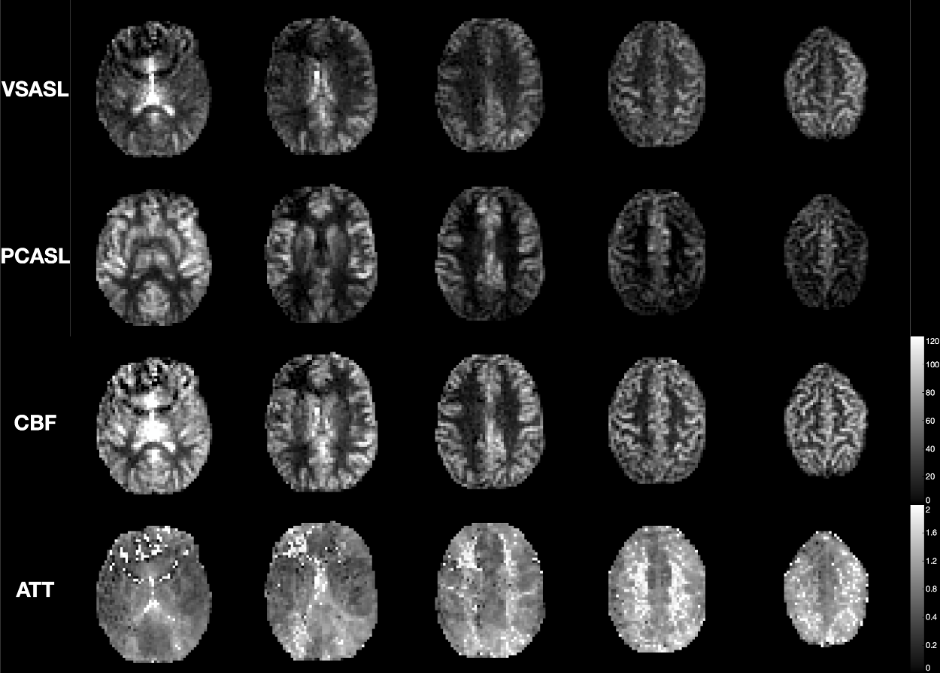
Figure 3: The VESPA decoded VSASL and PCASL data, with the CBF and ATT maps calculated by voxelwise fitting the VESPA signal model to the decoded VESPA data. Five slices from 1 subject are shown. Longer ATTs can be seen in the white matter, posterior circulation, and at both internal and external border zones. Before fitting, the data were voxelwise calibrated by the M0 image and corrected for slice-dependent T1 decay.
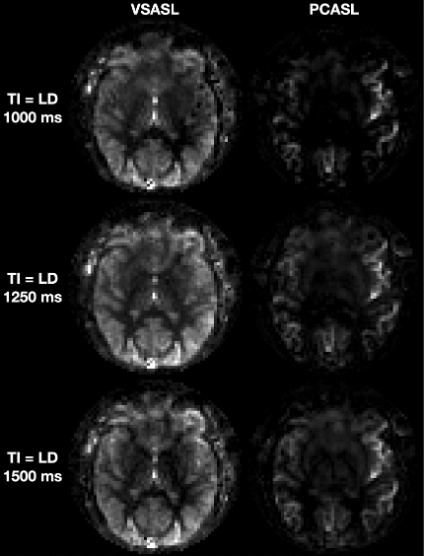
Figure 4: VESPA decoded VSASL and PCASL data at 3 different TIs with vascular suppression in the second VSASL module partially disabled, thus preserving some macrovascular PCASL signal (e.g., within MCA branches). VSASL data appears similar across TIs, whereas macrovascular PCASL signal flows further downstream as TI increases.