0472
Venous Oxygenation Mapping using Fourier-Transform based Velocity-Selective Pulse Trains1Radiology Department, Johns Hopkins University School of Medicine, Baltimore, MD, United States, 2Kirby Image Center, Kennedy Krieger Institute, Baltimore, MD, United States
Synopsis
A T2-oximetry method is proposed to map the venous oxygenation by using Fourier-transform based velocity-selective inversion plus non-selective inversion to null the arterial blood signal while using Fourier-transform based velocity-selective saturation to suppress the tissue signal. Compared to previous schemes, the proposed method has the benefit of high SNR and insensitivity to arterial transit delays. Using this method, the venous oxygenation values obtained from two volunteers at 3T are similar between gray matter and white matter and comparable to the values measured globally.
Introduction
The oxygen extraction fraction (OEF) calculated from venous oxygenation (Yv) is an important hemodynamic indicator of brain health and function. T2-oximetry based Yv mapping methods such as QUIXOTIC1,2 and VSEAN3,4 currently suffer from low SNR of available venous blood signal in each voxel. Recently, a venous CBV method5 by utilizing Fourier-transform based velocity-selective inversion (FT-VSI) and saturation (FT-VSS) pulse trains for arterial-nulling and tissue suppression was introduced, in order to achieve higher SNR and insensitivity to arterial transit delay and CSF contamination6. Here we combine this venous isolation preparation with the multi-echo acquisition to estimate Yv.Methods
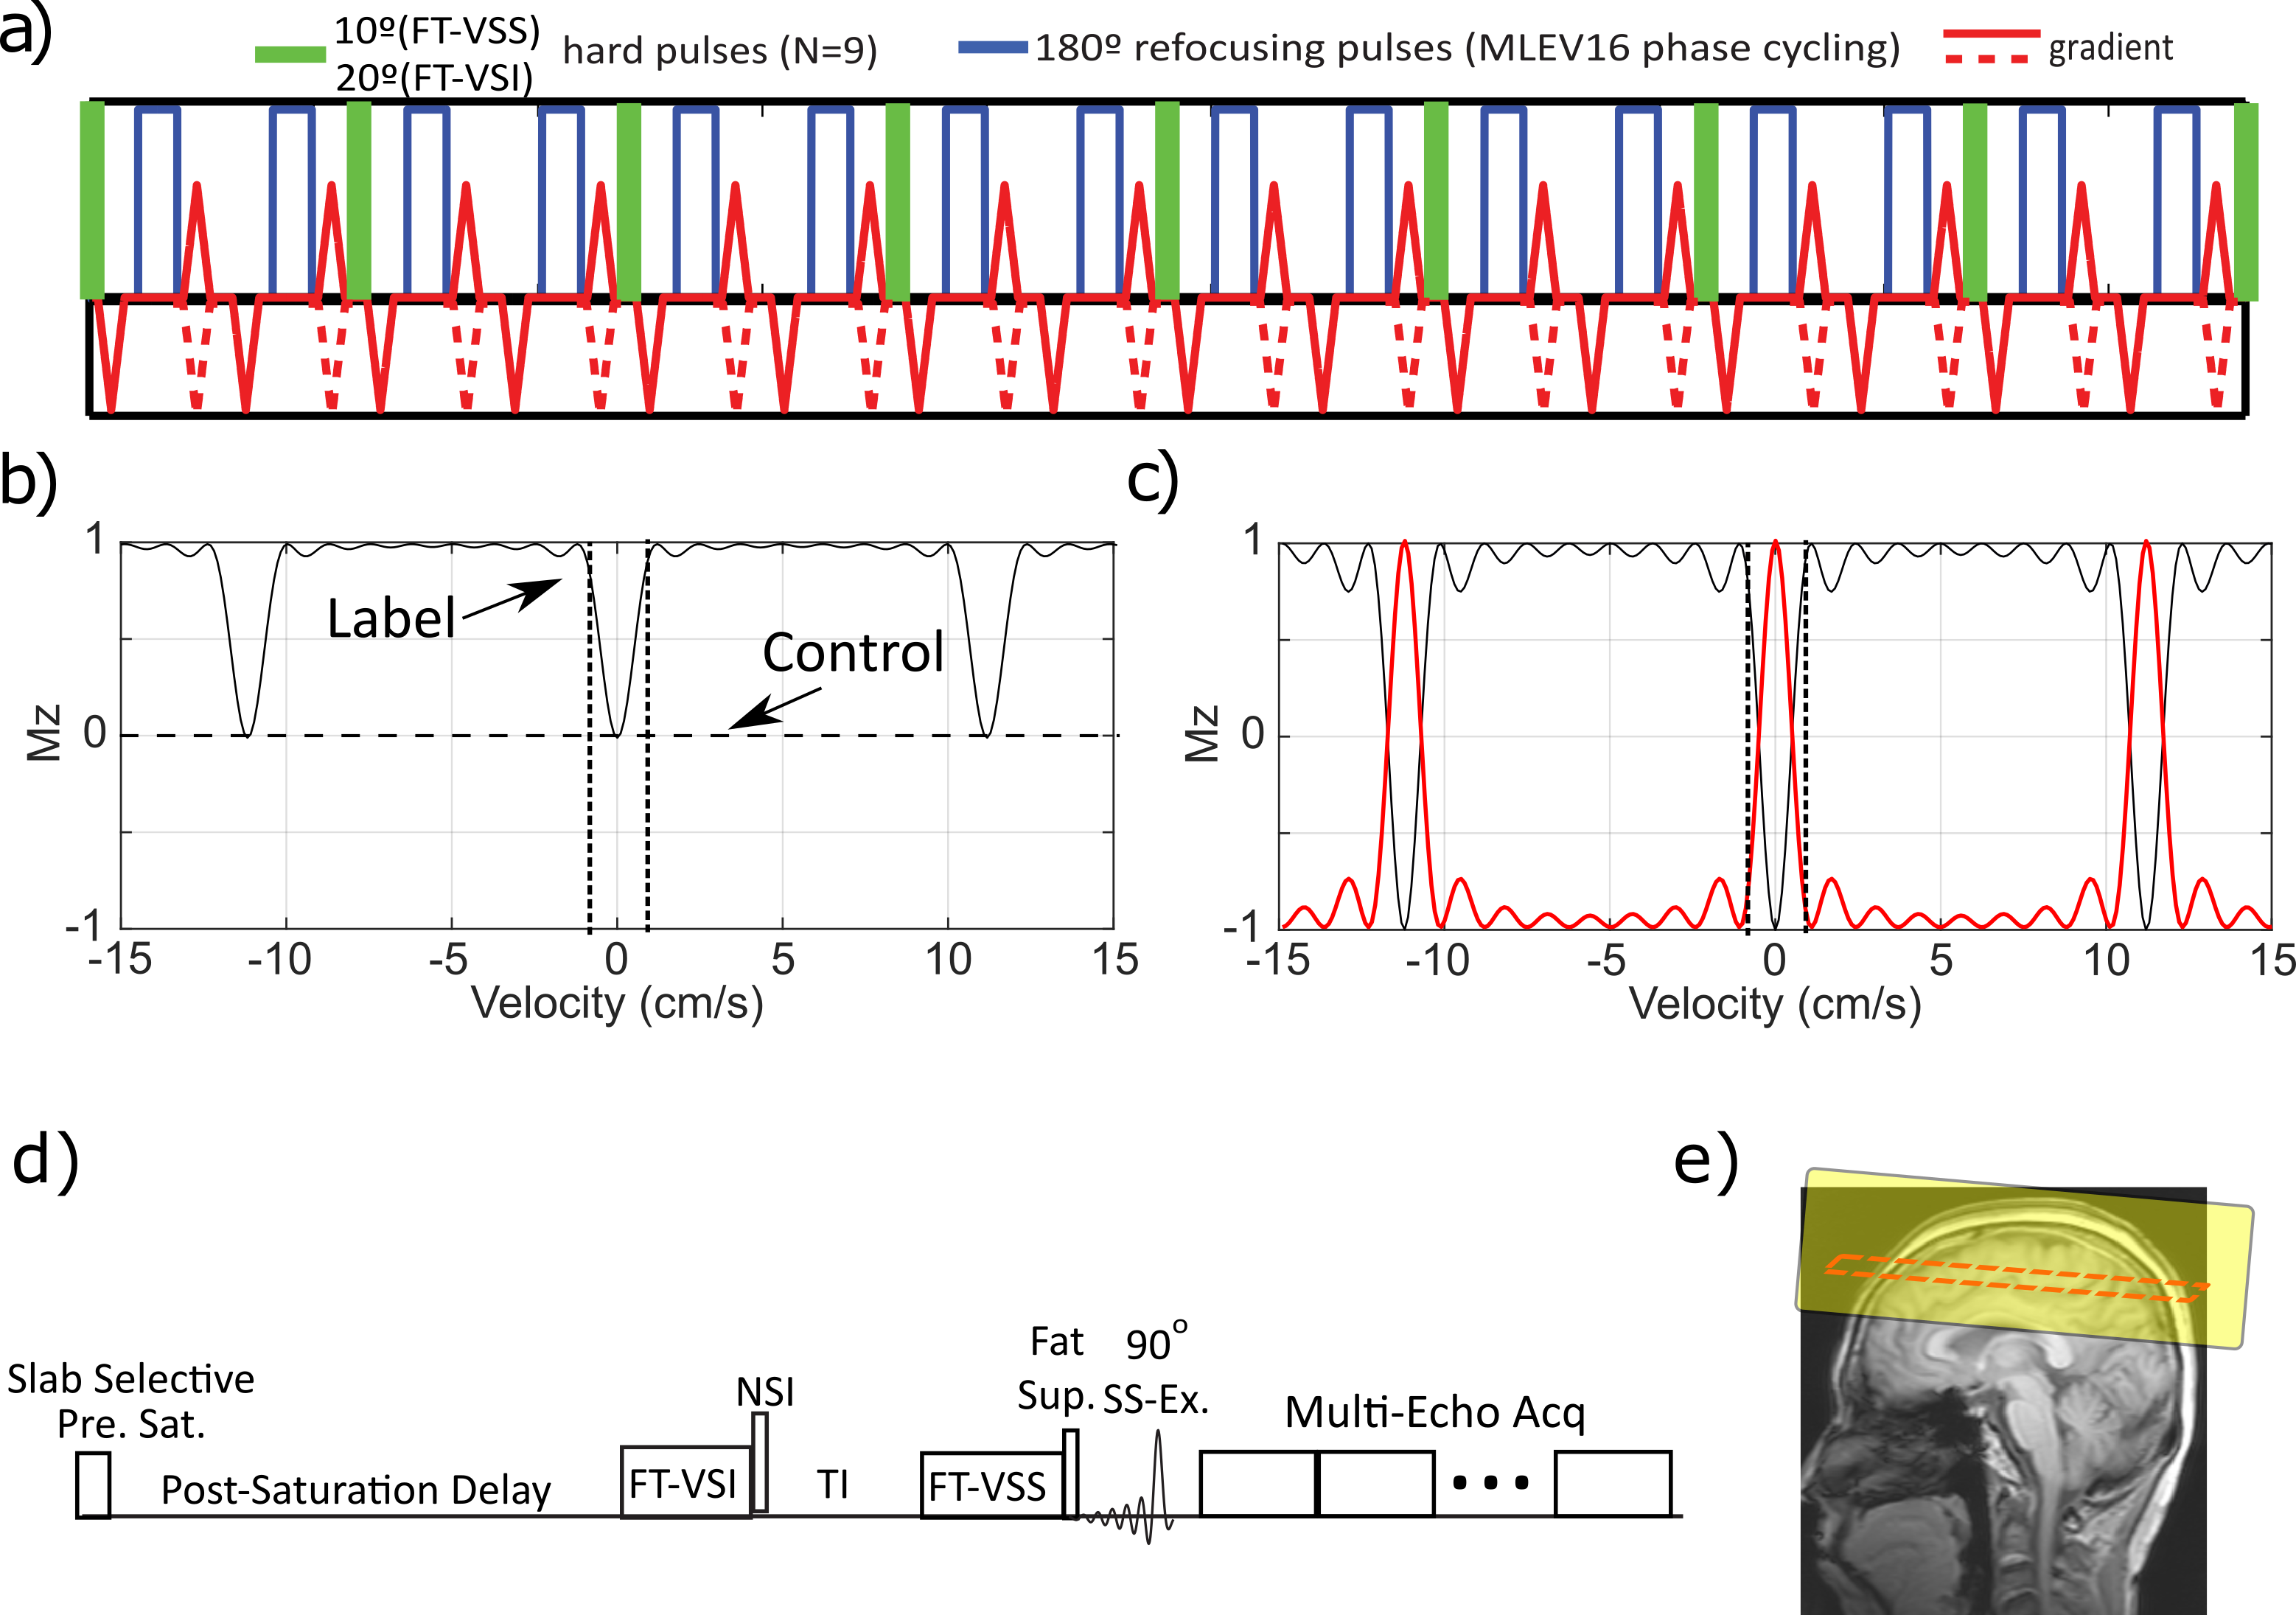
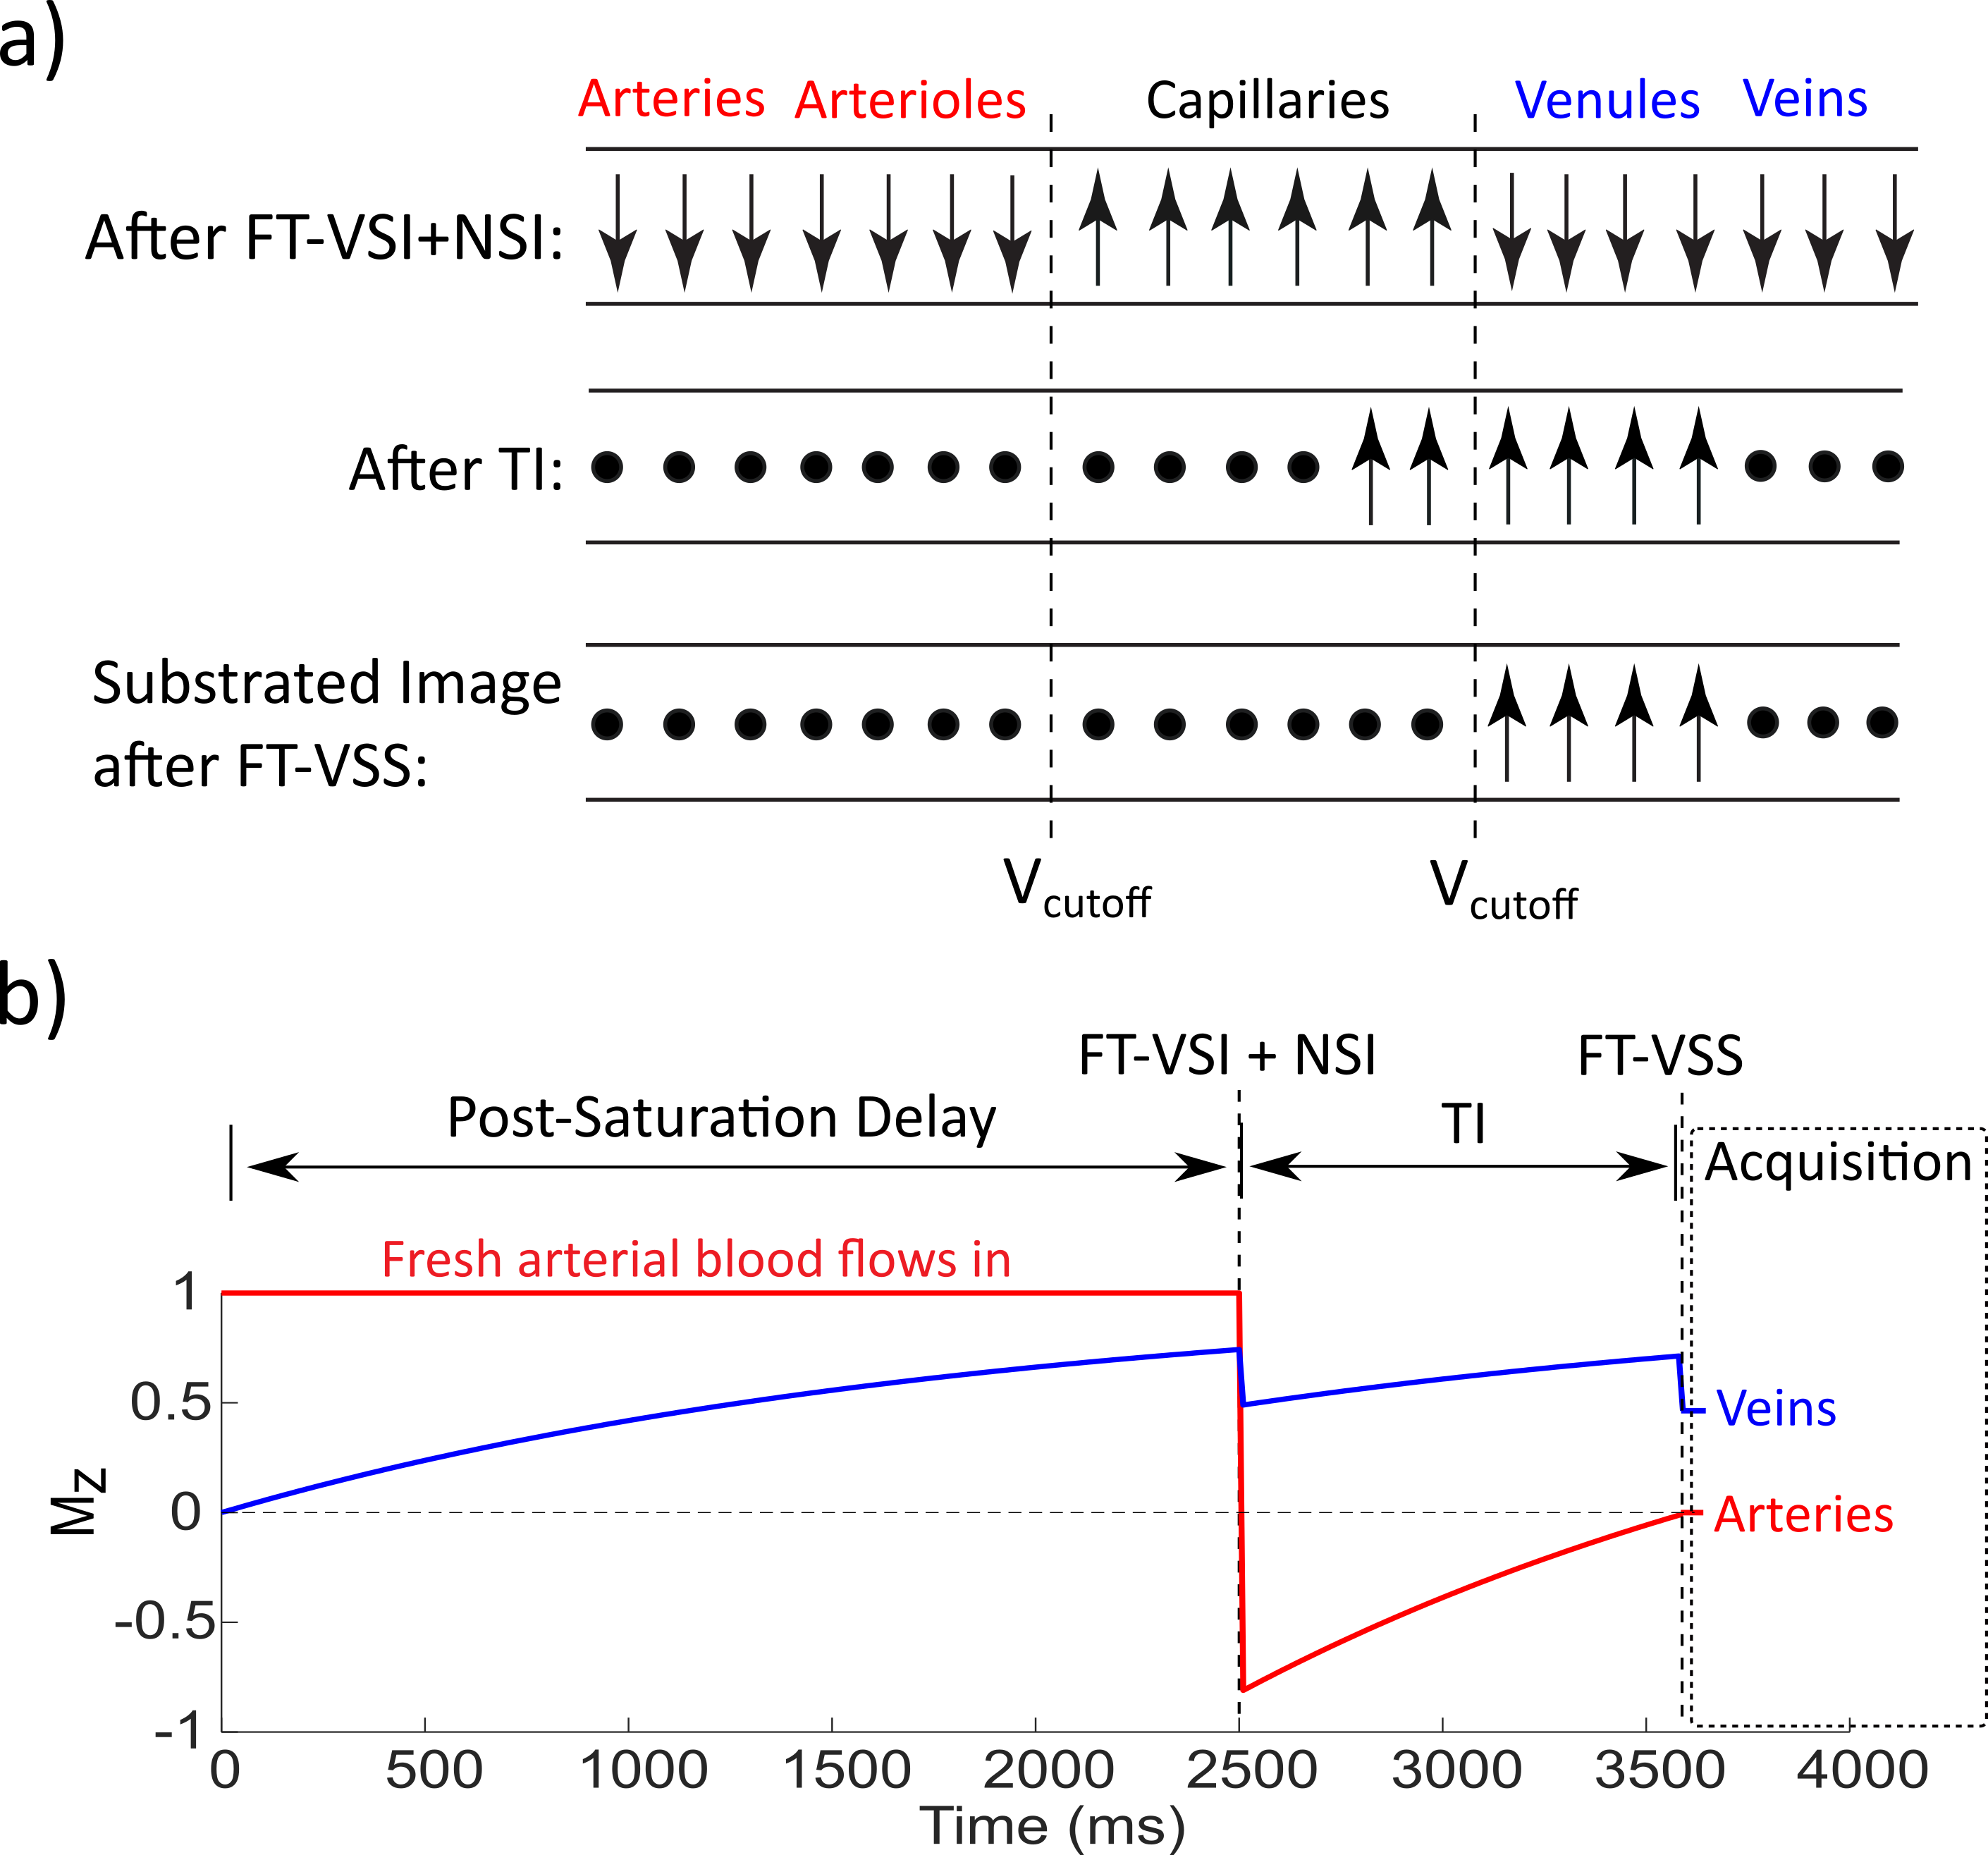
The FT-VS pulse trains (Fig. 1a) are composed of nine excitation pulses, interleaved with paired and phase-cycled refocusing pulses surrounded by gradients with alternating polarity7. The normalized Mz-velocity responses of FT-VSS and FT-VSI are displayed in Figs. 1b,c. The non-selective inversion (NSI) pulse applied immediately after FT-VSI flips the VSI profile such that the flowing spins within the passing band get inverted and the static spins within the inversion band are restored (Fig. 1c, red). Fig. 1d outlines the sequence diagram for estimating Yv. The ideal evolution of the microvascular signal through the preparation phase of this sequence is illustrated in Fig. 2. While the spins flowing above the VCUTOFF would be inverted and then get nulled at the end of TI, the spins moving below the VCUTOFF such as those within the capillaries, would largely flow out into the venules during TI with the preserved signal magnetization. After the subtraction of the results of FT-VSS control and labeling scans (VCUTOFF=0.7cm/s), only the spins within the venular compartment that accelerated above the VCUTOFF will be retained for imaging.Two healthy volunteers provided informed consent to the institutionally approved protocol. Experiments were conducted on using a 3T Philips Ingenia scanner with a 32-channel head coil reception. The imaging parameters were: 8mm slice thickness, FOV= 252×252mm2 with the acquisition resolution of 4.0×4.3mm2, SENSE factor of 2.3 for phase-encoding and TR of 4.5s. Two shots were used with an EPI factor of 13 to fill the k space along the phase-encoding direction with a phase-cycling of [0, π] applied on the excitation pulse. Twenty echoes were acquired with an echo spacing step of 14ms. Hyperbolic tangent pulses (4ms, frequency sweep of 11500Hz) were used in the acquisition for immunity to B0/B1 inhomogeneities. Eight dynamic scans were obtained with a total scan time of 5.2min. With the same FOV and resolution, double inversion recovery (DIR) was applied for visualizing gray matter (GM) and white matter (WM) only. CSF T2 was also measured by combining a 600ms T2prep, in order to suppress tissue signal8, and 32 echoes after the excitation with an echo spacing of 40ms. As a comparison, blood T1 and T2 were measured at the internal jugular vein (IJV)9,10 to quantify Hct and global Yv11,12.
To remove the effect of the residual CSF signal13, the image of the last echo (280ms), which has only CSF signal remaining, was subtracted from the image of the nth echo using the equation13
$$$SI_{n,corrected} = SI_{n} - e^{\frac{(20-n)\cdot14ms}{T_{2,CSF}}} \times SI_{20}$$$
The corrected images were resized to a 32×32 matrix (8mm resolution), and then smoothed with a 9mm FWHM Gaussian kernel1. The T2v map was obtained by fitting all 10 even echoes voxel-by-voxel using the mono-exponential decay function:
$$$S_{v} = S_{0} \times e^{-TE/T_{2v}}$$$
The obtained T2v map was converted to the Yv map using the previously developed T2-Y calibration model11 based on the Hct calculated from the measured blood T1v14. The standard error of the voxel-wise T2 fitting (T2error) was recorded as well, indicating the uncertainty of the fit. The two-parameter fitting also determined the scaling factor S0, which is proportional to the venous CBV. Lastly, the temporal SNR (tSNR) of the second echo through the remaining dynamics was also computed for each voxel.
Results
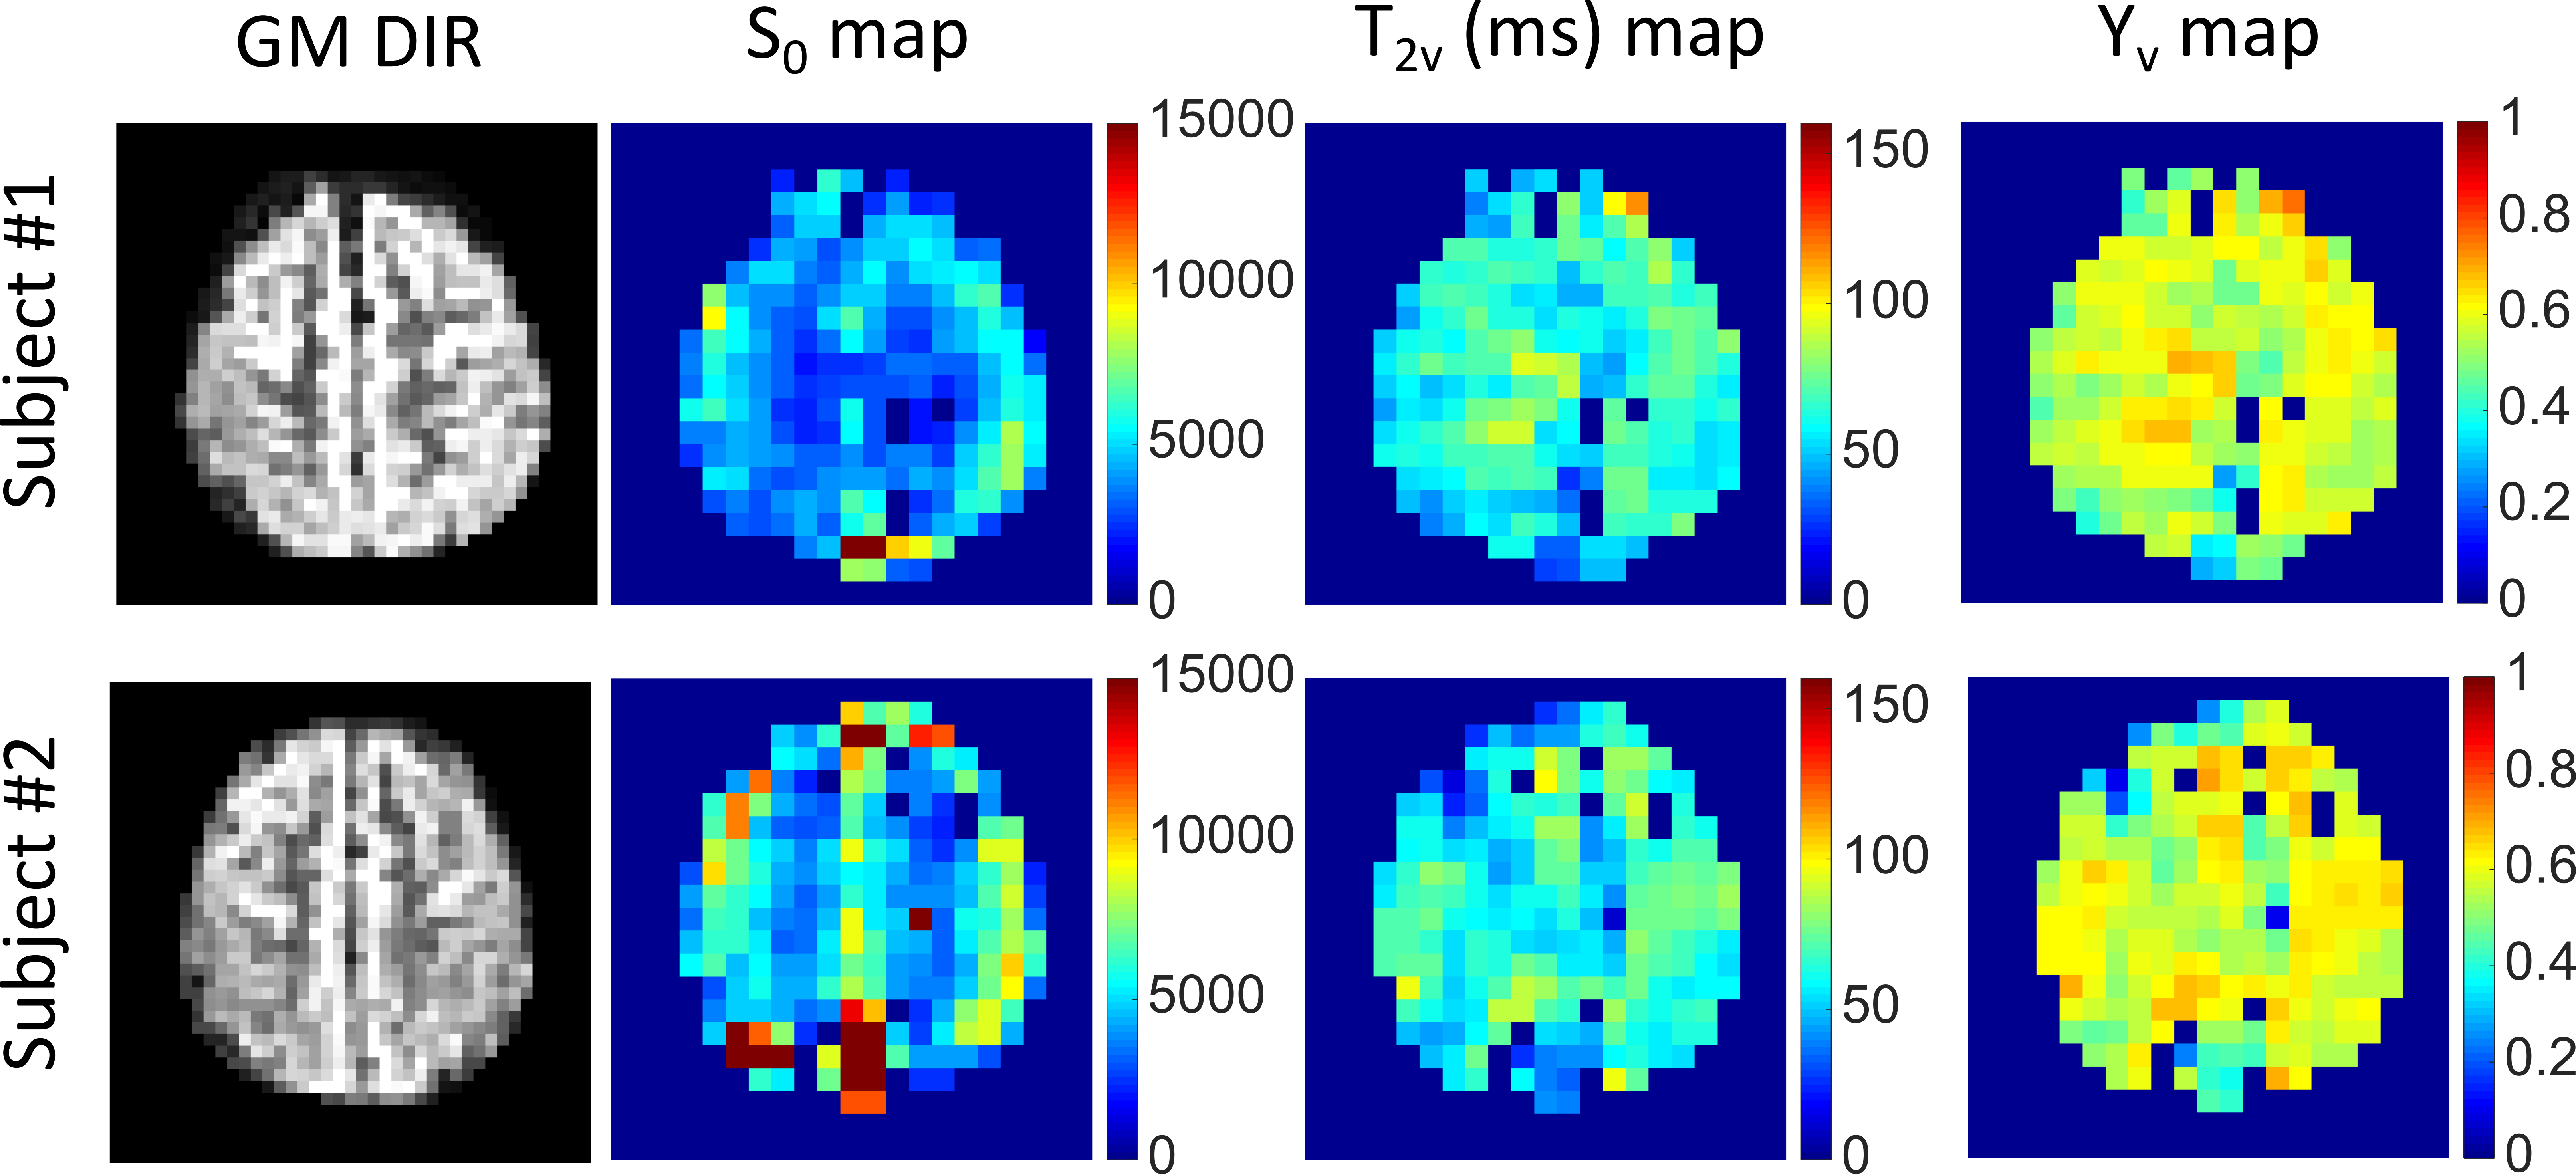
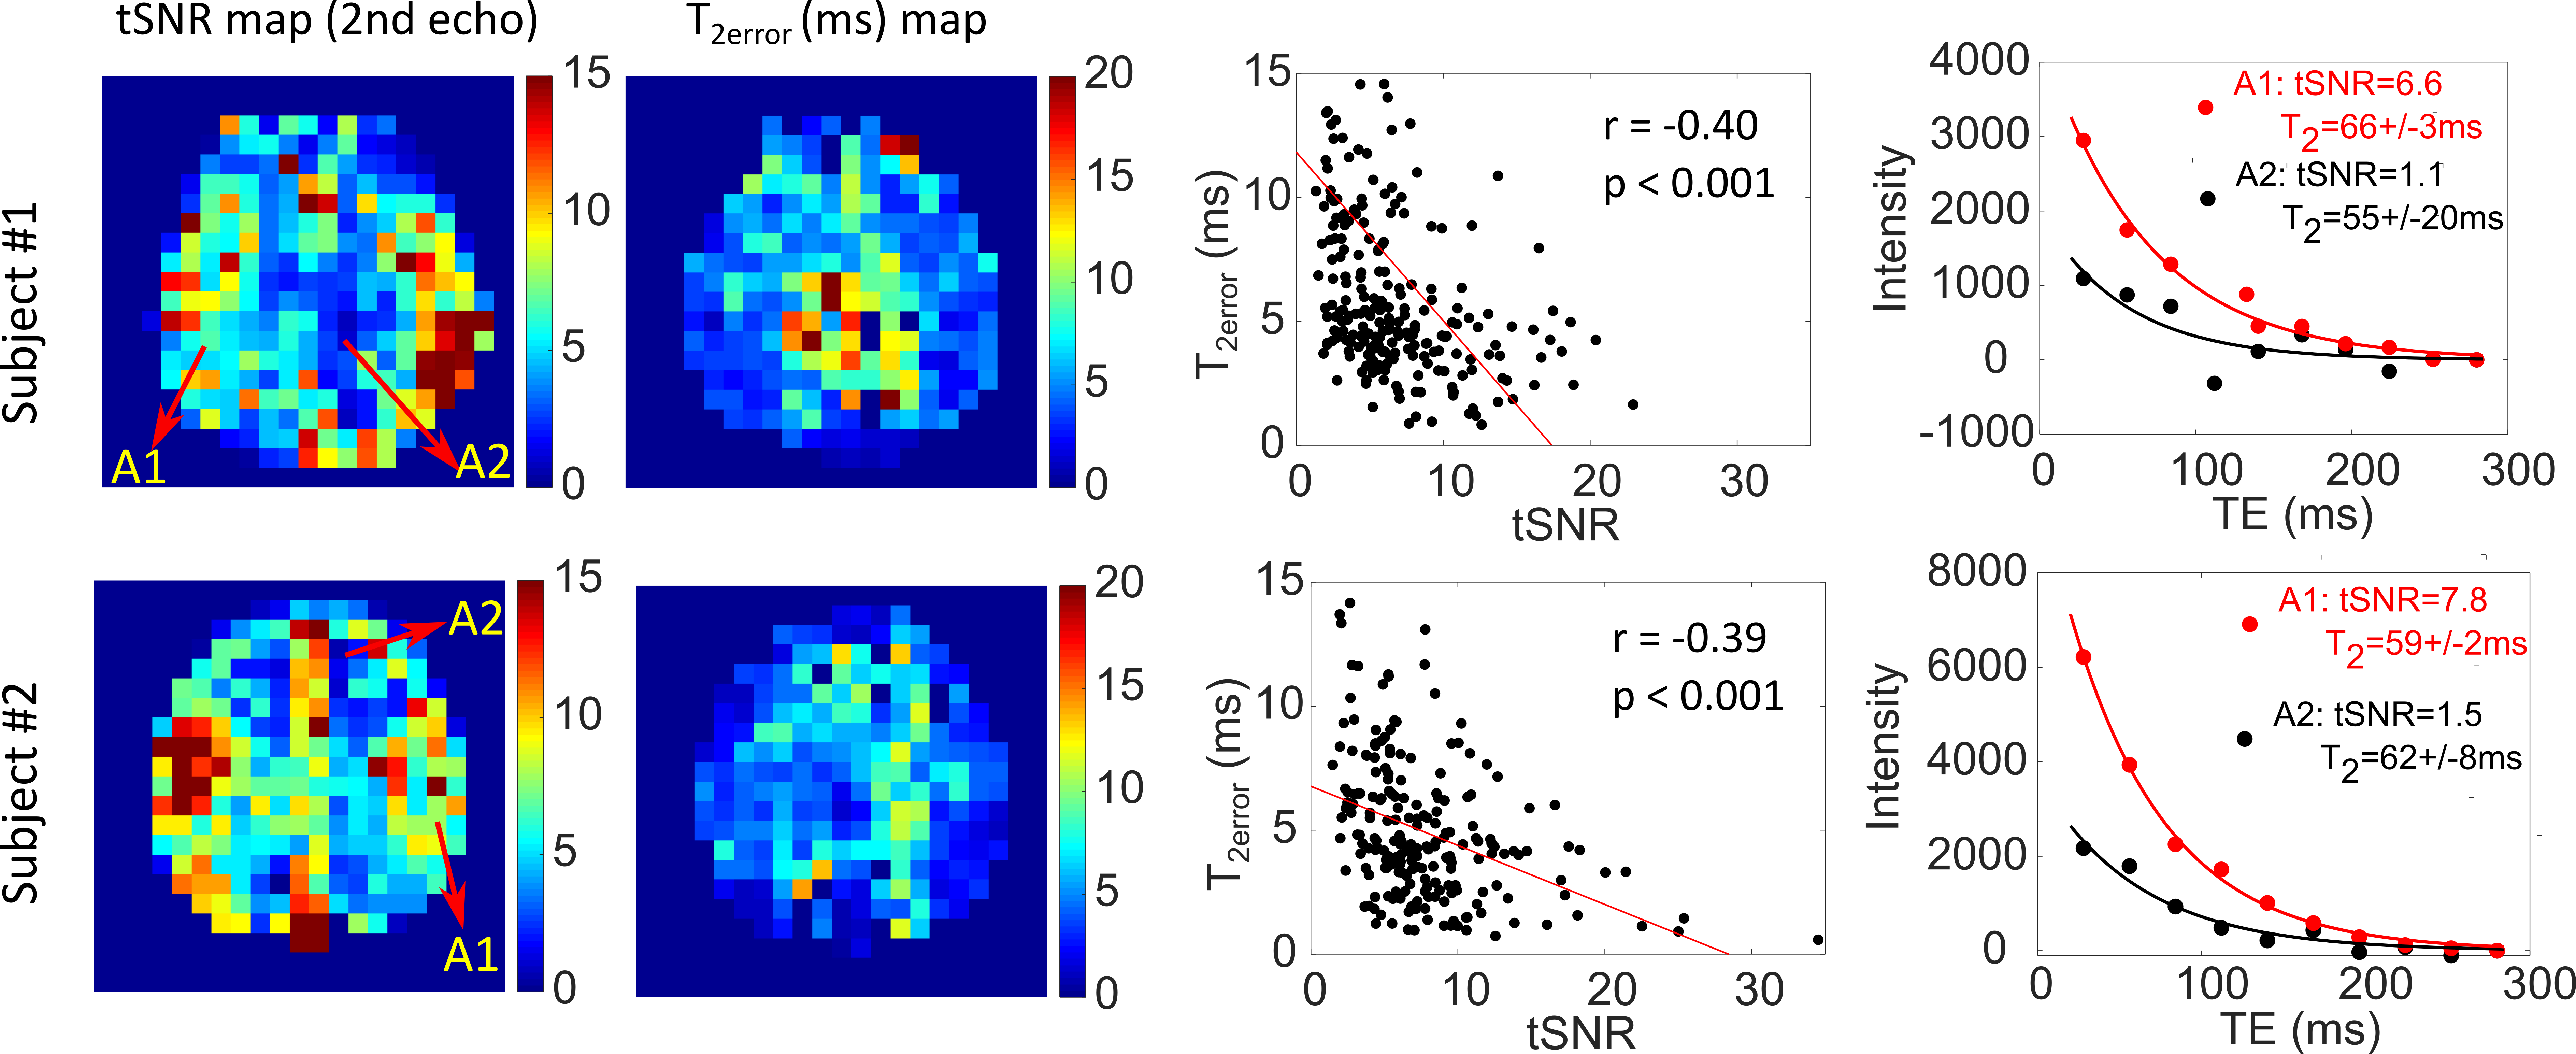
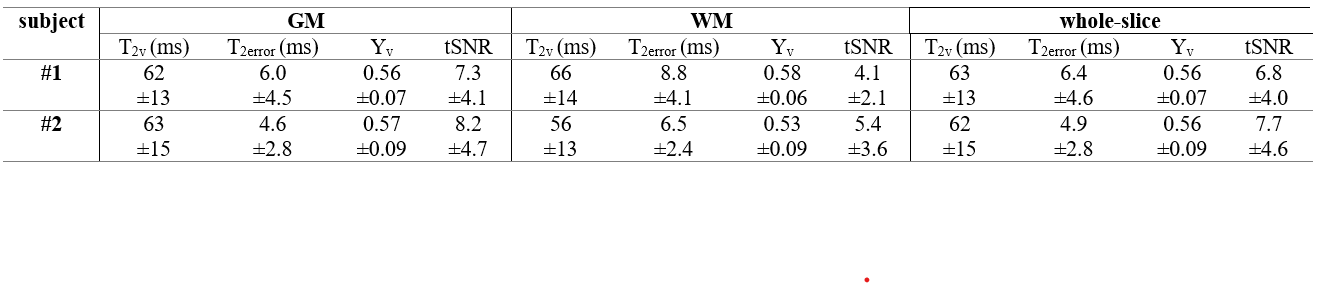
Fig. 3 shows the DIR GM, S0, T2v and Yv maps for the two subjects. As expected, based on CBV, the calculated S0 maps show higher signal in GM than in WM, which is consistent with the venous CBV contrast. Conversely, the fitted T2v maps and the corresponding Yv maps delineate a more uniform contrast between GM and WM (Table 1), as expected for brain OEF. The averaged Yv for the two subjects (Table 1) are 0.56±0.07 and 0.56±0.09, very close to their global Yv of 0.54 and 0.61, respectively.The maps of tSNR and T2error are shown in Fig. 4. Note that the voxels with lower tSNR and higher T2error values are mainly in the WM area in line with the lower blood volume. The T2error values are negatively correlated with tSNR (p<0.001). The T2v fitting plots from representative voxels with different tSNR are also compared.
Conclusion
Employing advanced velocity-selective pulse trains, a new venous oxygenation mapping technique is proposed with high venous signal and minimal sensitivity to arterial transit delay and CSF contamination. The measured venous oxygenation values are similar between GM and WM and comparable to the values measured globally.Acknowledgements
We thank Joseph Gillens, Terri Brawner, Ivanan Kusevic and Kathleen Kahl for their experimental assistance, and the funding support from NIH (P41 EB015909, NIH: K25 HL145129, NIH S10 OD021648, R01 HL138182, NIH: R01 HL144751)References
1. Bolar DS, Rosen BR, Sorensen AG, Adalsteinsson E. QUantitative Imaging of eXtraction of oxygen and TIssue consumption (QUIXOTIC) using venular-targeted velocity-selective spin labeling. Magn Reson Med. 2011;66(6):1550-1562.
2. Stout JN, Adalsteinsson E, Rosen BR, Bolar DS. Functional oxygen extraction fraction (OEF) imaging with turbo gradient spin echo QUIXOTIC (Turbo QUIXOTIC). Magn Reson Med. 2018;79(5):2713-2723.
3. Guo J, Wong EC. Venous oxygenation mapping using velocity-selective excitation and arterial nulling. Magn Reson Med. 2012;68(5):1458-1471.
4. Liu EY, Guo J, Simon AB, Haist F, Dubowitz DJ, Buxton RB. The potential for gas-free measurements of absolute oxygen metabolism during both baseline and activation states in the human brain. Neuroimage. 2020;207:116342.
5. Li W, van Zijl P, Qin Q. Venular Cerebral Blood Volume (vCBV) Mapping Using Fourier-Transform Based Velocity-Selective Pulse Trains. Proc Intl Soc Mag Reson Med. 2020;28:1110.
6. Qin Q, Qu Y, Li W, Liu D, Shin T, Zhao Y, Lin DD, van Zijl PCM, Wen Z. Cerebral blood volume mapping using Fourier-transform–based velocity-selective saturation pulse trains. Magn Reson Med. 2019;81:3544.
7. Qin Q, van Zijl PCMM. Velocity-selective-inversion prepared arterial spin labeling. Magn Reson Med. 2016;76(4):1136-1148.
8. Qin Q. A simple approach for three-dimensional mapping of baseline cerebrospinal fluid volume fraction. Magn Reson Med. 2011;65(2):385-391.
9. Qin Q, Grgac K, van Zijl PCM. Determination of whole-brain oxygen extraction fractions by fast measurement of blood T(2) in the jugular vein. Magn Reson Med. 2011;65(2):471-479.
10. Qin Q, Strouse JJ, van Zijl PCM. Fast measurement of blood T1 in the human jugular vein at 3 Tesla. Magn Reson Med. 2011;65(5):1297-1304.
11. Li W, van Zijl PCM. Quantitative theory for the transverse relaxation time of blood water. NMR Biomed. 2020;33:4207.
12. Li W, Grgac K, Huang A, Yadav N, Qin Q, van Zijl PCMM. Quantitative theory for the longitudinal relaxation time of blood water. Magn Reson Med. 2016;76(1):270-281.
13. Guo J, Wong EC. Removal of CSF contamination in VSASL and QUIXOTIC using a long TE CSF Scan. Proc 19th Annu Meet ISMRM. 2011:2116.
14. Xu F, Li W, Liu P, Hua J, Strouse JJ, Pekar JJ, Lu H, van Zijl PCM, Qin Q. Accounting for the role of hematocrit in between-subject variations of MRI-derived baseline cerebral hemodynamic parameters and functional BOLD responses. Hum Brain Mapp. 2018;39:344.
Figures