0470
Quantification of blood-brain barrier water permeability and arterial blood volume with multi-slice multi-delay diffusion-weighted ASL1Department of Bio and Brain Engineering, Korea Advnaced Institute of Science and Technology, Daejeon, Korea, Republic of, 2Department of Biomedical Engineering, Sungkyunkwan University, Suwon, Korea, Republic of, 3Department of Radiology, Seoul National University Hospital, Seoul, Korea, Republic of
Synopsis
Measurement of changes in blood-brain barrier permeability is important for early diagnosis of brain diseases. In this study, we propose multi-slice multi-delay diffusion-weighted arterial spin labeling for simultaneous acquisition of various quantitative perfusion estimates including the water exchange rate and the permeability surface area product, which are known to be closely related to BBB permeability, and blood perfusion and arterial blood volume. The water exchange rate in 4 Alzheimer patients were smaller than that in 6 normal subjects, opposed to common knowledges on BBB permeability. The proposed approach may work as a new biomarker for early diagnosis of Alzheimer disease.
Introduction
Blood-brain barrier (BBB) is a semi-permeable barrier wrapping around the brain micro-vasculatures. BBB prevents free exchange of solutes between blood and brain tissue. BBB permeability is an important indicator of the BBB function. Conventionally, methods using exogenous tracers such as PET or DCE-MRI are preferred for measuring BBB permeability. However, those methods have either limited access or potential risk of nephropathy. Also, common gadolinium-based contrast agents have a large molecular weight, so cannot be used to measure the subtle changes in BBB. For these reasons, arterial spin labeling (ASL) methods have been tried to measure the BBB water permeability noninvasively [1-4].Diffusion-weighted ASL (DWASL) acquires two sets of images with and without diffusion-weighting gradients. DWASL is based on the two compartment model composed of the tissue and capillary compartments, where water molecules can exchange across the BBB with a finite exchange rate [1]. While the ASL signals without diffusion gradients are from both capillary and tissue compartments, the capillary compartment is selectively suppressed using the diffusion gradients because of its relatively fast movement. However, the arterial compartment, which is in transit phase to the tissue/capillary exchange sites, is not considered in the two compartments model.
In this study, perfusion images with and without diffusion gradients were obtained using pseudo-continuous ASL (pCASL) with 2D multi-slice gradient-echo EPI readout. By permuting the slice acquisition order in each set, dynamic perfusion-weighted images were acquired at multiple time-points. Four-phase perfusion kinetic model [5] was used for analysis, and quantitative perfusion measurements including water permeability ($$$k_w$$$, PS), cerebral blood flow (CBF), arterial transit time (ATT), and arterial blood volume (aBV) were quantified and compared in patients and normal subjects.
Methods
ModelSchematic representation of four-phase perfusion kinetic model is shown in Fig.1. Here are numerical equations describing perfusion compartments of pCASL at each time phase.
(1) Transit Phase ($$$t<t_A$$$)$$ΔM(t)=0{\cdots}Eq.(1)$$
Before $$$t_A$$$, no signal contributes to the $$$ΔM$$$.
(2) Arterial Phase ($$${t_A}<t<t_{ex}+{t_A}$$$)$$ΔM(t)=Δ{M_a}(t)={{2α{M_0}{\cdot}CBF}\over{λ}}\cdot{T_{1a}}[{e}^{-R_{1a}max(t-τ,{t_A})}-{e}^{-{R_{1a}t}}]{\cdots}Eq.(2)$$
Arterial phase is the time for labeled water to reach the water exchange region. It was assumed that water exchange does not occur until the labeled blood enters the capillary bed.
(3) Arterial-Capillary Transitional Phase ($$$t_{ex}+{t_A}<t$$$)$$Δ{M_a}(t)={{2α{M_0}{\cdot}CBF}\over{λ}}\cdot{T_{1a}}[{e}^{-R_{1a}max(t-τ,{t_A})}-{e}^{-{R_{1a}T_{ex}}}]{\cdots}Eq.(3)$$$$Δ{M_c}(t)={{2α{M_0}{\cdot}CBF}\over{λ}}\cdot{{e^{-(R_{1a}+k_w)max(T_{ex},t-τ)}-e^{-(R_{1a}+k_w)t}}\over{R_{1a}+k_w}}{\cdots}Eq.(4)$$$$Δ{M_t}(t)={{2α{M_0}{\cdot}CBF}\over{λ}}\cdot{k_we^{-R_{1b}t}\over{R_{1a}+k_w-R_{1b}}}[e^{(-R_{1a}-k_w+R_{1b})max(T_{ex},t-τ)}-e^{(-R_{1a}+k_w)t}]{\cdots}Eq.(5)$$
Water exchange between capillary and tissue compartments occurs when labeled water enters the capillary bed. Based on the fact that the tissue blood volume is much larger than capillary, no re-entering of water from the tissue to the capillary compartment was assumed.
(4) Capillary Phase
After all the labeled water has entered the capillary bed for exchange, signals from tissue/capillary compartments contribute to the perfusion signal. The mean transit time of blood in the capillary bed is known to be large enough for the inverted longitudinal magnetization to be fully relaxed, so outflow into the vein was not considered.
Data Acquisition
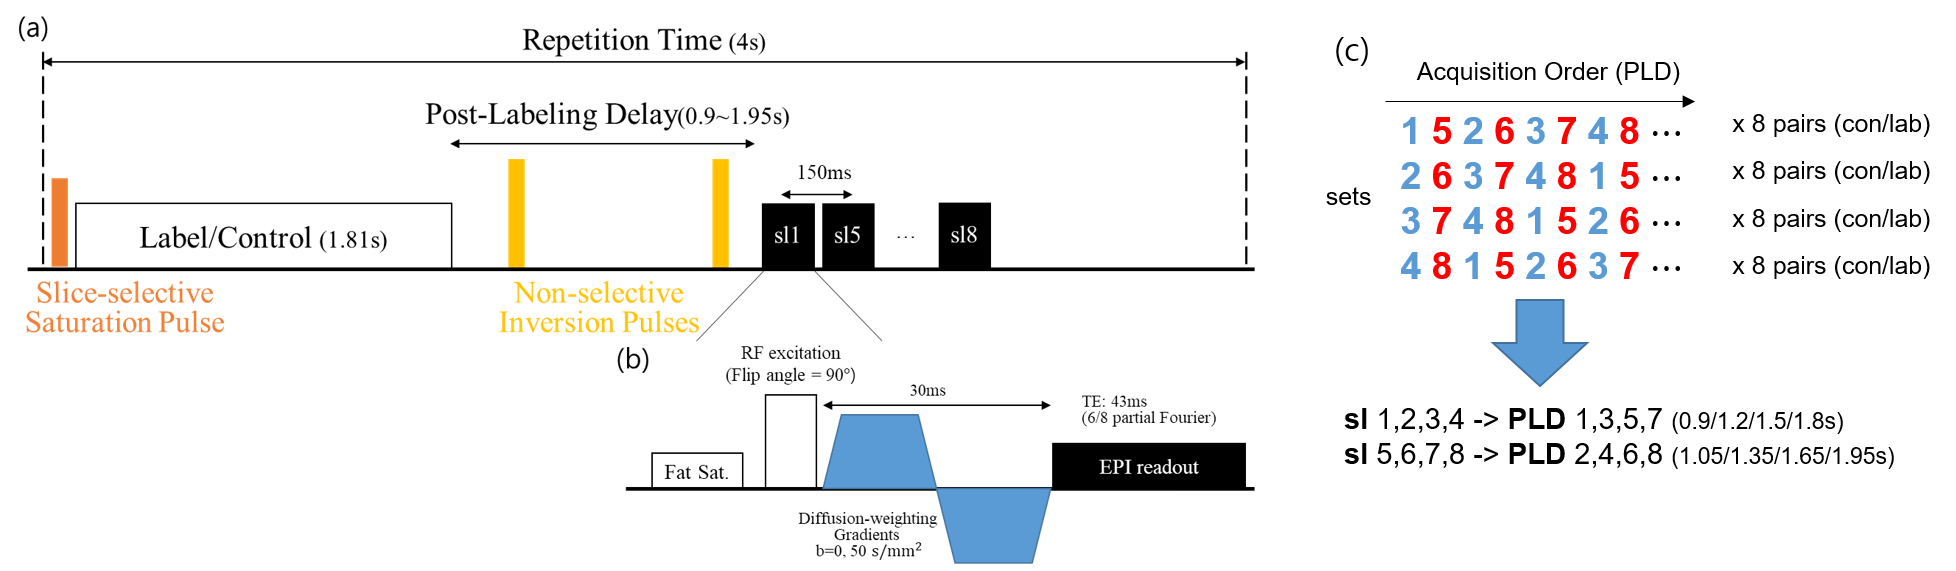
The sequence diagram and the proposed permuting slice acquisition order is shown in Fig. 2. Eight slices were obtained in 4 sets by permuting their acquisition order in each set, which was repeated for acquisition of 8 control/label pairs. The scan was repeated twice with and without diffusion gradients (b=50 s/mm2). For the CBF quantification, $$$M_0$$$ was obtained in ascending order. Total scan time was 11min.
Normal subjects (24.2±1.8Y, N=6, 3F) and patients with Alzheimer disease (75.5±4.2Y, N=4, 3F) were examined on a 3T MRI scanner (Skyra, Siemens Healthcare, Erlangen, Germany).
Analysis
$$$t_A$$$ and $$$T_{ex}$$$ were calculated by fitting acquired dynamic images of b=0 and 50 s/mm2 to Eq.(6), respectively. $$$T_{ex}$$$ in pixels with $$$<t_A$$$ were assumed to be $$$<t_A$$$. Using calculated arrival times, images were analyzed using Eq.(1)-(5). Bi-exponential model[1] was adopted to analyze the diffusion-weighted ASL images. Diffusion weighting with b=50 s/mm2 was assumed to be sufficient to suppress the perfusion signal in the arterial and capillary compartments[1]. Finally, $$$k_w$$$ was estimated pixel-by-pixel based on least square errors in Eq.(6)[10].
$${{ΔM_{b50}(t)}\over{ΔM_{b0}(t)}}={{ΔM_t{(t,k_w)}}\over{ΔM_a(t)+ΔM_c(t,k_w)+ΔM_t(t,k_w)}}{\cdots}Eq.(7)$$
aBV and PS were obtained through the equations in Table.1. Gaussian filters with FWHM of 3mm, 5mm, and 10mm were applied to the acquired images, CBF&ATT maps, and $$$k_w$$$ maps, respectively. For statistical analysis, the Wilcoxon signed rank test was used to compare quantitative perfusion measurements of patients with those of normal subjects.
Results and Discussion
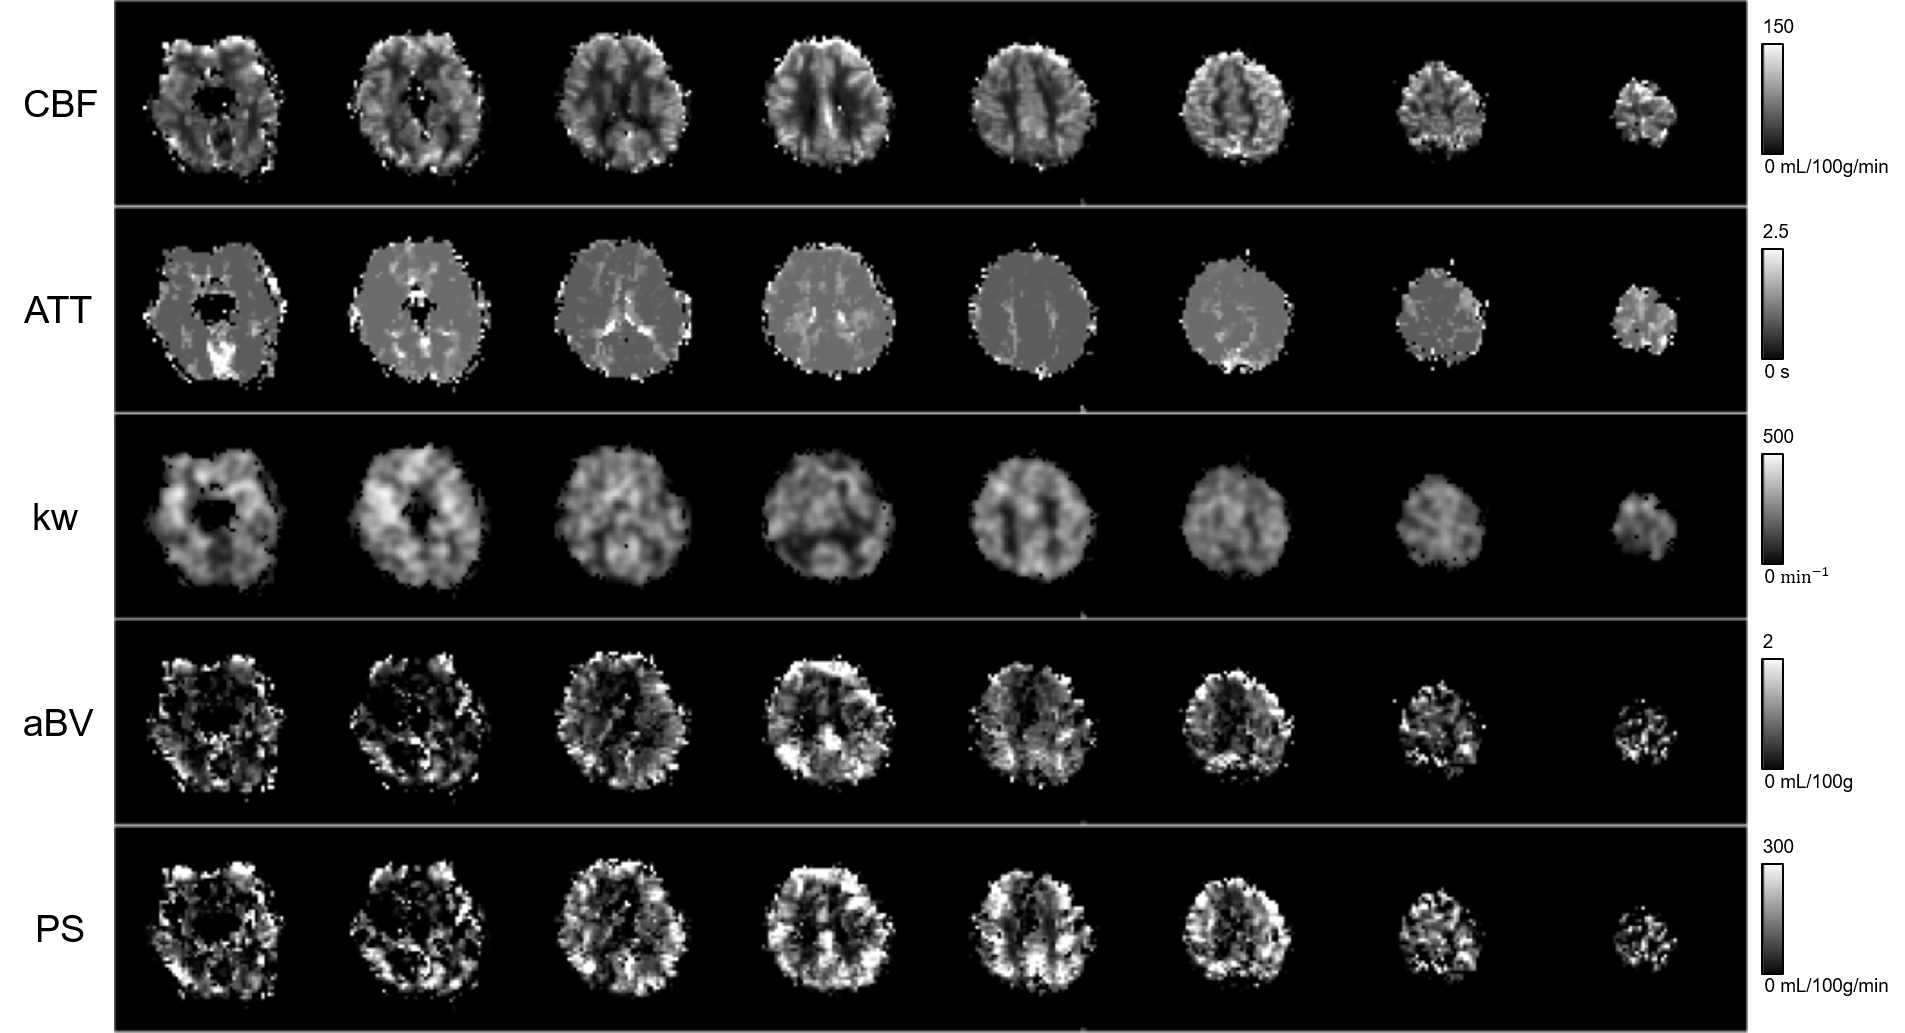
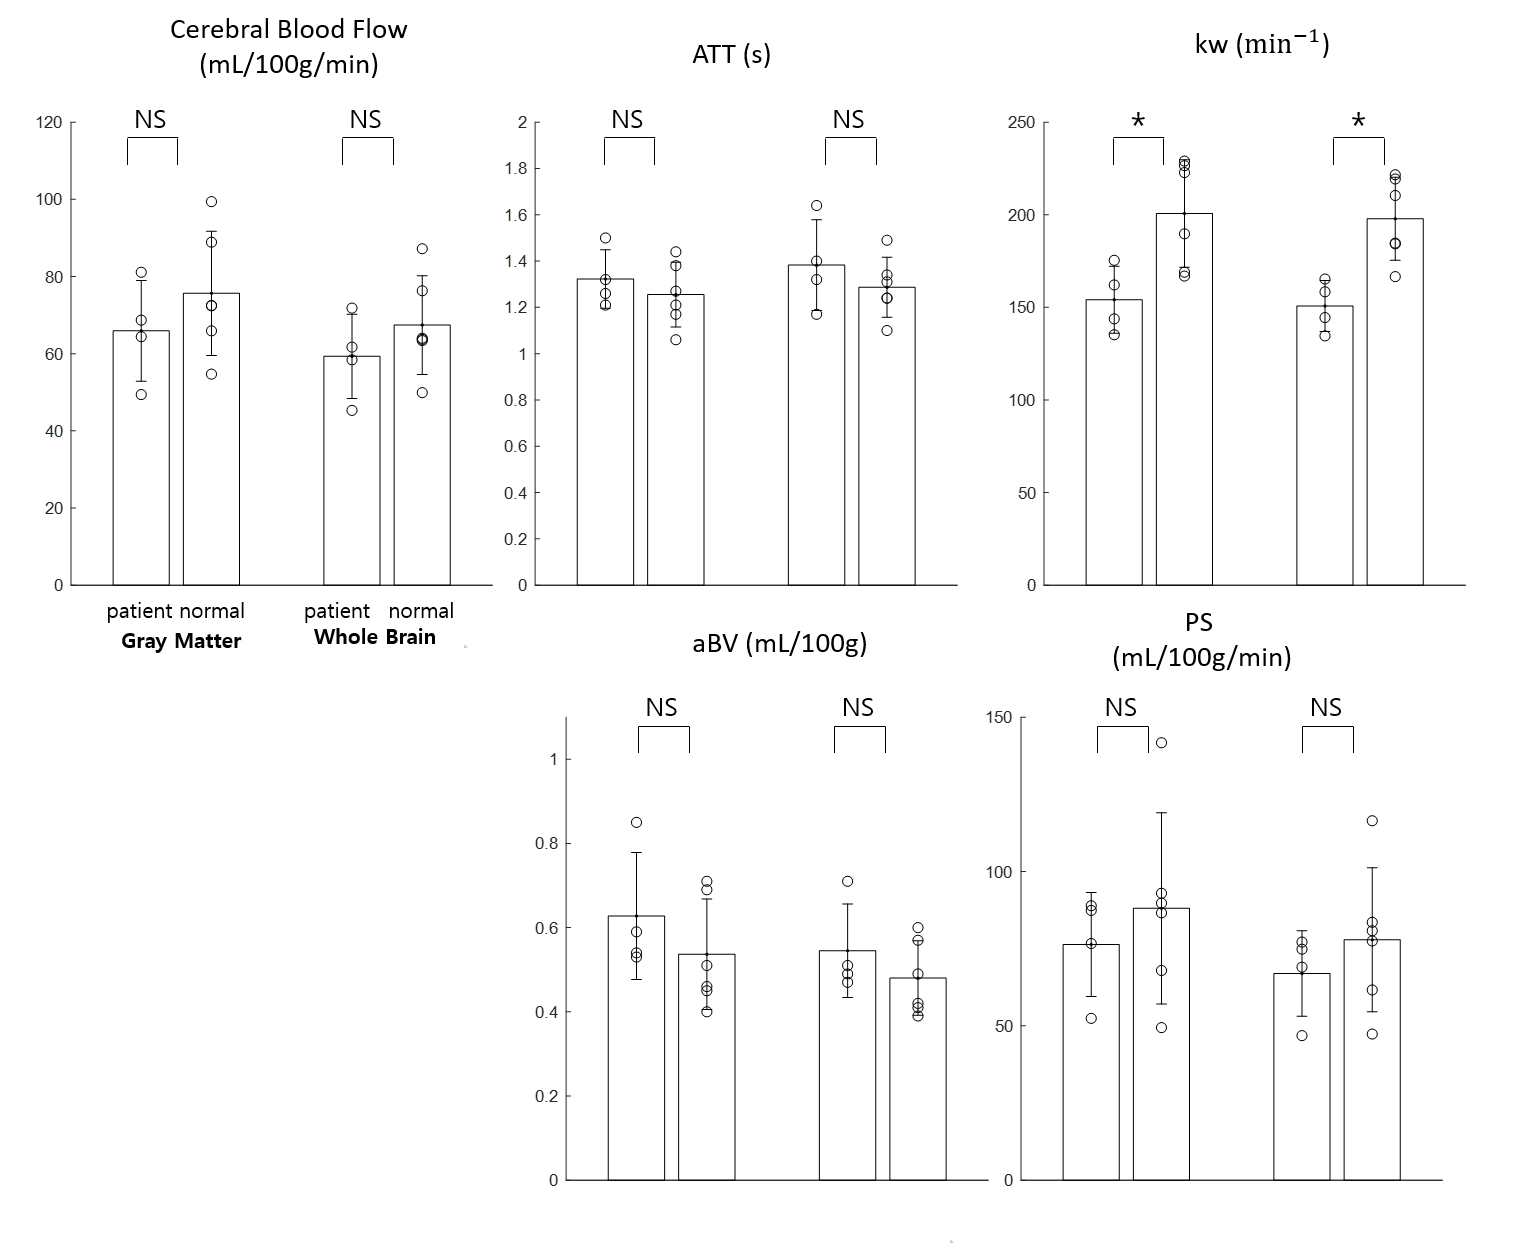
In addition to $$$k_w$$$, PS could be quantified through aBV in this study, which has been difficult in the previous DWASL studies. In general, quantitative perfusion maps (CBF, ATT, $$$k_w$$$, aBV, and PS) were successfully estimated, but edges were erroneous in CBF, aBV, and PS (Fig.3). No significant differences in CBF, ATT, aBV and PS were observed between patients and normal subjects (Fig.4). Only $$$k_w$$$ was significantly lower in patients, opposed to the common knowledge that it increases with aging and diseases [6, 7]. aBV values were smaller than previous studies [8, 9], however by excluding the voxels with $$$T_{ex}<t_A$$$, the estimate became comparable.Conclusion
We demonstrated that the proposed multi-slice multi-delay DWASL enables us to quantify perfusion measures including CBF, ATT, $$$k_w$$$, aBV, and PS. Further ROI analysis and clinical interpretation of acquired maps will be necessary to verify validity and clinical utility of the proposed method for detection of BBB dysfunction.Acknowledgements
No acknowledgement found.References
[1] St. Lawrence, K.S., D. Owen, and D.J. Wang, A two‐stage approach for measuring vascular water exchange and arterial transit time by diffusion‐weighted perfusion MRI. Magnetic Resonance in Medicine, 2012. 67(5): p. 1275-1284.
[2] Lin, Z., et al., Non‐contrast MR imaging of blood‐brain barrier permeability to water. Magnetic resonance in medicine, 2018.
[3] Hales, P.W. and C.A. Clark, Combined arterial spin labeling and diffusion-weighted imaging for noninvasive estimation of capillary volume fraction and permeability-surface product in the human brain. Journal of Cerebral Blood Flow & Metabolism, 2013. 33(1): p. 67-75.
[4] Gregori, J., et al., T2‐based arterial spin labeling measurements of blood to tissue water transfer in human brain. Journal of magnetic resonance imaging, 2013. 37(2): p. 332-342.
[5] Li, K.l., et al., Four‐phase single‐capillary stepwise model for kinetics in arterial spin labeling MRI. Magnetic Resonance in Medicine: An Official Journal of the International Society for Magnetic Resonance in Medicine, 2005. 53(3): p. 511-518.
[6] Montagne, A., et al., Blood-brain barrier breakdown in the aging human hippocampus. Neuron, 2015. 85(2): p. 296-302.
[7] Farrall, A.J. and J.M. Wardlaw, Blood–brain barrier: ageing and microvascular disease–systematic review and meta-analysis. Neurobiology of aging, 2009. 30(3): p. 337-352.
[8] Liu, P., J. Uh, and H. Lu, Determination of spin compartment in arterial spin labeling MRI. Magnetic resonance in medicine, 2011. 65(1): p. 120-127.
[9] Petersen, E.T., T. Lim, and X. Golay, Model‐free arterial spin labeling quantification approach for perfusion MRI. Magnetic Resonance in Medicine: An Official Journal of the International Society for Magnetic Resonance in Medicine, 2006. 55(2): p. 219-232.
Figures