0467
Layer-dependent 7T ASL reveals sensory input and motor output perfusion activity in human primary motor cortex1Laboratory of FMRI Technology (LOFT), Mark & Mary Stevens Neuroimaging and Informatics Institute, Keck School of Medicine, University of Southern California, Los Angeles, CA, United States, 2State Key Laboratory of Brain and Cognitive Science, Beijing MRI Center for Brain Research, Institute of Biophysics, Chinese Academy of Sciences, Beijing, China, 3Department of Neurology, University of Southern California, Los Angeles, CA, United States
Synopsis
High-resolution (iso-1mm) 7T ASL scans were performed on the primary motor cortex (M1) to characterize layer-dependent resting CBF, and perfusion activity to sensory input/motor output. Finger tapping (FT)-induced CBF increase shows a clear ‘double-peak’ pattern, consistent with the hypothesis that FT engaged neural activity of somatosensory input in the superficial layers and motor output in the deep layers. Finger brushing (FB)-induced CBF increase was overall smaller, and mainly peaked in superficial layers (somatosensory input and minimal motor output). These results demonstrate the high spatial specificity of 7T ASL, capable of resolving layer-dependent input and output activity in human M1.
Background
Neuronal activity in the brain is associated with an increased metabolic demand which is accompanied by changes in cerebral blood flow (CBF). BOLD fMRI has high sensitivity but limited spatial specificity related to the site of neuronal activation due to contamination by pial veins. Perfusion fMRI using arterial spin labeling (ASL) offers higher spatial specificity as well as quantitative CBF during both rest and task conditions, however its sensitivity is lower compared to BOLD and/or VASO [1]. At ultra-high field, ASL has the dual benefits of long tracer half-life determined by blood T1 [2] and high SNR [3]. The feasibility of cortical layer-dependent perfusion imaging has been demonstrated using 7T ASL [4]. In this study, high-resolution (1mm isotropic) multi-delay resting-state and functional activation 7T ASL scans were performed on the primary motor cortex (M1) to characterize layer-dependent resting CBF, and perfusion activity to sensory input and motor output.Method
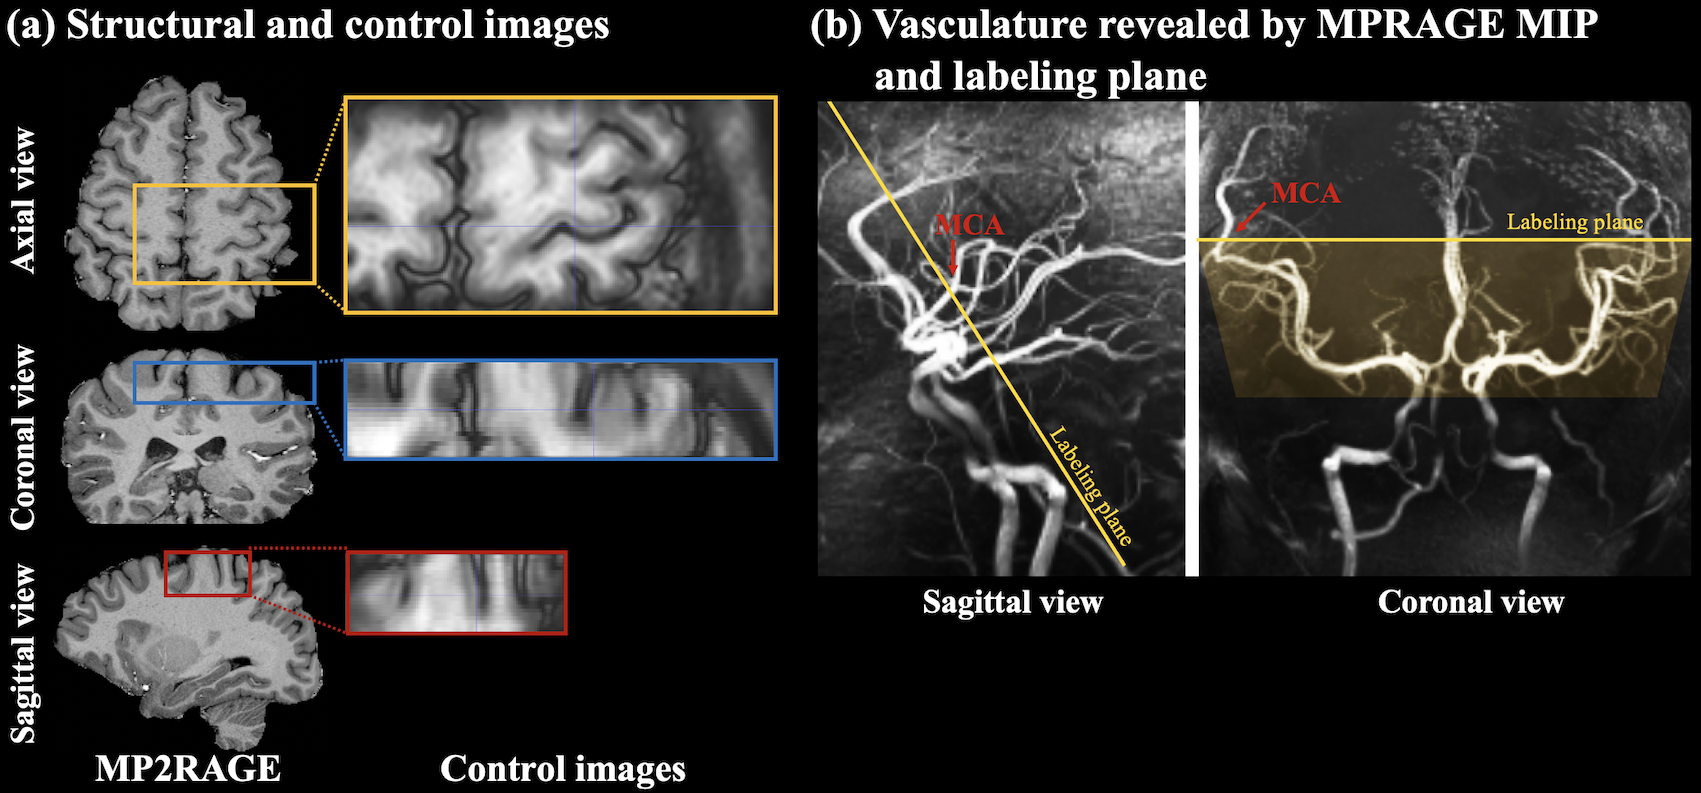
Five subjects (3male, age=26.4±0.9years) underwent MRI scans on a Siemens Terra 7T scanner with a NOVA 1Tx/32Rx head coil. Gradient-and-spin-echo (GRASE) readout with inner-volume excitation was used to acquire a zoomed imaging volume covering the motor cortex of the dominant-hand (Fig.1(a)). Intracranial vasculature was revealed by maximal-intensity-projection (MIP) of the MP2RAGE (0.7mm3) images, and pseudo-continuous ASL (pCASL) labeling plane was placed above the circle of Willis (CoW) and perpendicular to the M3 branch of middle cerebral artery (MCA) (Fig.1(b)). This labeling location took advantage of the higher B1 and more homogeneous B0 field around the center of the brain.Imaging parameters were: FOV=100×50mm2, 24 slices (30% oversampling, 6/8 partial Fourier), 1-mm isotropic resolution, 2/3 segments along phase/partition direction, TE=26.78ms, echo train length=214.2ms, labeling duration=1280ms, TR=2800ms. Flow velocity and B1 at labeled MCA were 18.4±4.0cm/s (ECG-gated phase-contrast MRI) and 74.0±11.5% of ideal B1, respectively. pCASL labeling scheme used FA=150, Gave/Gmax=0.6/10mT/m and labeling efficiency was 82.1% based on Bloch equation simulations. Average SAR across five subjects was 74.6±6.4% of the first level limit (3.2W/kg on head).
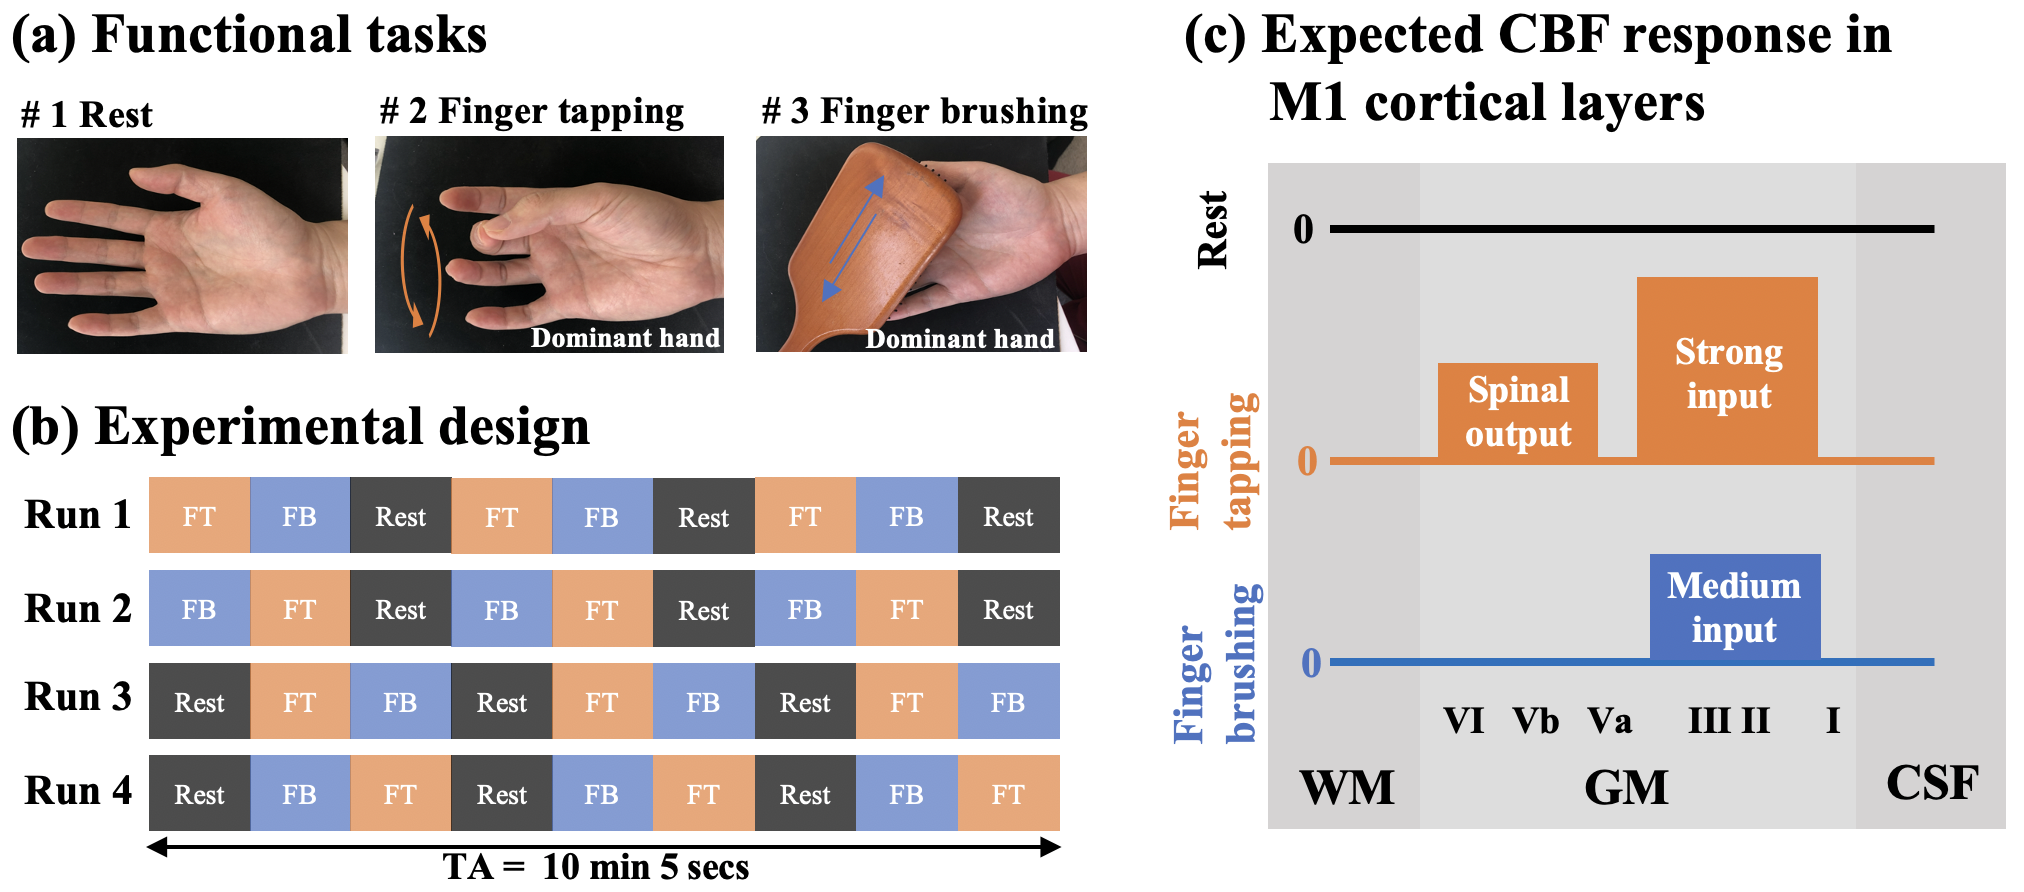
Two runs of resting-state ASL at PLD=500/1500ms (15 L/C pairs,TA=8min24sec), and four runs of task ASL at PLD=1000ms with interleaved blocks of rest, sequential finger-tapping (FT) and finger brushing (FB) were acquired. FT/FB tasks were performed on the dominant hand. Each task run consisted of nine blocks of rest, FT and FB tasks (67.2secs per block, TA=10min, Fig.2(a,b)), with the order counter-balanced. As shown in Fig.2(c), we expect FT to induce activity in both superficial layers (sensory input from primary sensory cortex (S1) and premotor cortex) and deep layers (spinal output), while FB to induce weaker neuronal activity in superficial layers (exteroception S1 input) [8].
Partial Fourier reconstruction was done by POCS method. Twenty cortical layers of M1 were segmented from control images using LAYNII [5] (fig.3(a)). Control and label images were subtracted to obtain perfusion images after motion correction and co-registration. Resting-state arterial transit time (ATT) and CBF were estimated from multi-delay perfusion [6]. CBF activation was calculated according to [7]. Within-layer smoothing (1mm-FWHM) was performed for illustration purpose in Fig.4(b).
Results and discussion
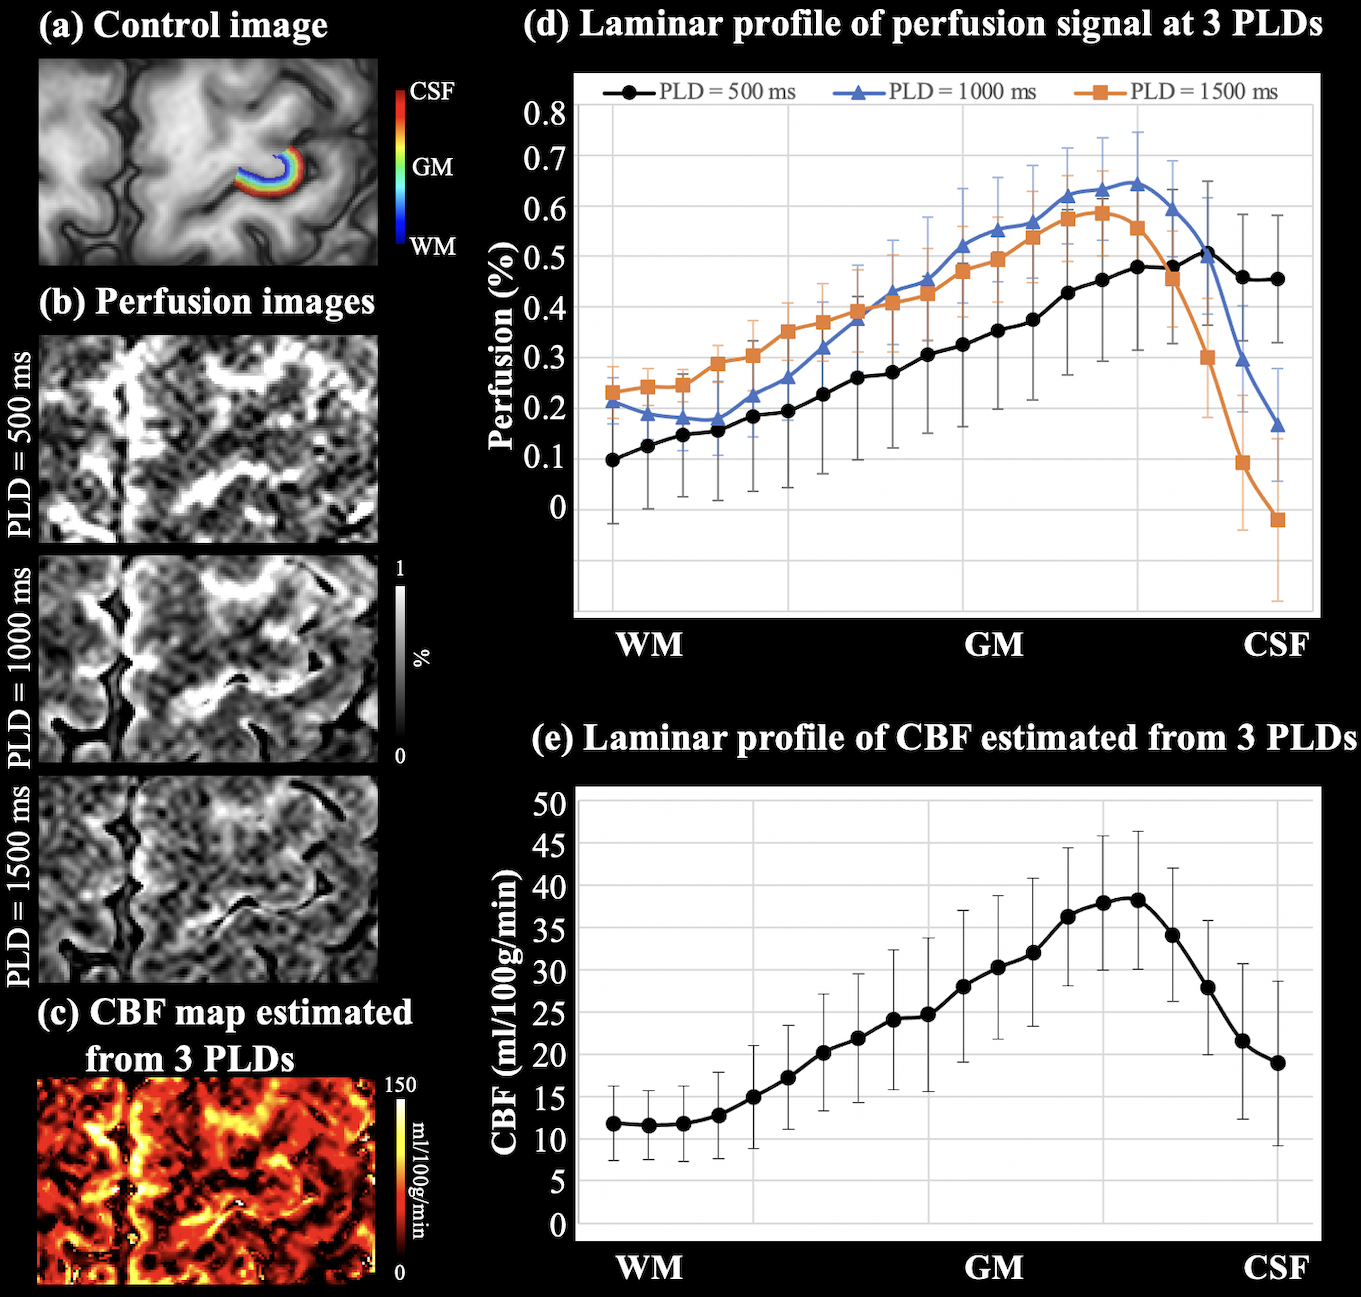
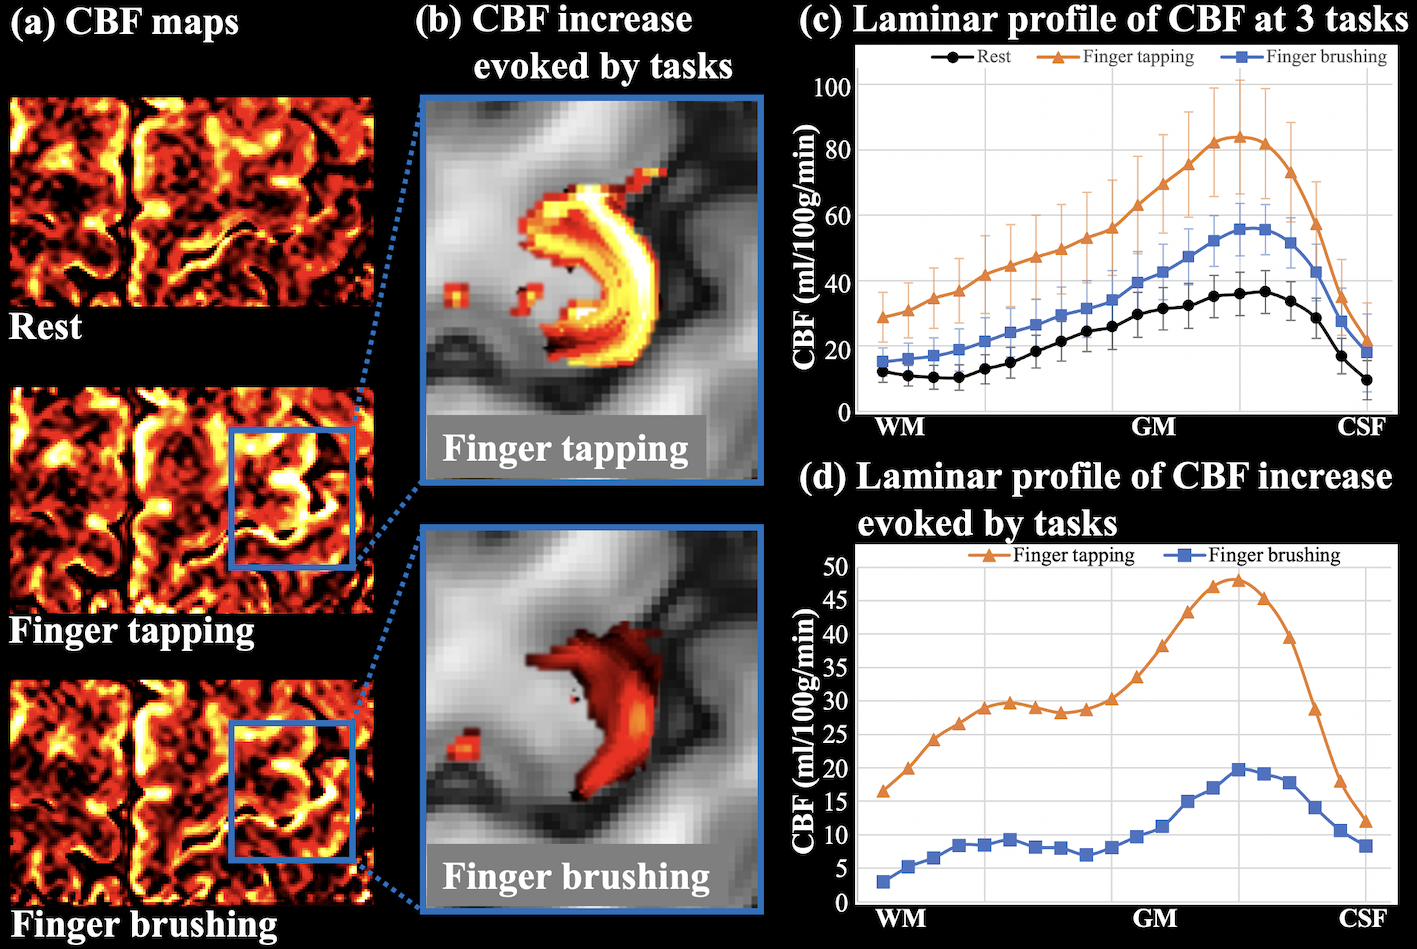
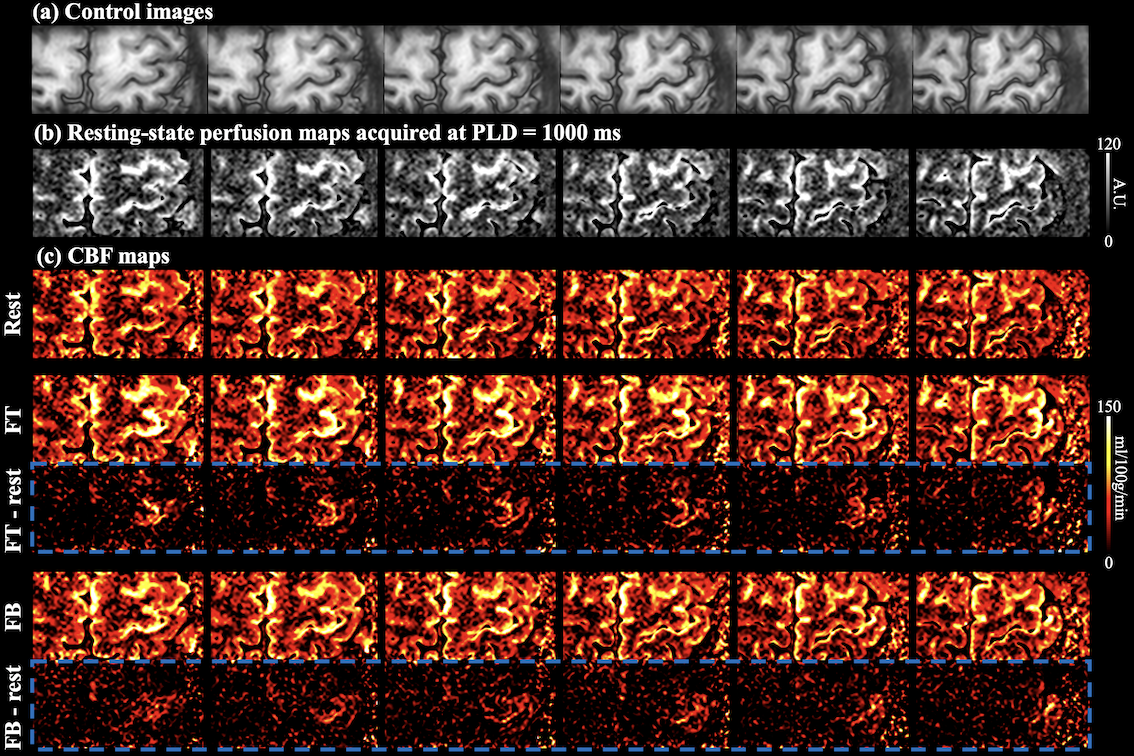
Control image, resting-state perfusion images at three PLDs and CBF maps are shown in Fig.3(a-c). Laminar profile of multi-delay perfusion signal and CBF are shown in Fig.3(d,e), respectively. Average ATT=954.0±46.8 ms across cortical layers. Perfusion signal at PLD=500 ms peaks at the GM/CSF boundary, which indicates remaining labeled signal in the pail arteries. Perfusion signals at PLD=1000/1500 ms peak in middle layers with minimal signal left at the GM/CSF boundary, and more labeled signal arrives in deep layers at PLD=1500ms. Perfusion fMRI scans were acquired at PLD=1000ms when majority of the labeled signal arrives at capillary/tissue space.Figure 4(a) shows the CBF maps from rest, FT and FB conditions. Strong and medium CBF increases evoked by the FT and FB tasks can be observed along M1, as highlighted in two insets (Fig.4(b)). Figure 4(c) shows the laminar profile of CBF at rest and during two tasks, and Fig.4(d) shows the laminar profile of CBF change evoked by activations. FT-induced CBF increase shows a clear ‘double-peak’ pattern, consistent with the hypothesis and VASO fMRI results that FT engaged neural activity of somatosensory input in the superficial layers and motor output in the deep layers [8]. FB-induced CBF increase was overall smaller compared to the FT condition. The perfusion response mainly peaked in superficial layers, consistent with the neural hypothesis with strong somatosensory input and minimal motor output [8]. These results demonstrate the high spatial specificity of 7T ASL, capable of resolving layer-dependent input and output activity in human M1. On average, resting, FT and FB CBF were 22.5±9.9,53.3±19.5,33.2±14.1 ml/100g/min across layers, respectively. Figure 5 (a,b) show six slices of control and resting-state perfusion maps (PLD=1000ms), respectively. Figure 5 (c) shows the CBF maps at rest, two activation tasks and the difference between activation and rest. The proposed technique has sufficient coverage for perfusion measurement and sensitivity for detecting perfusion activation in M1, premotor and supplementary motor.
Conclusion
In-vivo laminar perfusion fMRI was performed by high resolution ASL with optimized pCASL labeling and acquisition scheme at 7T. We demonstrated that ASL provides quantitative CBF measurements with high specificity to detect layer-dependent input and output activity in human M1.Acknowledgements
This work was supported by National Institute of Health (NIH) grant UH3-NS100614, S10-OD025312, R01-NS114382 and R01-EB028297.References
[1] Huber, Laurentius, Kâmil Uludağ, and Harald E. Möller. "Non-BOLD contrast for laminar fMRI in humans: CBF, CBV, and CMRO2." NeuroImage 197 (2019): 742-760.
[2] Zuo Z, Wang R, Zhuo Y, et al. Turbo-FLASH based arterial spin labeled perfusion MRI at 7 T[J]. PloS one, 2013, 8(6): e66612.
[3] Pohmann R, Speck O, Scheffler K. Signal‐to‐noise ratio and MR tissue parameters in human brain imaging at 3, 7, and 9.4 tesla using current receive coil arrays[J]. Magnetic resonance in medicine, 2016, 75(2): 801-809.
[4] Shao, X., K. Wang, and D. J. Wang. "7T high-resolution arterial spin labeling reveals layer dependent cerebral blood flow." Proceedings of ISMRM. Vol. 849. 2019.
[5] Huber, Laurentius Renzo, et al. "LayNii: A software suite for layer-fMRI. revision 1." BioRxiv (2020).
[6] Wang, Danny JJ, et al. "Multi-delay multi-parametric arterial spin-labeled perfusion MRI in acute ischemic stroke—comparison with dynamic susceptibility contrast enhanced perfusion imaging." NeuroImage: Clinical 3 (2013): 1-7.
[7] Alsop D C, Detre J A, Golay X, et al. Recommended implementation of arterial spin‐labeled perfusion MRI for clinical applications: A consensus of the ISMRM perfusion study group and the European consortium for ASL in dementia[J]. Magnetic resonance in medicine, 2015, 73(1): 102-116.[8] Huber L, Handwerker D A, Jangraw D C, et al. High-resolution CBV-fMRI allows mapping of laminar activity and connectivity of cortical input and output in human M1[J]. Neuron, 2017, 96(6): 1253-1263. e7.
Figures