0465
Brain function induces alteration in the autocorrelation of the fMRI signal1Department of Psychology, University of Toronto, Toronto, ON, Canada, 2Rotman Research Institute at Baycrest, Toronto, ON, Canada
Synopsis
The autocorrelation (AC) of the fMRI signal is assumed irrelevant to the brain function and is eliminated by fMRI preprocessing. Recent findings have suggested that the brain function may alter the AC value of the fMRI signal. We used fMRI data acquired during cognitive processes of working memory (WM), mathematical computations, video watching, and resting-state, and showed that cognitively demanding tasks decrease the AC values in functionally related brain regions. Decrease in AC is related to performance on the target tasks. The AC of the fMRI signal is affected by cognitive processes and can provide complementary information about brain function.
Introduction
The autocorrelation (AC) of the fMRI signal is characterized as a noise source, unrelated to cognition, that masks meaningful signals. Recent evidence, however, suggests that the AC might actually reflect ongoing functional and cognitive processes1. Assuming that brain function affects the autocorrelation of the fMRI signal, we would expect to see different AC values across different states of brain function. To test this hypothesis, we used a continuous, multitask paradigm to study the relationship between ongoing cognition and changes in the AC patterns derived from fMRI signals. Our hypothesis was that the AC pattern of the fMRI signal would be different during different ongoing brain functional states, and related to performance.Method
We used fMRI datasets collected during ongoing cognition in individuals2. Informed consent was obtained from all subjects and the data collection was approved by the Institutional Review Board of the National Institute of Health in Bethesda, MD. The Research Ethics Board of the University of Toronto has approved our use of these data. Participants were scanned continuously for a 25 min and 24 s, while performing four different tasks: two-back working memory (WM), mathematical computations of addition and subtraction, visual attention, and eyes-open rest. Each task was completed twice, in 3 min blocks, and were preceded by a 12-s instruction period. There were no consecutive blocks of the same task. The fMRI data were acquired on a Siemens 7 Tesla MRI scanner with a 32-element receive coil. Functional runs were obtained using a gradient recalled echo planar imaging sequence (TR = 1.5 s, TE = 25 ms, voxel size = isotropic 2mm). We performed standard fMRI preprocessing steps using FSL, including brain extraction, motion correction, spatial smoothing with a 5mm FWHM kernel and regression of 6 estimated motion parameters. For each task block, voxel-wise autoregressive (AR(1)) coefficients were estimated using MATLAB’s ARfit toolbox3. The AR maps were transformed into a common MNI space. To investigate if the AR values were different in different tasks and runs, a voxel-wise 2-way ANOVA test was performed with tasks (rest, memory, math, video) and runs (run1, run2) as factors. As a follow-up, voxel-wise AR values across each pair of tasks were compared using paired t-tests. Statistical maps were thresholded with the p-value of 0.0001 and then corrected for multiple comparison using cluster correction implemented in AFNI (3dClustSim). Last, the AC values were correlated with the behavioral measures.Results
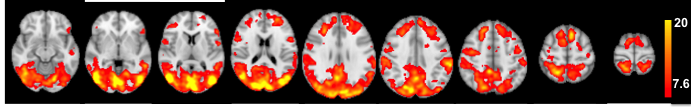
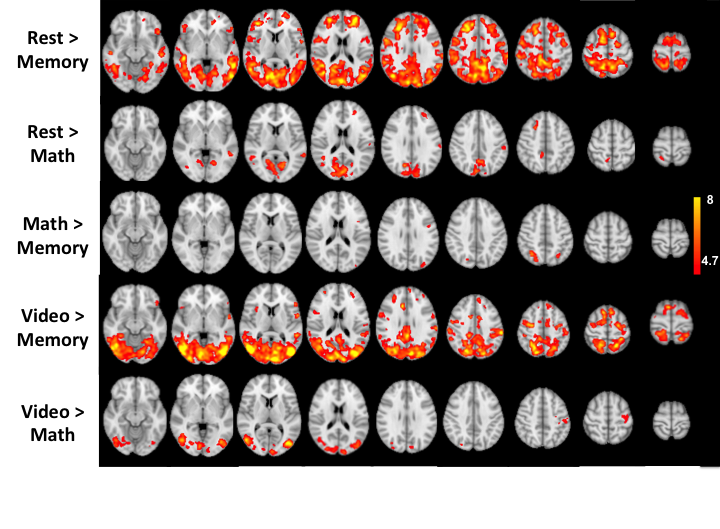
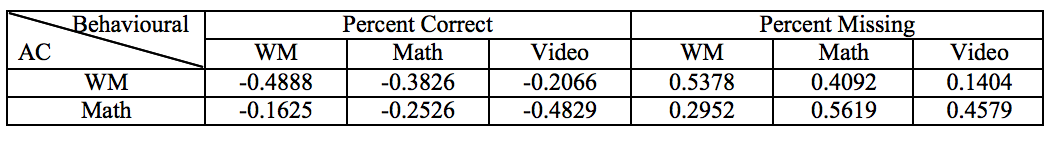
Figure 1 shows the F-value map of the effect of task condition. The effect of task condition on the AR values was observed in almost all the cortical gray matter including lateral occipital cortex, occipital fusiform gyrus, lingual gyrus, occipital pole, precuneus cortex, supramarginal gyrus, superior frontal gyrus, and superior parietal lobule. The F-map of the runs effect did not show any significant effect. Maps for the paired t-test with significant effects are shown in Figure 2. When compared to rest, the WM task decreased AR parameters in inferior temporal gyrus, frontal pole, middle temporal gyrus, posterior cingulate gyrus, lateral occipital cortex, intracalcarine cortex, cuneus, precuneus, angular gyrus, and superior frontal gyrus. Rest was associated with higher AR values compared to the Math task in middle temporal gyrus, intracalcarine and supracalcarine cortex, precuneus, cuneal cortex, supramarginal gyrus, superior frontal gyrus and superior parietal lobule. Video watching did not change AR values compared to the resting-state condition. AR values during the Math task were higher than the values during the WM task in lateral occipital cortex and precentral gyrus. The video watching generated higher AR values compared to the WM task in lateral occipital cortex, temporal occipital fusiform cortex, lingual gyrus, occipital pole, anterior and posterior cingulate gyri, supramarginal gyrus, precentral gyrus, and frontal gyrus. The Video watching had higher AR values compared to the Math task in lateral occipital cortex and precentral and postcentral gyri. Next, we calculated the correlation between the average AC values within the regions with significantly different AC values compared to rest (Rest>WM and Rest>Math) with the behavioral measures. The correlation values are presented in Table 1. In general, better task performance is associated with lower AC value.Discussion
We showed that autocorrelation of the fMRI signal was sensitive to changes in cognitive states, as evidenced by the fact that participants had different autocorrelation profiles when they performed different cognitive tasks. Specifically, performing the WM reduced AC values in brain regions associated with WM (e.g. inferior temporal gyrus, frontal pole, posterior cingulate gyrus, lateral occipital cortex, cuneus, precuneus, angular gyrus). Performing math tasks decreased the AC values in brain regions that have been traditionally associated with performing mathematical computation (i.e. superior parietal lobule, temporal gyrus, supramarginal gyrus4, superior frontal gyrus5). The AC values in these regions are associated with the task-performance. Specifically, lower AC values are associated with better task performance, with some evidence of regional specialization. Compared to WM and math tasks, video watching is less demanding and the pattern of AC values during the video watching is similar to the AC pattern during resting-state. This study demonstrates that the autocorrelation of the fMRI signal is affected by brain cognitive processes and can provide additional information about brain function.Acknowledgements
Data used in the preparation of this work were obtained from the NIMH’s Lab of Brain and Cognition (LBC; Principal Investigators: Javier Gonzalez-Castillo, Peter A. Bandettini). LBC funding was provided by the National Institute of Mental Health, Division of Intramural Research Programs (NIMH DIRP).References
1. Arbabshirani, M. R. et al. Autoconnectivity: A new perspective on human brain function. J. Neurosci. Methods 323, 68–76 (2019).
2. Gonzalez-Castillo, J. et al. Tracking ongoing cognition in individuals using brief, whole-brain functional connectivity patterns. Proc. Natl. Acad. Sci. U. S. A. 112, 8762–8767 (2015).
3. Schneider, T. & Neumaier, A. Algorithm 808. ACM Transactions on Mathematical Software (TOMS) vol. 27 58–65 (2001).
4. Abd Hamid, A. I., Yusoff, A. N., Mukari, S. Z.-M. S. & Mohamad, M. Brain Activation during Addition and Subtraction Tasks In-Noise and In-Quiet. Malays. J. Med. Sci. 18, 3–15 (2011).
5. Price, G. R., Mazzocco, M. M. M. & Ansari, D. Why mental arithmetic counts: brain activation during single digit arithmetic predicts high school math scores. J. Neurosci. 33, 156–163 (2013).
Figures