0464
fMRI deconvolution with synthesis-based Paradigm Free Mapping and analysis-based Total Activation operate identically1Basque Center on Cognition, Brain and Language, Donostia - San Sebastián, Spain
Synopsis
Functional MRI deconvolution algorithms are gaining popularity to study the dynamicss of functional brain activity and connectivity at short timescales. This work sheds light on our understanding of two state-of-the-art approaches based on L1-norm regularized estimators: Paradigm Free Mapping (synthesis model) and Total Activation (analysis model). Through simulations with varying signal-to-noise ratios, and an experimental motor task dataset, we demonstrate that both formulations produce identical estimates of the innovation and activity-inducing signals underlying BOLD events when identical hemodynamic response and regularization parameters are used. These observations open up the possibility for future developments without questioning their core formulation and performance.
Introduction
There is an increasing interest in methods that aim to recover the underlying neuronal activity from functional magnetic resonance imaging (fMRI) data with no prior information of the timing of the blood oxygenation level-dependent (BOLD) events. Deconvolution methods are capable of blindly estimating such activity, which makes them especially attractive for exploring functional network dynamics when the timing of relevant activity is unknown, as in resting-state with healthy subjects1-5 and patients6,7, different sleep stages8, or in clinical conditions, such as interictal epileptic activity9. Paradigm Free Mapping10 (PFM) and Total Activation11 (TA) are two such deconvolution algorithms. This work aims to compare the core of both techniques to understand how they differ from each other and when one should be used over the other.Theory
Under the linear model typically assumed in fMRI data analysis, the activity-related (i.e. BOLD) signal of a voxel $$$x(t)$$$ is modeled as the convolution of the activity-inducing signal $$$s(t)$$$ with the hemodynamic response function (HRF) $$$h(t)$$$, i.e. $$$\mathbf{x} = \mathbf{Hs}$$$ in matrix notation where $$$\mathbf{x}, \mathbf{s} \in \mathbb{R}^{N \times 1}$$$, $$$\mathbf{H} \in \mathbb{R}^{N \times N}$$$ is the HRF in Toeplitz matrix form, and $$$N$$$ is the number of scans of the fMRI acquisition12.The PFM algorithm10,13 proposes to estimate the activity-inducing signal $$$\mathbf{s}$$$ (referred to as spike model) or its innovation signal $$$\mathbf{u}$$$ (block model), where $$$\mathbf{s}=\mathbf{Lu}$$$ and $$$\mathbf{L}$$$ is the discrete integrator operator, by solving the following $$$\ell_1$$$-norm synthesis-based regularized least squares problems based on the LASSO14, respectively:
$$\hat{\mathbf{s}} = \arg \min_{\mathbf{s}} \frac{1}{2} \| \mathbf{y} - \mathbf{Hs} \|_2^2 + \lambda \| \mathbf{s} \|_1 \textrm{(spike model)} $$
$$ \hat{\mathbf{u}} = \arg \min_{\mathbf{u}} \frac{1}{2} \| \mathbf{y} - \mathbf{HLu} \|_2^2 + \lambda \| \mathbf{u} \|_1 \textrm{(block model)} $$
Alternatively, the temporal regularization of TA employs a linear differential operator $$$L_h$$$ that inverts a linearized hemodynamic kernel system based on activelets11,15, i.e. $$$\mathbf{s} = \Delta_L \{\mathbf{x}\} $$$, by solving the following $$$\ell_1$$$-norm analysis-based regularized least-squares problem based on generalized 1D total variation16:
$$ \hat{\mathbf{x}} = \arg \min_{\mathbf{x}} \frac{1}{2} \| \mathbf{y} - \mathbf{x} \|_2^2 + \lambda \| \Delta_L \{\mathbf{x}\} \|_1 $$
Similar to PFM, the innovation signal $$$\mathbf{u}$$$ can be estimated with the derivative of the linear operator $$$L_h$$$16.
Methods
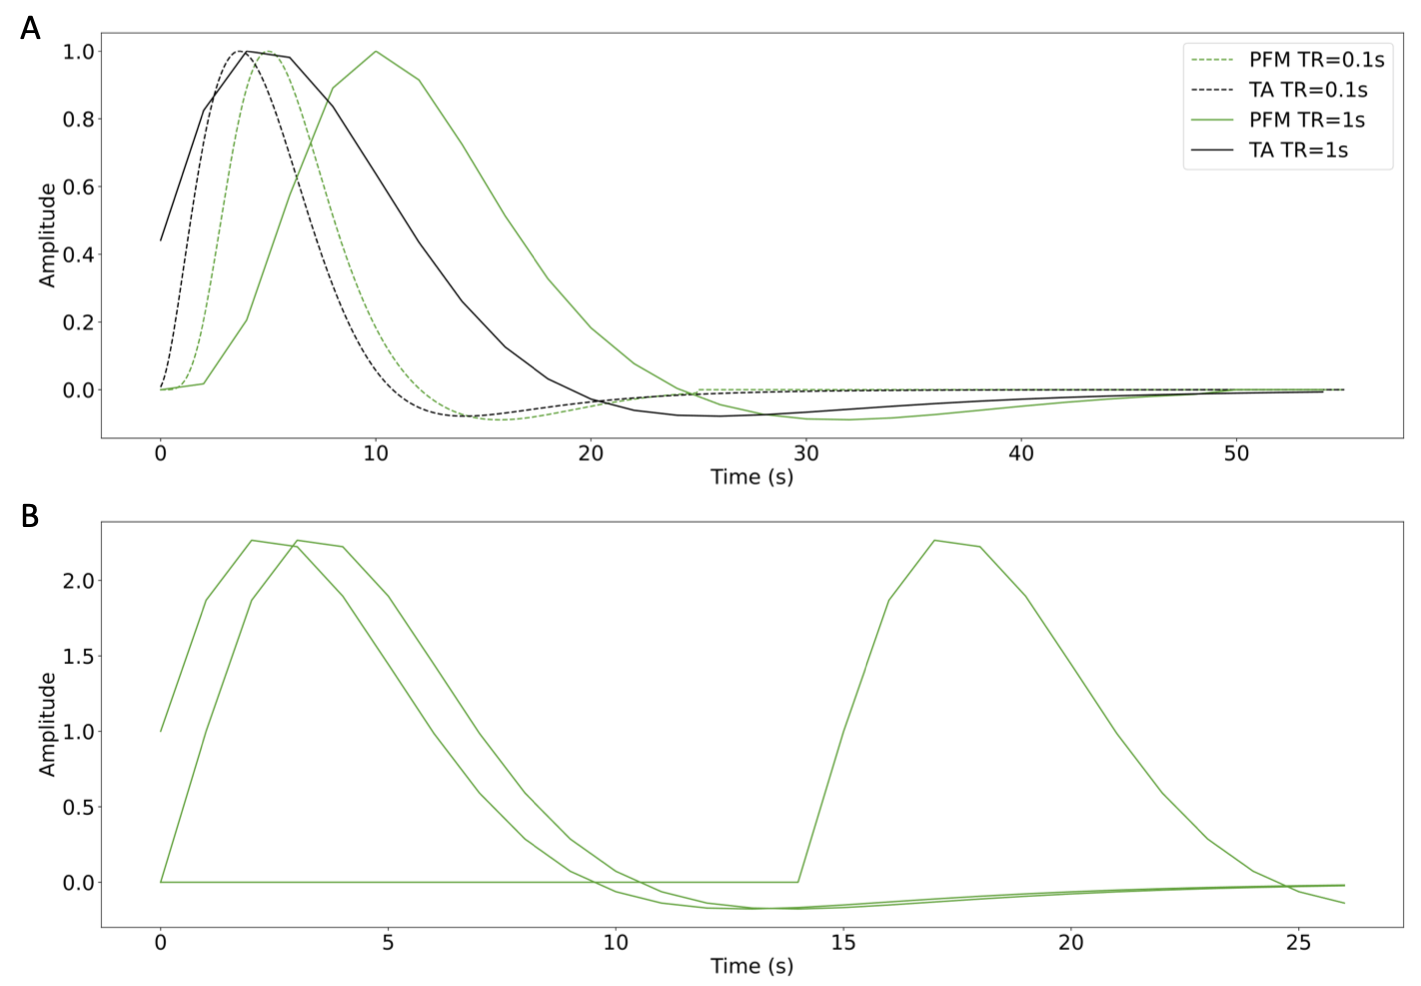
We simulated voxelwise time-series with different signal-to-noise ratios (SNR=20, 10, 3 dB) that mimic realistic fMRI data acquired in a 3 Tesla MRI scanner (e.g. varying voxel resolution17,18) including motion and physiological noise. Activity-inducing signals were convolved with the SPM canonical HRF to obtain the simulated BOLD response. To avoid any bias in the comparison due to differences in the HRF models, we matched the HRF used in PFM for $$$\mathbf{H}$$$ to that defined in TA (i.e. defined in terms of the discrete Laplace operator of the canonical HRF) (Figure 1), and evaluated both techniques in terms of the choice of the regularization parameter $$$\lambda$$$.For evaluation in real data, we analyzed one T2*-weighted multi-echo fMRI dataset acquired on a 3T Siemens PrismaFit scanner (340 scans, 52 slices, PF=6/8, voxel-size=2.4x2.4x3mm3, TR=1.5s, TEs=10.6/28.69/46.78/64.87/82.96ms, FA=70, MB factor=4, GRAPPA=2). The paradigm consisted of five randomly-intermixed movements (left-hand finger-tapping, right-hand finger-tapping, moving left toes, moving right toes, and moving the tongue). Preprocessing: head motion realignment, geometric distortion correction, and T2*-based optimal combination using TEDANA.
Results
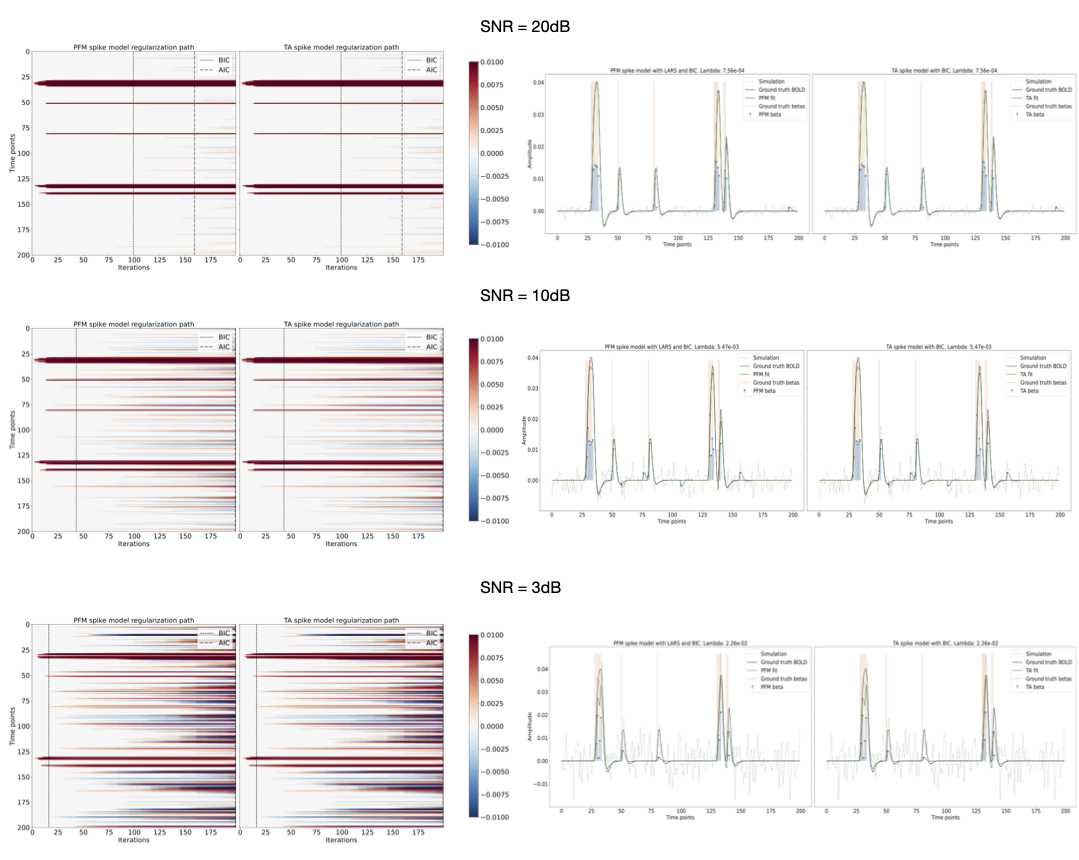
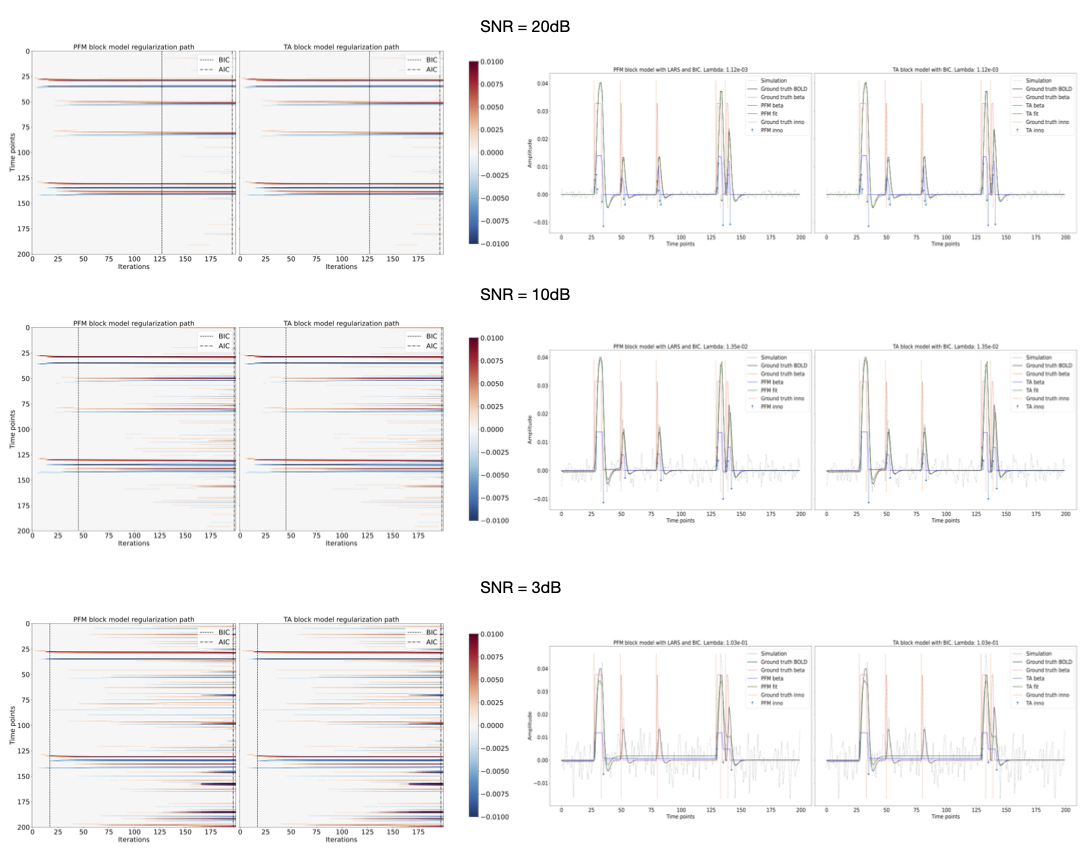
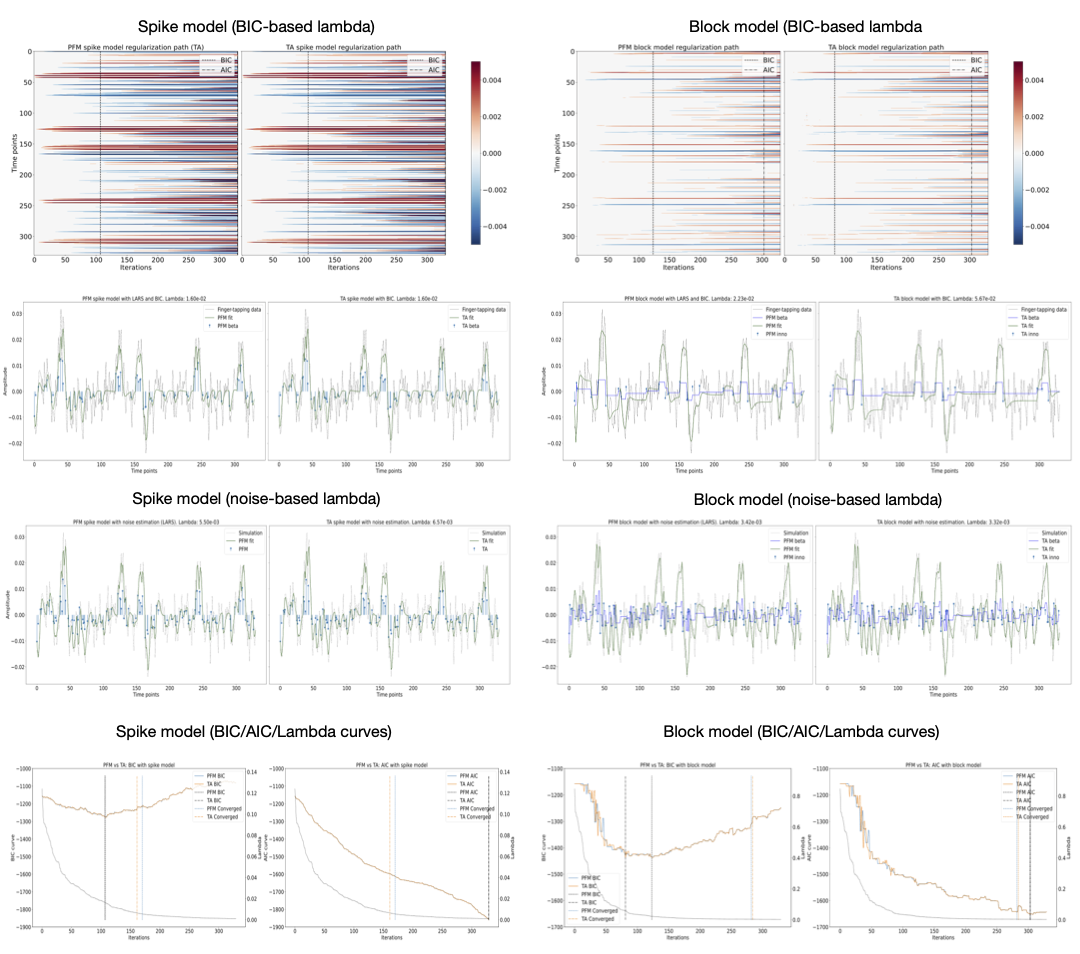
Figures 2 and 3 demonstrate that the regularization paths of PFM (computed with scikit-learn LARS function19) and TA (using the Fast Iterative Shrinkage Thresholding Algorithm (FISTA) on the same set of $$$\lambda$$$’s) when estimating activity-inducing (spike model) and innovation signals (block model) respectively, are identical, regardless of the SNR. For illustration, the solutions obtained when the regularization parameter is set according to the Bayesian Information Criterion (BIC) are shown on the right side of each figure.Figure 4 shows similar plots with the results obtained on a representative voxel of the right-hand finger-tapping condition for a representative dataset for different approaches to choose $$$\lambda$$$, as well as the curves of the BIC and AIC. We again observe that the regularization paths of TA and PFM, and estimates of the innovation, activity-inducing, and activity-related signals are visually identical (up to numerical precision) for both spike and block models. Minimal differences can only be observed when $$$\lambda$$$ is selected such that the variance of the residuals is equal to the median absolute deviance (MAD) estimate of the noise variance after wavelet decomposition of the voxel time-series (Daubechies, order 3), which is due to the constrained set of $$$\lambda$$$’s used in LARS, compared with the fine-scale iterative tuning of $$$\lambda$$$ achievable with FISTA11.
We encourage the reader to play with the parameters (e.g. SNR, varying HRF options and mismatch between algorithms, TR, number of events, onsets, and durations) in the provided Jupyter notebook https://github.com/eurunuela/pfm_vs_ta
Conclusion
Paradigm Free Mapping and Total Activation yield practically identical performance when the same HRF model and regularization parameter are employed, demonstrating that synthesis and analysis models are equivalent for temporal fMRI deconvolution. Thus, previously observed differences in performance are due to usage options. Future work should focus on investigating the appropriate formulation depending on data acquisition (e.g. single-echo vs multi-echo20), accounting for HRF variability21,22, robust methods to select the regularization parameter13,23, and other potential $$$\mathcal{l}_{p,q}$$$-norm regularization terms (e.g. $$$p<1$$$) or debiasing approaches.Acknowledgements
This work was supported by the European Union’s Horizon 2020 research and innovation program (Marie Skłodowska-Curie grant agreement No. 713673), La Caixa Foundation (ID 100010434, fellowship code LCF/BQ/IN17/11620063), the Spanish Ministry of Economy and Competitiveness (RYC-2017-21845), the Basque Government (BERC 2018-2021, PIBA_2019_104, PRE_2019_1_0054), the Spanish Ministry of Science, Innovation and Universities (PID2019-105520GB-100).References
[1] Petridou, N., Gaudes, C.C., Dryden, I.L., Francis, S.T. and Gowland, P.A., 2013. Periods of rest in fMRI contain individual spontaneous events which are related to slowly fluctuating spontaneous activity. Human brain mapping, 34(6), pp.1319-1329.
[2] Allan, T.W., Francis, S.T., Caballero-Gaudes, C., Morris, P.G., Liddle, E.B., Liddle, P.F., Brookes, M.J. and Gowland, P.A., 2015. Functional connectivity in MRI is driven by spontaneous BOLD events. PloS one, 10(4), p.e0124577.
[3] Gonzalez-Castillo, J., Caballero-Gaudes, C., Topolski, N., Handwerker, D.A., Pereira, F. and Bandettini, P.A., 2019. Imaging the spontaneous flow of thought: Distinct periods of cognition contribute to dynamic functional connectivity during rest. NeuroImage, 202, p.116129.
[4] Karahanoğlu, F.I. and Van De Ville, D., 2015. Transient brain activity disentangles fMRI resting-state dynamics in terms of spatially and temporally overlapping networks. Nature communications, 6(1), pp.1-10.
[5] Kinany, N., Pirondini, E., Micera, S. and Van De Ville, D., 2020. Dynamic functional connectivity of resting-state spinal cord fMRI reveals fine-grained intrinsic architecture. Neuron, 108(3), pp.424-435.
[6] Zöller, D., Sandini, C., Karahanoğlu, F.I., Padula, M.C., Schaer, M., Eliez, S. and Van De Ville, D., 2019. Large-scale brain network dynamics provide a measure of psychosis and anxiety in 22q11. 2 deletion syndrome. Biological Psychiatry: Cognitive Neuroscience and Neuroimaging, 4(10), pp.881-892.
[7] Bommarito, G., Tarun, A., Farouj, Y., Preti, M.G., Petracca, M., Droby, A., El Mendili, M.M., Inglese, M. and Van De Ville, D., 2020. Functional network dynamics in progressive multiple sclerosis. medRxiv.
[8] Tarun, A., Wainstein-Andriano, D., Sterpenich, V., Bayer, L., Perogamvros, L., Solms, M., Axmacher, N., Schwartz, S. and Van De Ville, D., 2020. NREM sleep stages specifically alter dynamical integration of large-scale brain networks. iScience, p.101923.
[9] Lopes, R., Lina, J.M., Fahoum, F. and Gotman, J., 2012. Detection of epileptic activity in fMRI without recording the EEG. Neuroimage, 60(3), pp.1867-1879.
[10] Caballero Gaudes, C., Petridou, N., Francis, S.T., Dryden, I.L. and Gowland, P.A., 2013. Paradigm free mapping with sparse regression automatically detects single‐trial functional magnetic resonance imaging blood oxygenation level dependent responses. Human brain mapping, 34(3), pp.501-518.
[11] Karahanoğlu, F.I., Caballero-Gaudes, C., Lazeyras, F. and Van De Ville, D., 2013. Total activation: fMRI deconvolution through spatio-temporal regularization. Neuroimage, 73, pp.121-134.
[12] Gitelman, D.R., Penny, W.D., Ashburner, J. and Friston, K.J., 2003. Modeling regional and psychophysiologic interactions in fMRI: the importance of hemodynamic deconvolution. Neuroimage, 19(1), pp.200-207.
[13] Uruñuela, E., Jones, S., Crawford, A., Shin, W., Oh, S., Lowe, M. and Caballero-Gaudes, C., 2020, July. Stability-Based Sparse Paradigm Free Mapping Algorithm for Deconvolution of Functional MRI Data. In 2020 42nd Annual International Conference of the IEEE Engineering in Medicine & Biology Society (EMBC) (pp. 1092-1095). IEEE.
[14] Tibshirani, R., 1996. Regression shrinkage and selection via the lasso. Journal of the Royal Statistical Society: Series B (Methodological), 58(1), pp.267-288.
[15] Khalidov, I., Fadili, J., Lazeyras, F., Van De Ville, D. and Unser, M., 2011. Activelets: Wavelets for sparse representation of hemodynamic responses. Signal processing, 91(12), pp.2810-2821.
[16] Karahanoglu, F.I., Bayram, I. and Van De Ville, D., 2011. A signal processing approach to generalized 1-D total variation. IEEE Transactions on Signal Processing, 59(11), pp.5265-5274.
[17] Triantafyllou, C., Hoge, R.D., Krueger, G., Wiggins, C.J., Potthast, A., Wiggins, G.C. and Wald, L.L., 2005. Comparison of physiological noise at 1.5 T, 3 T and 7 T and optimization of fMRI acquisition parameters. Neuroimage, 26(1), pp.243-250.
[18] van der Zwaag, W., Francis, S., Head, K., Peters, A., Gowland, P., Morris, P. and Bowtell, R., 2009. fMRI at 1.5, 3 and 7 T: characterising BOLD signal changes. Neuroimage, 47(4), pp.1425-1434.
[19] Efron, B., Hastie, T., Johnstone, I. and Tibshirani, R., 2004. Least angle regression. The Annals of statistics, 32(2), pp.407-499.
[20] Caballero-Gaudes, C., Moia, S., Panwar, P., Bandettini, P.A. and Gonzalez-Castillo, J., 2019. A deconvolution algorithm for multi-echo functional MRI: Multi-echo Sparse Paradigm Free Mapping. NeuroImage, 202, p.116081.
[21] Badillo, S., Vincent, T. and Ciuciu, P., 2013. Group-level impacts of within-and between-subject hemodynamic variability in fMRI. Neuroimage, 82, pp.433-448.
[22] Gaudes, C.C., Karahanoğlu, F.I., Lazeyras, F. and Van De Ville, D., 2012, May. Structured sparse deconvolution for paradigm free mapping of functional MRI data. In 2012 9th IEEE International Symposium on Biomedical Imaging (ISBI) (pp. 322-325). IEEE.
[23] Meinshausen, N. and Bühlmann, P., 2010. Stability selection. Journal of the Royal Statistical Society: Series B (Statistical Methodology), 72(4), pp.417-473.
Figures