0459
Beyond BOLD: in search of genuine diffusion fMRI contrast in human brain
Wiktor Olszowy1,2 and Ileana O Jelescu1,2
1CIBM Center for Biomedical Imaging, Lausanne, Switzerland, 2Animal Imaging and Technology, EPFL, Lausanne, Switzerland
1CIBM Center for Biomedical Imaging, Lausanne, Switzerland, 2Animal Imaging and Technology, EPFL, Lausanne, Switzerland
Synopsis
Diffusion fMRI (dfMRI) is an alternative to BOLD fMRI. Here, we present the first dfMRI study in humans attempting to minimize all sources of BOLD contamination and comparing functional responses at two field strengths, both for task and resting-state fMRI. Our study benefits from unprecedented high spatiotemporal resolution. We observed task-induced water diffusivity decreases in the perfusion-free b-value regime. Furthermore, we found that positive correlations were largely preserved while anti-correlations were suppressed in dfMRI functional connectivity compared to BOLD. We conclude that dfMRI contrast is genuine and distinct from BOLD mechanisms.
Introduction
Functional MRI is mainly performed with the BOLD contrast, which relies on neurovascular coupling. Hence fMRI-BOLD suffers from poor spatial and temporal specificity to neuronal activation. Diffusion fMRI (dfMRI) was proposed to overcome these limitations: it relies on dynamic microstructural changes driven by neural activity, such as cell swelling and axon beading, to induce changes in the diffusivity of water molecules on-site1. One of the main critiques of dfMRI contrast is that it is driven by residual BOLD contamination2 and that the sensitivity of the method is otherwise too low to detect physiological levels of brain activity3. Here, we propose a dfMRI study design that minimizes all potential sources of residual BOLD contamination to determine whether genuine diffusion fMRI contrast is detectable in the human brain at the individual level. We use a bipolar gradient diffusion sequence to mitigate cross-terms between diffusion and susceptibility gradients, and compute apparent diffusion coefficient (ADC) time-courses using b-values $$$\geq0.2 \text{ms}/\mu\text{m}^2$$$ to suppress T2-weighting and perfusion contributions. We also compare dfMRI signal properties at two field strengths, 3T and 7T. We compare average response functions to a task between SE-BOLD and dfMRI. From a biophysical standpoint, a field-independent decrease in ADC is expected during task. We also compare resting-state functional connectivity (rs-FC) between dfMRI and SE-BOLD.Methods
Experimental: Data were acquired at Siemens Magnetom 7T and Prisma 3T scanners, on 16 subjects (4 males: age mean 25.4, std 5.3). Three modalities were used: (1) SE-EPI yielding T2-BOLD contrast, (2) DW-TRSE-EPI with pairs of b-values 0 and 1 $$$\text{ms}/\mu\text{m}^2$$$, and (3) the latter but with b-values 0.2 and 1. Sequence parameters were: TE = 62ms(7T)/72ms(3T), TR=1035ms, 2.5-mm isotropic resolution, matrix size 94x94, 16 slices, GRAPPAx2, MB24, 600 volumes per run. Subjects were viewing a flashing checkerboard and concurrently finger-tapping for 12s following 18s of rest. Resting state data were acquired with similar settings except 2-mm isotropic voxels, matrix size 116x116.Processing: The pipeline is sketched in Fig.1. Brain regions were extracted from the Neuromorphometrics atlas using ANTs8. Task: Whole brain, visual and motor cortex were selected and the average response functions across subjects in each ROI were compared for each modality and field strength. Average FC matrices for the atlas ROIs were compared for each modality and field strength.
Results
Task: Activation in visual and motor cortices was observed for all three modalities (Fig.2). The spatial extent of activation was much lower with dfMRI than with SE-BOLD. Analysis of the response functions (Fig.3) revealed that, as expected, SE-BOLD amplitude is larger at 7T than 3T, and larger than dfMRI response. Few datasets are available for b=0/1 ADC but they show nonetheless an increase in ADC during task. Conversely, data for b=0.2/1 show a decrease in ADC during task, both consistent with respective previous reports1,9-12. The relative amplitude of ADC decrease is consistent between field strengths, but the timing is different, with a faster drop and restoration of ADC at 7T vs a slower response at 3T.Rs-FC: Group averages of Fisher-transformed FC matrices showed that, while both positive and negative correlations became magnitude-wise smaller in dfMRI compared to BOLD, negative correlations were attenuated preferentially, particularly at 3T (Fig.4).
Discussion and conclusions
This is the first dfMRI study in humans attempting to minimize sources of BOLD contamination and comparing functional responses at two field strengths, both for task and resting-state fMRI. Our study further benefits from unprecedented spatiotemporal resolution.ADC directionality: The ADC from b=0/1 increases during task which is contrary to the expectation from biophysical mechanisms underlying dfMRI and suggests residual BOLD contamination, likely from perfusion component at low b, while ADC from b=0.2/1 decreases, consistent with biophysical expectations. Efforts to contain BOLD contamination should therefore also include staying away from the perfusion regime $$$b<0.2 \text{ms}/\mu\text{m}^2$$$. In what follows we discuss ADC based on 0.2/1 pairs.
Temporal characteristics: AT 7T, the ADC decreases rapidly upon task onset but increases back before the task is finished. The first component might reflect rapid microstructural changes, and the latter slower but notable BOLD contamination, in agreement with a recent dfMRI study in rats13. At 3T, the persistently negative ADC response can be attributed to reduced susceptibility effects and thereby BOLD contamination. However, the origins of a slower negative ADC response than at 7T remain to be investigated.
Rs-FC: Anti-correlations in BOLD rs-FC may be of purely vascular origin14,15, related to arteriolar vasoconstriction and reduced oxygenation in areas of suppressed neural firing, while positive correlations can be expected to have a neuronal origin. Our findings of primarily reduced anti-correlations and maintained positive correlations in dfMRI rs-FC vs BOLD support this hypothesis and bring further evidence that the dfMRI signal is largely free of vascular effects, in agreement with previous findings in the rodents16,17.
Taken together, our task and resting-state results support the existence and detectability of genuine dfMRI contrast distinct from BOLD mechanisms. Future work will focus on investigating the responses beyond our currently defined visual and motor primary regions and thereby improving the spatial characterization of the dfMRI signal, including its signature in white matter. While our FC analysis here was done with global signal regression, we plan to perform ICA-based cleaning instead.
Acknowledgements
This work was supported by the SNSF under award CRSK-2_190882 and was made possible thanks to the CIBM Center for Biomedical Imaging, founded and supported by Lausanne University Hospital (CHUV), University of Lausanne (UNIL), Ecole Polytechnique Federale de Lausanne (EPFL), University of Geneva (UNIGE) and Geneva University Hospitals (HUG).References
- Darquié, A., Poline, J. B., Poupon, C., Saint-Jalmes, H., & Le Bihan, D. (2001). Transient decrease in water diffusion observed in human occipital cortex during visual stimulation. Proceedings of the National Academy of Sciences, 98(16), 9391-9395.
- Miller, K. L., Bulte, D. P., Devlin, H., Robson, M. D., Wise, R. G., Woolrich, M. W., ... & Behrens, T. E. (2007). Evidence for a vascular contribution to diffusion FMRI at high b value. Proceedings of the National Academy of Sciences, 104(52), 20967-20972.
- Bai, R., Stewart, C. V., Plenz, D., & Basser, P. J. (2016). Assessing the sensitivity of diffusion MRI to detect neuronal activity directly. Proceedings of the National Academy of Sciences, 113(12), E1728-E1737.
- Uğurbil, K., Xu, J., Auerbach, E. J., Moeller, S., Vu, A. T., Duarte-Carvajalino, J. M., ... & Strupp, J. (2013). Pushing spatial and temporal resolution for functional and diffusion MRI in the Human Connectome Project. Neuroimage, 80, 80-104.
- Veraart, J., Novikov, D. S., Christiaens, D., Ades-Aron, B., Sijbers, J., & Fieremans, E. (2016). Denoising of diffusion MRI using random matrix theory. Neuroimage, 142, 394-406.
- Ades-Aron, B., Lemberskiy, G., Veraart, J., Golfinos, J., Fieremans, E., Novikov, D. S., & Shepherd, T. (2020). Improved Task-based Functional MRI Language Mapping in Patients with Brain Tumors through Marchenko-Pastur Principal Component Analysis Denoising. Radiology, 200822.
- Andersson, J. L., Skare, S., & Ashburner, J. (2003). How to correct susceptibility distortions in spin-echo echo-planar images: application to diffusion tensor imaging. Neuroimage, 20(2), 870-888.
- Avants, B. B., Tustison, N., & Song, G. (2009). Advanced normalization tools (ANTS). Insight j, 2(365), 1-35.
- Jin, T., & Kim, S. G. (2008). Functional changes of apparent diffusion coefficient during visual stimulation investigated by diffusion-weighted gradient-echo fMRI. Neuroimage, 41(3), 801-812.
- Yacoub, E., Uludağ, K., Uğurbil, K., & Harel, N. (2008). Decreases in ADC observed in tissue areas during activation in the cat visual cortex at 9.4 T using high diffusion sensitization. Magnetic resonance imaging, 26(7), 889-896.
- Tsurugizawa, T., Ciobanu, L., & Le Bihan, D. (2013). Water diffusion in brain cortex closely tracks underlying neuronal activity. Proceedings of the National Academy of Sciences, 110(28), 11636-11641.
- De Luca, A., Schlaffke, L., Siero, J. C., Froeling, M., & Leemans, A. (2019). On the sensitivity of the diffusion MRI signal to brain activity in response to a motor cortex paradigm. Human brain mapping, 40(17), 5069-5082.
- Nunes, D., Gil, R., & Shemesh, N. (2020). A rapid-onset diffusion functional MRI signal reflects neuromorphological coupling dynamics. arXiv preprint arXiv:2001.08508.
- Devor, A., Tian, P., Nishimura, N., Teng, I. C., Hillman, E. M., Narayanan, S. N., ... & Dale, A. M. (2007). Suppressed neuronal activity and concurrent arteriolar vasoconstriction may explain negative blood oxygenation level-dependent signal. Journal of Neuroscience, 27(16), 4452-4459.
- Bianciardi, M., Fukunaga, M., Van Gelderen, P., De Zwart, J. A., & Duyn, J. H. (2011). Negative BOLD-fMRI signals in large cerebral veins. Journal of Cerebral Blood Flow & Metabolism, 31(2), 401-412.
- Jelescu IO, Resting-state diffusion fMRI bears strong resemblance and only subtle differences to BOLD fMRI. ISMRM 2019.
- Abe, Y., Takata, N., Sakai, Y., Hamada, H. T., Hiraoka, Y., Aida, T., ... & Tanaka, K. F. (2020). Diffusion functional MRI reveals global brain network functional abnormalities driven by targeted local activity in a neuropsychiatric disease mouse model. NeuroImage, 223, 117318.
Figures
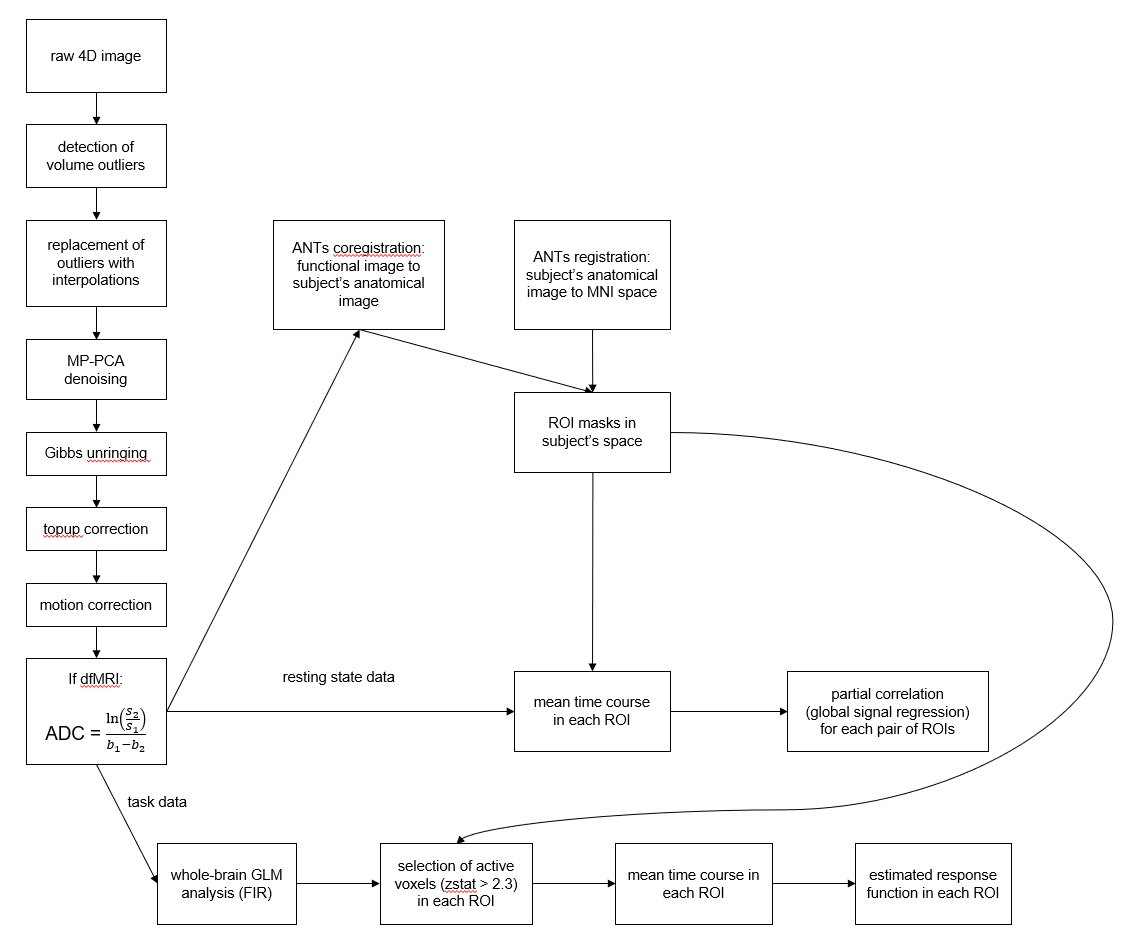
Fig 1: The employed
processing pipeline. Data pre-processing included denoising5,6 and corrections for susceptibility distortion7 and motion. For the
apparent diffusion coefficient (ADC) calculation, Si is the signal level
measured with diffusion-weighting bi.
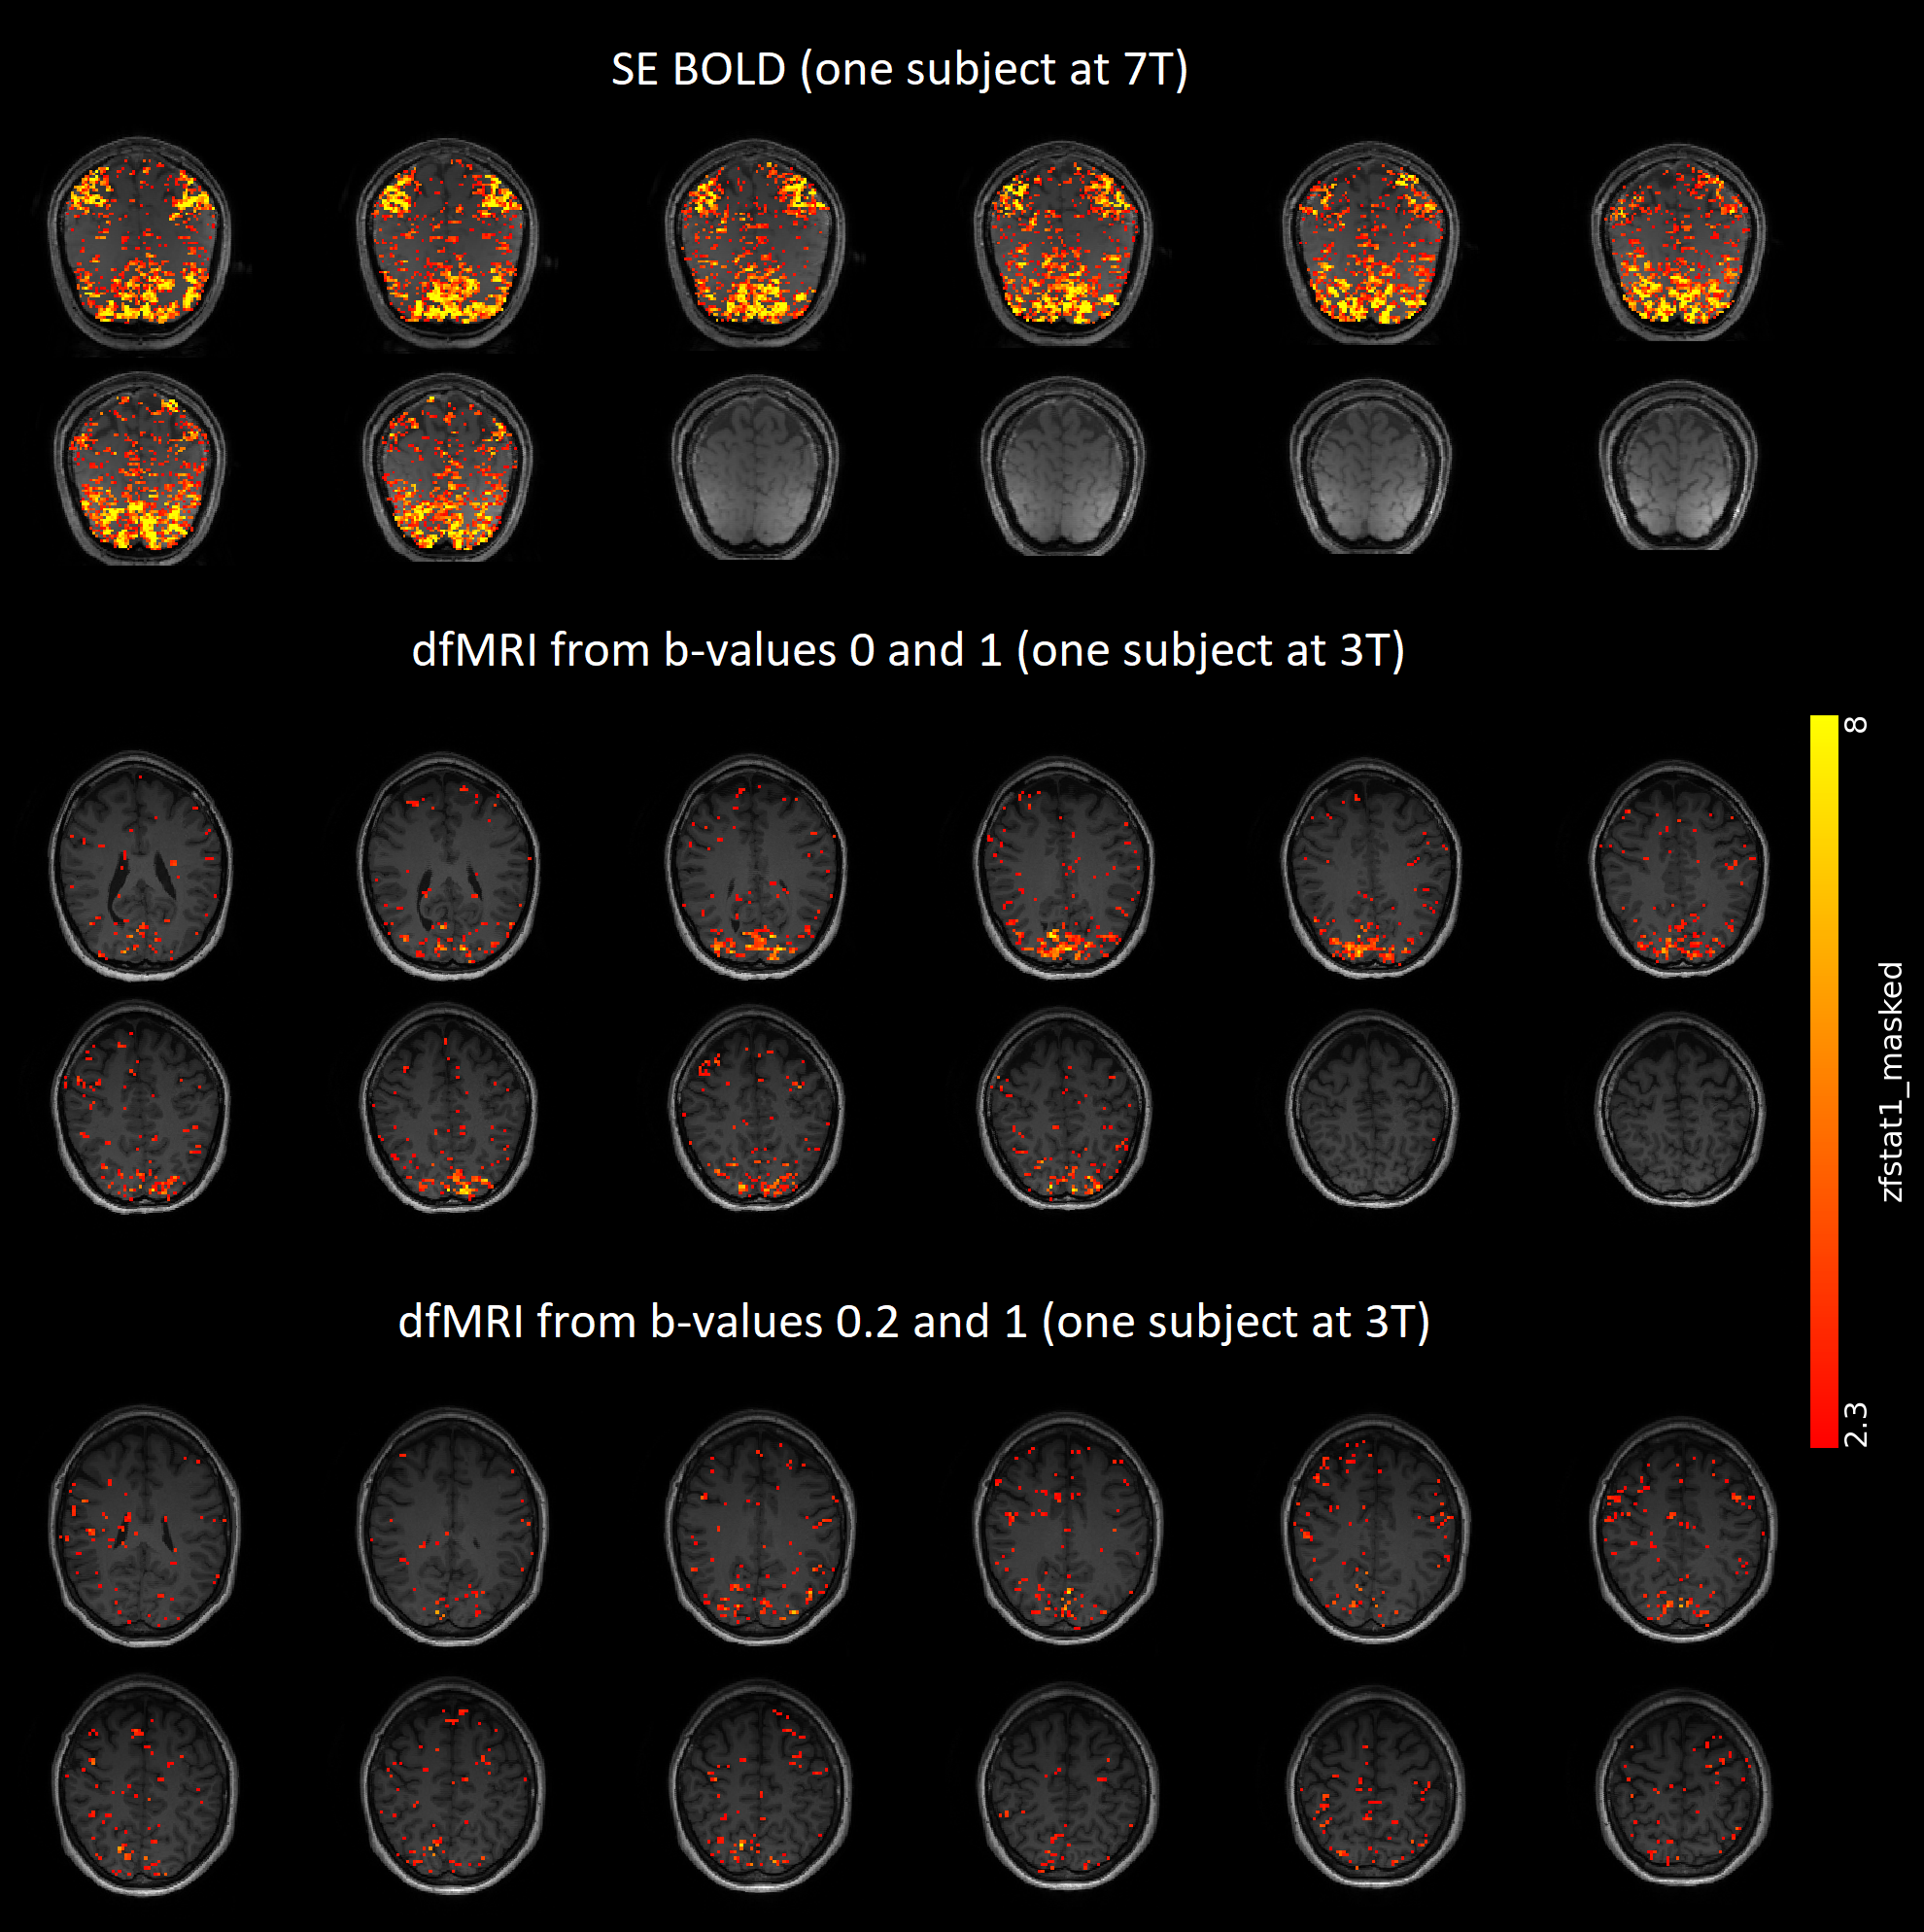
Fig 2: Whole-brain single-subject GLM results for SE
BOLD and dfMRI. In order to find activation without making assumptions about
the shape of the response functions, a Finite Impulse Response (FIR) set was
used. Significance was assessed with F-tests on the FIR regressors. The
F-statistic maps were converted to the displayed z-statistic maps, which were
additionally truncated at 2.3. Activation in visual and motor cortices was
observed for all three modalities.
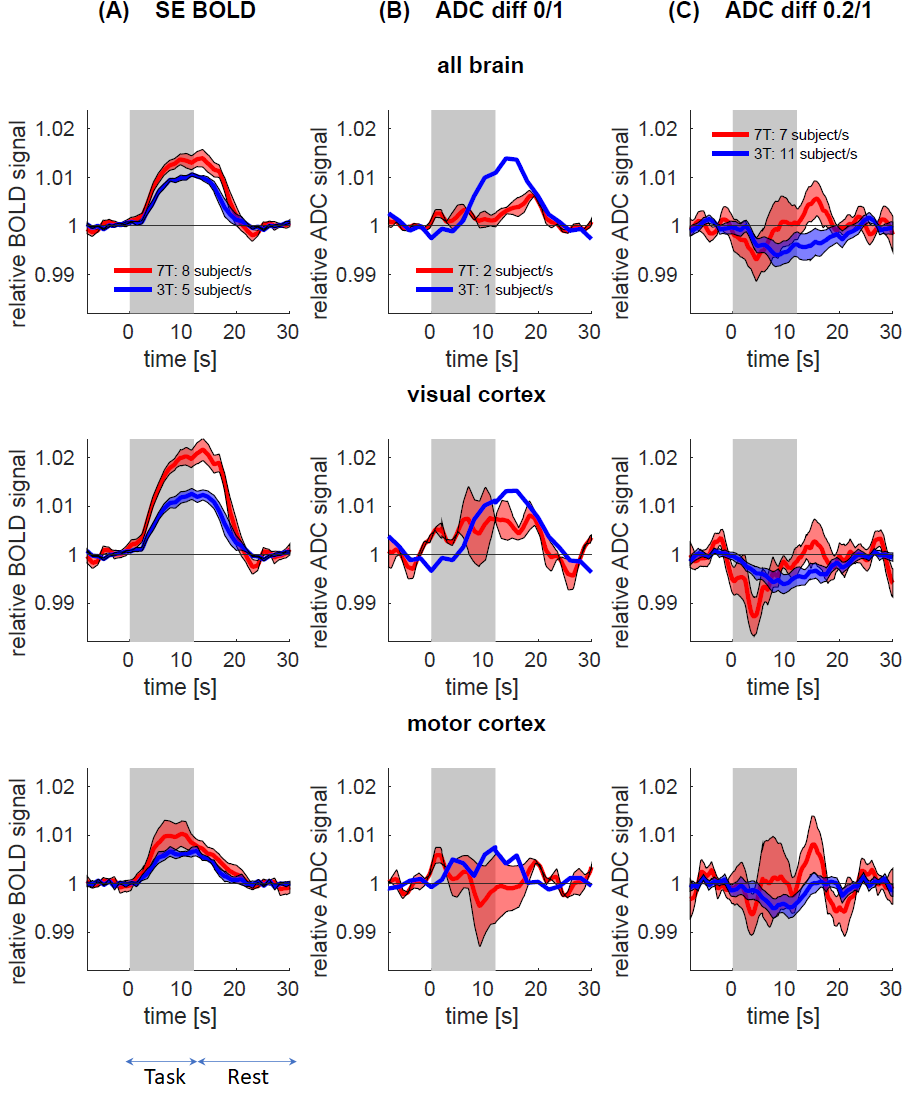
Fig 3: Estimated response functions for SE BOLD (A), dfMRI from b=0/1 pairs (B) and b=0.2/1 pairs
(C), at 3T and 7T. For each subject, the average time course of voxels with
Z>2.3 in each of the ROIs was averaged across trials. Subject-level
estimates were then normalized to their baseline level and averaged across the
cohort (shaded area: SEM). ADC from
b=0/1 increases during task. Conversely, ADC from b=0.2/1 decreases during task,
with an amplitude consistent between 3T and 7T, but the timing is different:
faster drop and restoration of ADC at 7T vs a slower response at 3T.
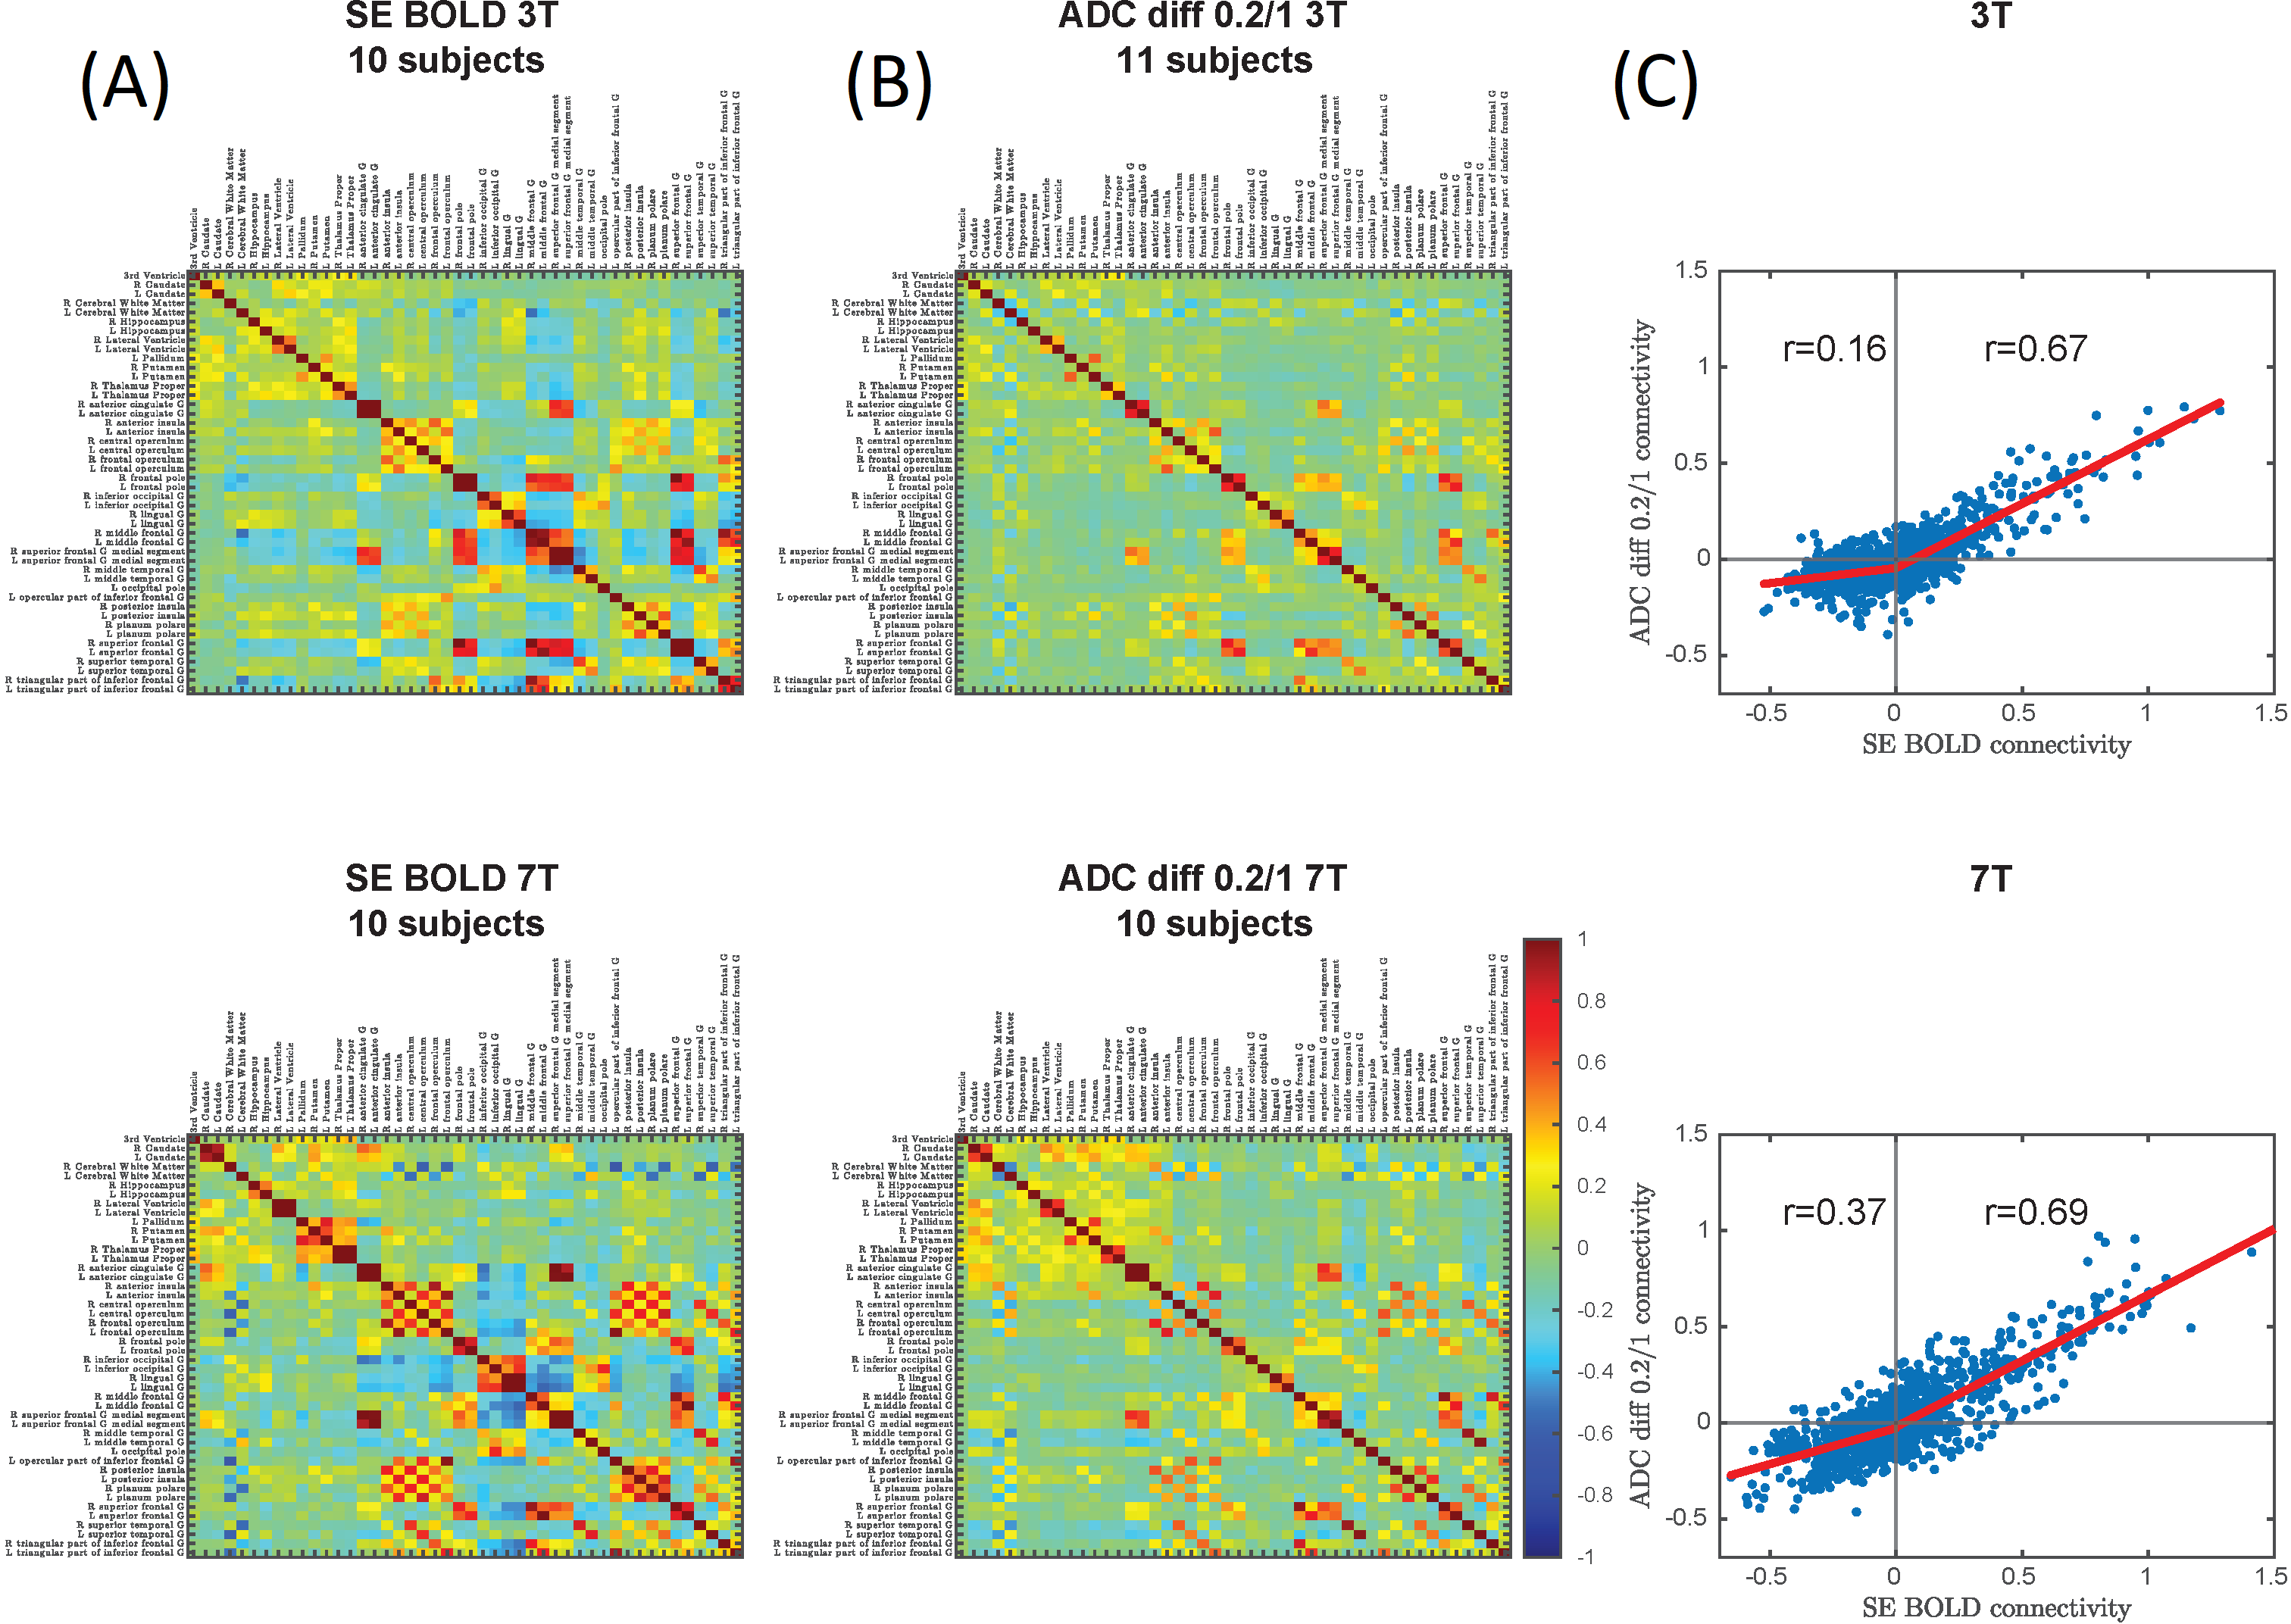
Fig 4: Group averages of Fisher-transformed FC
matrices from SE-BOLD (A) and b=0.2/1 ADC (B) at 3T and 7T. (C) Correlation of
FC strength derived from SE-BOLD vs dfMRI. Positive correlations were somewhat
less pronounced in dfMRI compared to BOLD (r ~ 0.7 for both 3T and 7T), but
anti-correlations were attenuated preferentially in dfMRI, particularly at 3T
(r=0.16).