0455
Intracranial Vessel Wall Segmentation with 2.5D UNet++ Deep Learning Network1Bioengineering, University of California, Los Angeles, Los Angeles, CA, United States, 2Cedars-Sinai Medical Center, Los Angeles, CA, United States, 3Radiation Oncology, University of California, Los Angeles, Los Angeles, CA, United States, 4Radiology, University of Southern California, Los Angeles, CA, United States, 5Radiation Oncology, University of Southern California, Los Angeles, CA, United States
Synopsis
Intracranial vessel wall segmentation is an essential step for the intracranial atherosclerosis quantification. We have developed an automated intracranial vessel wall segmentation method based on deep learning that utilized a 2.5D UNet++ network structure with a loss function consists of both soft Dice coefficient loss and the approximated Hausdorff distance loss. We show that we have achieved significant improvements over our previous segmentation model based on a 2D UNet structure across various quantitative measures, as well as a better visual resemblance to the ground truth segmentation.
INTRODUCTION
MR vessel wall imaging (VWI) is an emerging modality for assessing intracranial atherosclerosis disease (ICAD). The geometric plaque features derived from MR VWI have shown great promise in diagnosis and risk stratification of ICAD. Vessel wall segmentation is an essential step of geometric quantification but is currently performed in a tedious and variation-prone manual fashion. Several groups have recently presented deep-learning-based approaches to automated segmentation.1,2 The present work aims to further improve the performance of a recently proposed 2D segmentation network1 by 1) the utilization of a 2.5D structure to balance network complexity and geometry continuity; 2) a UNet++ model for a structure adaptation;3 and 3) an additional approximated Hausdorff distance (HD) loss into the objective to encourage geometry conformality.4METHODS
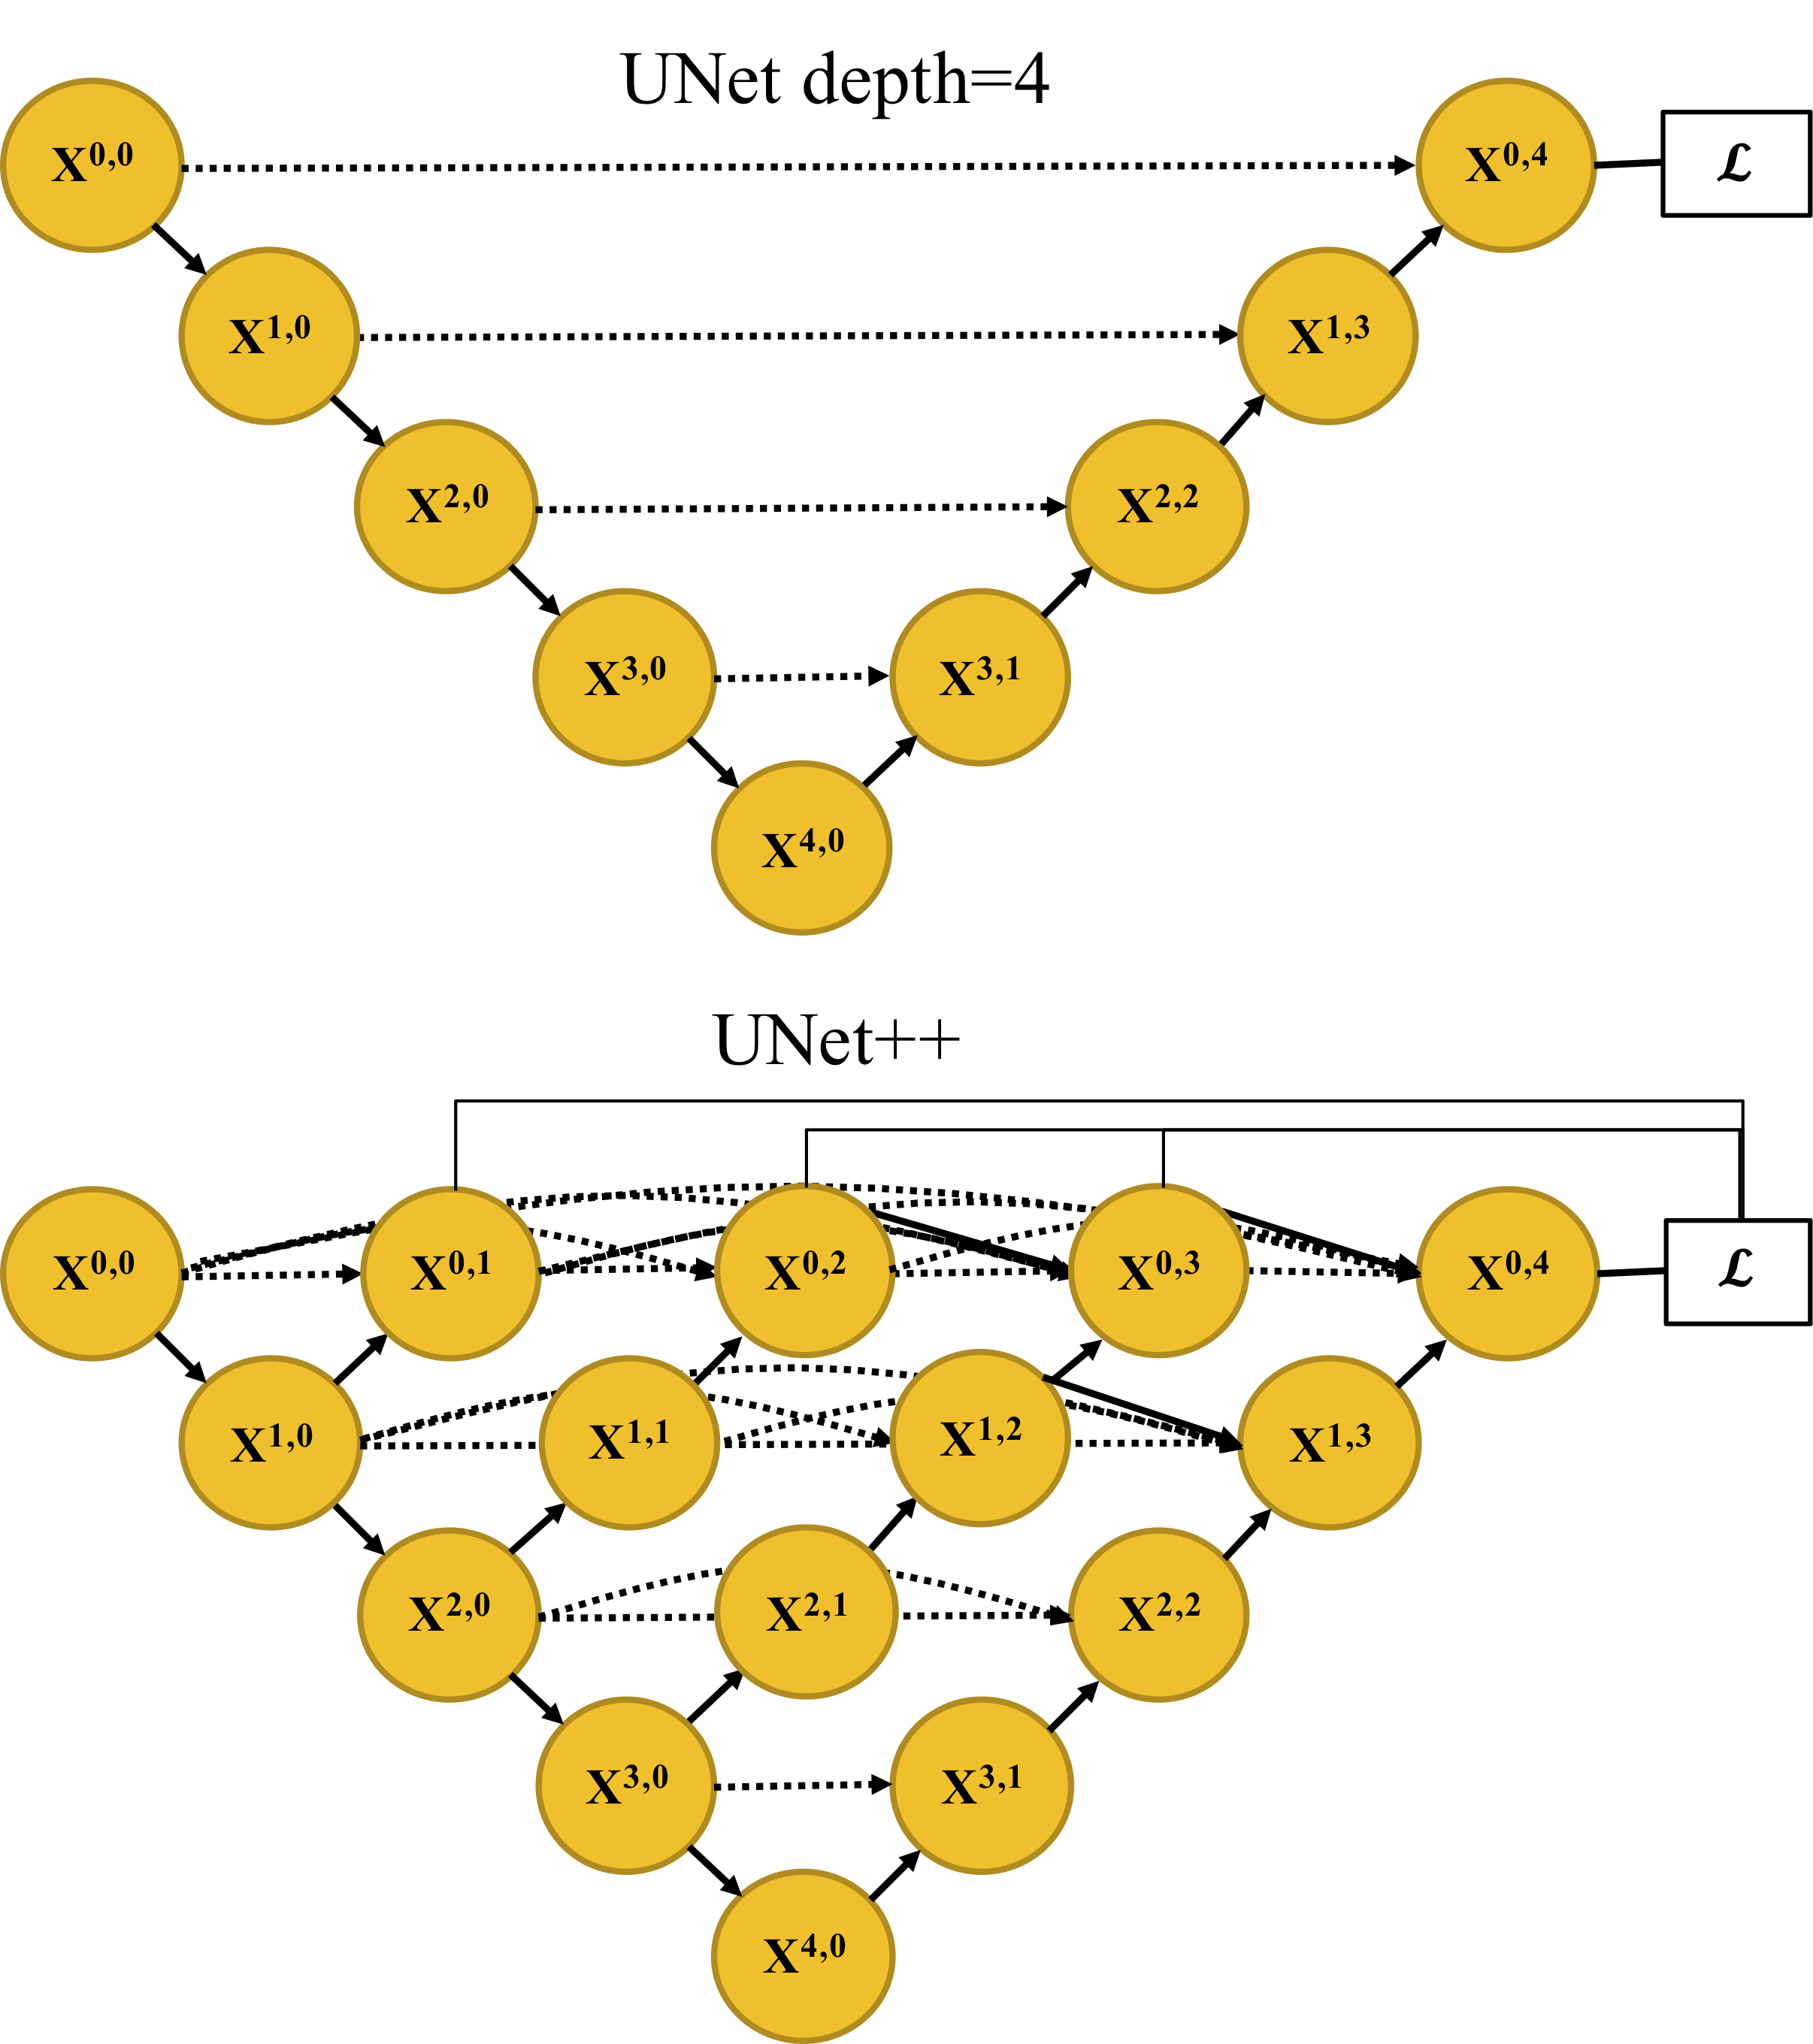
Network design: UNet++ was proposed for 1) efficiently training an ensemble of UNets with multiple depths, and 2) establishing dense and more effective skip connections among varying semantic scales of the network.3 We used deep supervision and minimized the summation of soft Dice coefficient (DC) loss from each sub-decoder: $$ L_{DC}(p,y)=∑_{i=1}^D[1-\frac{1}{N} ∑_{c=1}^C∑_{n=1}^N\frac{2p_{n,c} \cdot y_{n,c}^i}{p_{n,c}^2 +{y_{n,c}^{i}}^2}], (1) $$ where yn,c and pn,c is the prediction of pixel n for class c and the ground truth, respectively; N is the total number of pixels in a batch, C is the number of classes, and D is the total number of sub-decoders. We also incorporated the distance-transform (DT)-approximated Hausdorff distance (HD) loss to directly minimize the largest point-wise matching discrepancy.4 $$ L_{HD}(p,y)=\frac{1}{N}∑_{i,c,n}(p_{n,c} - y_{n,c}^i)^2 \cdot(DT_{p_{n,c}}^2+DT_{y_{n,c}^i}^2), (2) $$ where the DT of a binary image X is: $$DT_{X}[i,j]=\min_{k,l}d([i,j], [k,l]). (3) $$ Here, [k, l] is the indices of the foreground pixels, and d denotes the Euclidean distance. The overall loss function consists of the two terms (1) and (2) with a hyperparameter controlling the trade-off. Fig. 1 illustrates the UNet with a depth of four and the UNet++ network structure. Specifically, we input three consecutive MR slices and predict the label of the middle slice for a 2.5D network.Data preparation: Under IRB approval, we obtained MR VWI from 30 patients diagnosed with ICAD. All imaging data were acquired on a 3-Tesla system (MAGNETOM Prisma; Siemens Healthcare, Erlangen, Germany) equipped with a 64-channel head/neck coil. The acquired spatial resolution was isotropic 0.55 mm. In each patient, four vessel segments (i.e., the intracranial internal carotid artery, the middle cerebral artery, the intracranial vertebral artery, and the basilar artery) were included. From each of them, 30 contiguous 2D cross-sectional slices with 0.55 mm slice thickness and 0.10 mm in-plane resolution were generated using the 3D Slicer.5 The ground truth lumen and vessel wall were labeled by an experienced radiologist using ITK-SNAP.6
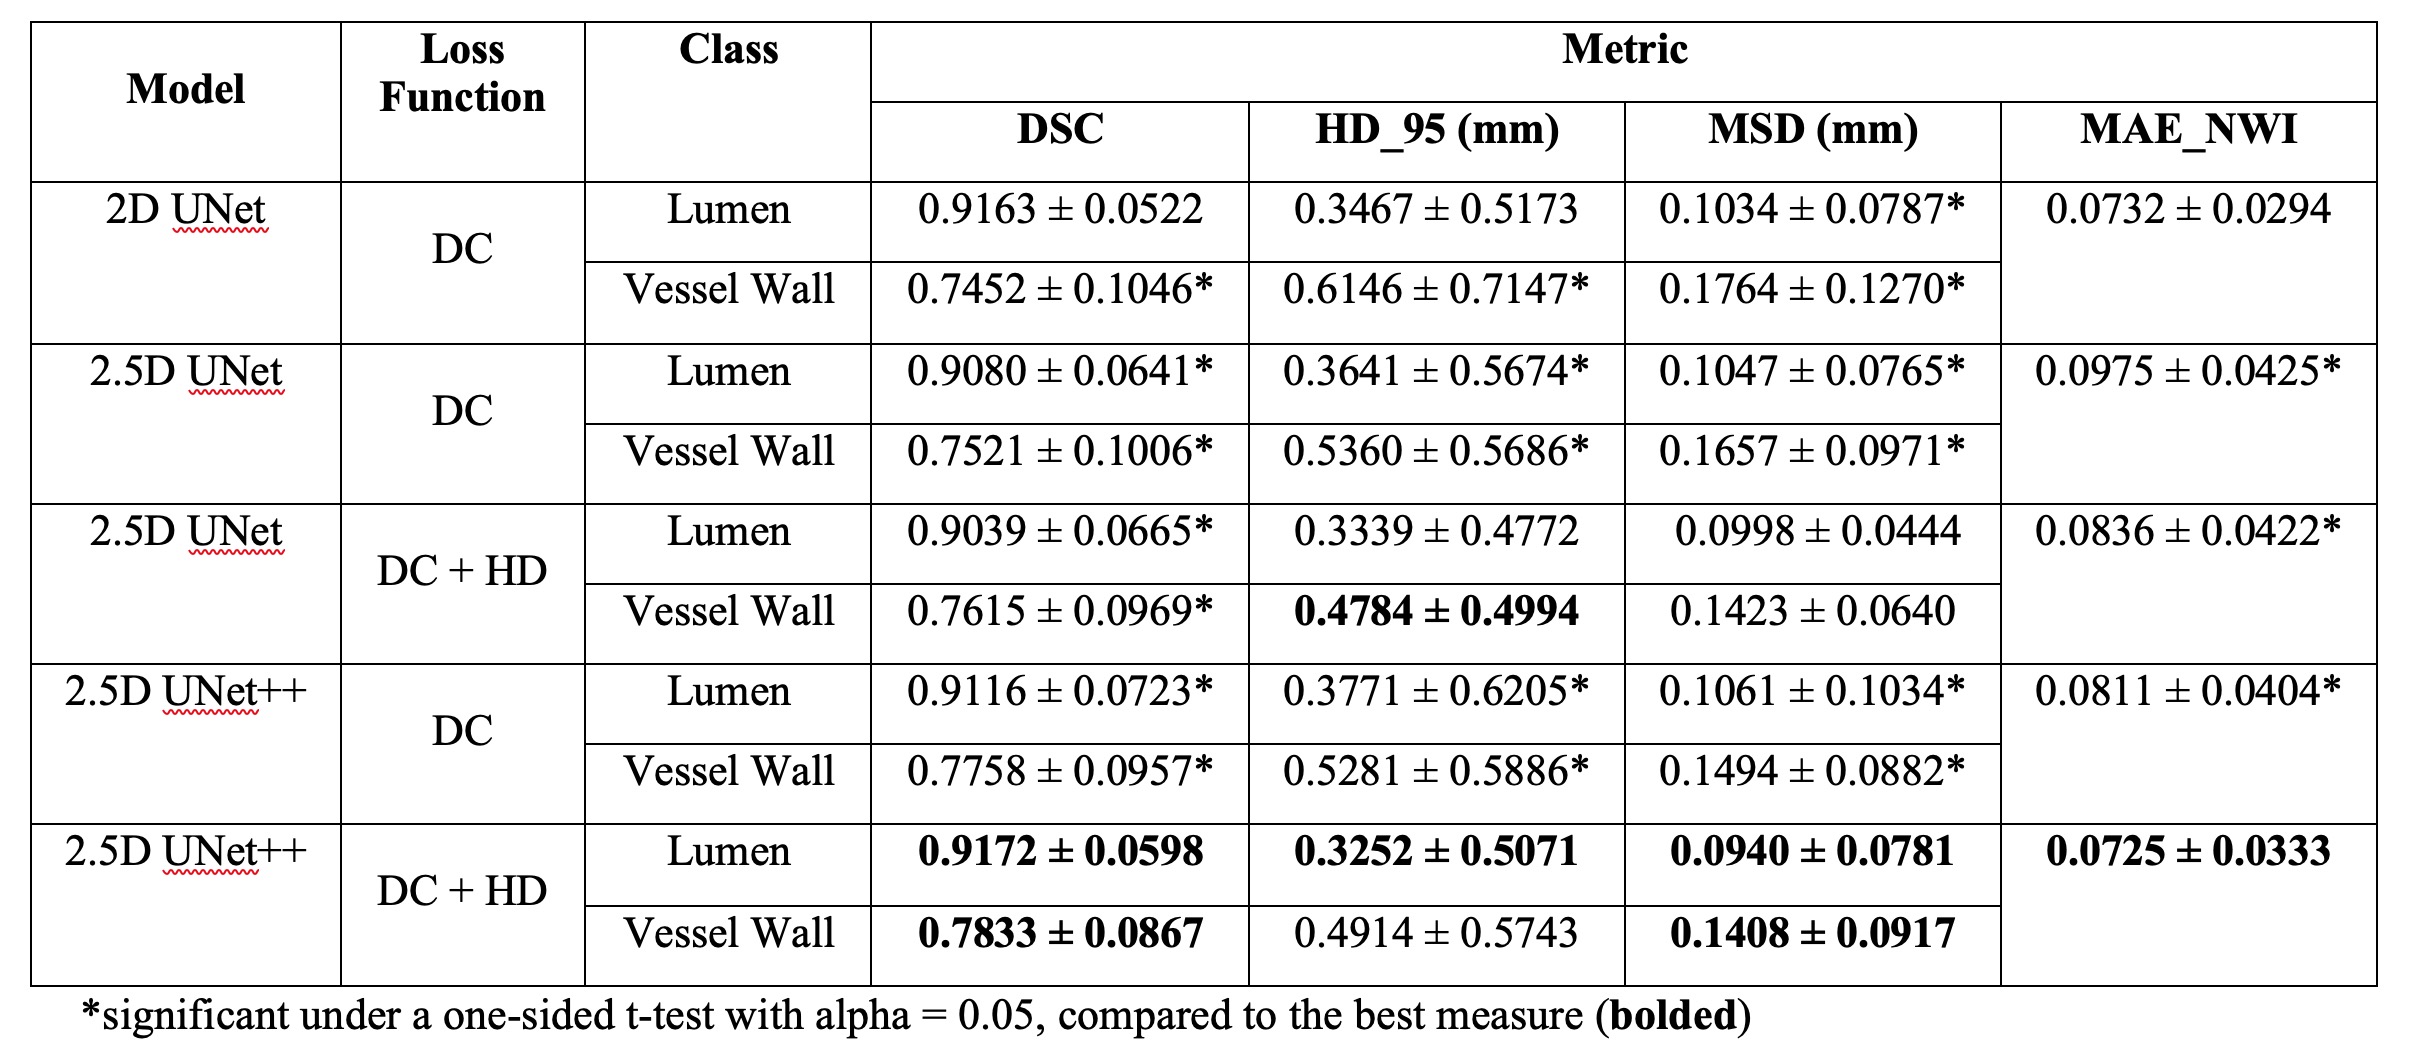
Network evaluation: We split the 30 subjects into 27 for training, 3 for validation, and 3 for testing, respectively. The performance was evaluated using following metrics: 1) Dice similarity coefficient (DSC), 2) 95 percentile HD (HD_95), 3) mean surface distance (MSD) from the prediction to the ground truth, and 4) the mean absolute error (MAE) of a morphological feature - the normalized wall index (NWI)7,8, in comparison with other alternatives of ablation. A one-sided t-test under alpha = 0.05 was applied to the results by each model, compared to the best measure for the lumen and vessel wall, respectively.
RESULTS
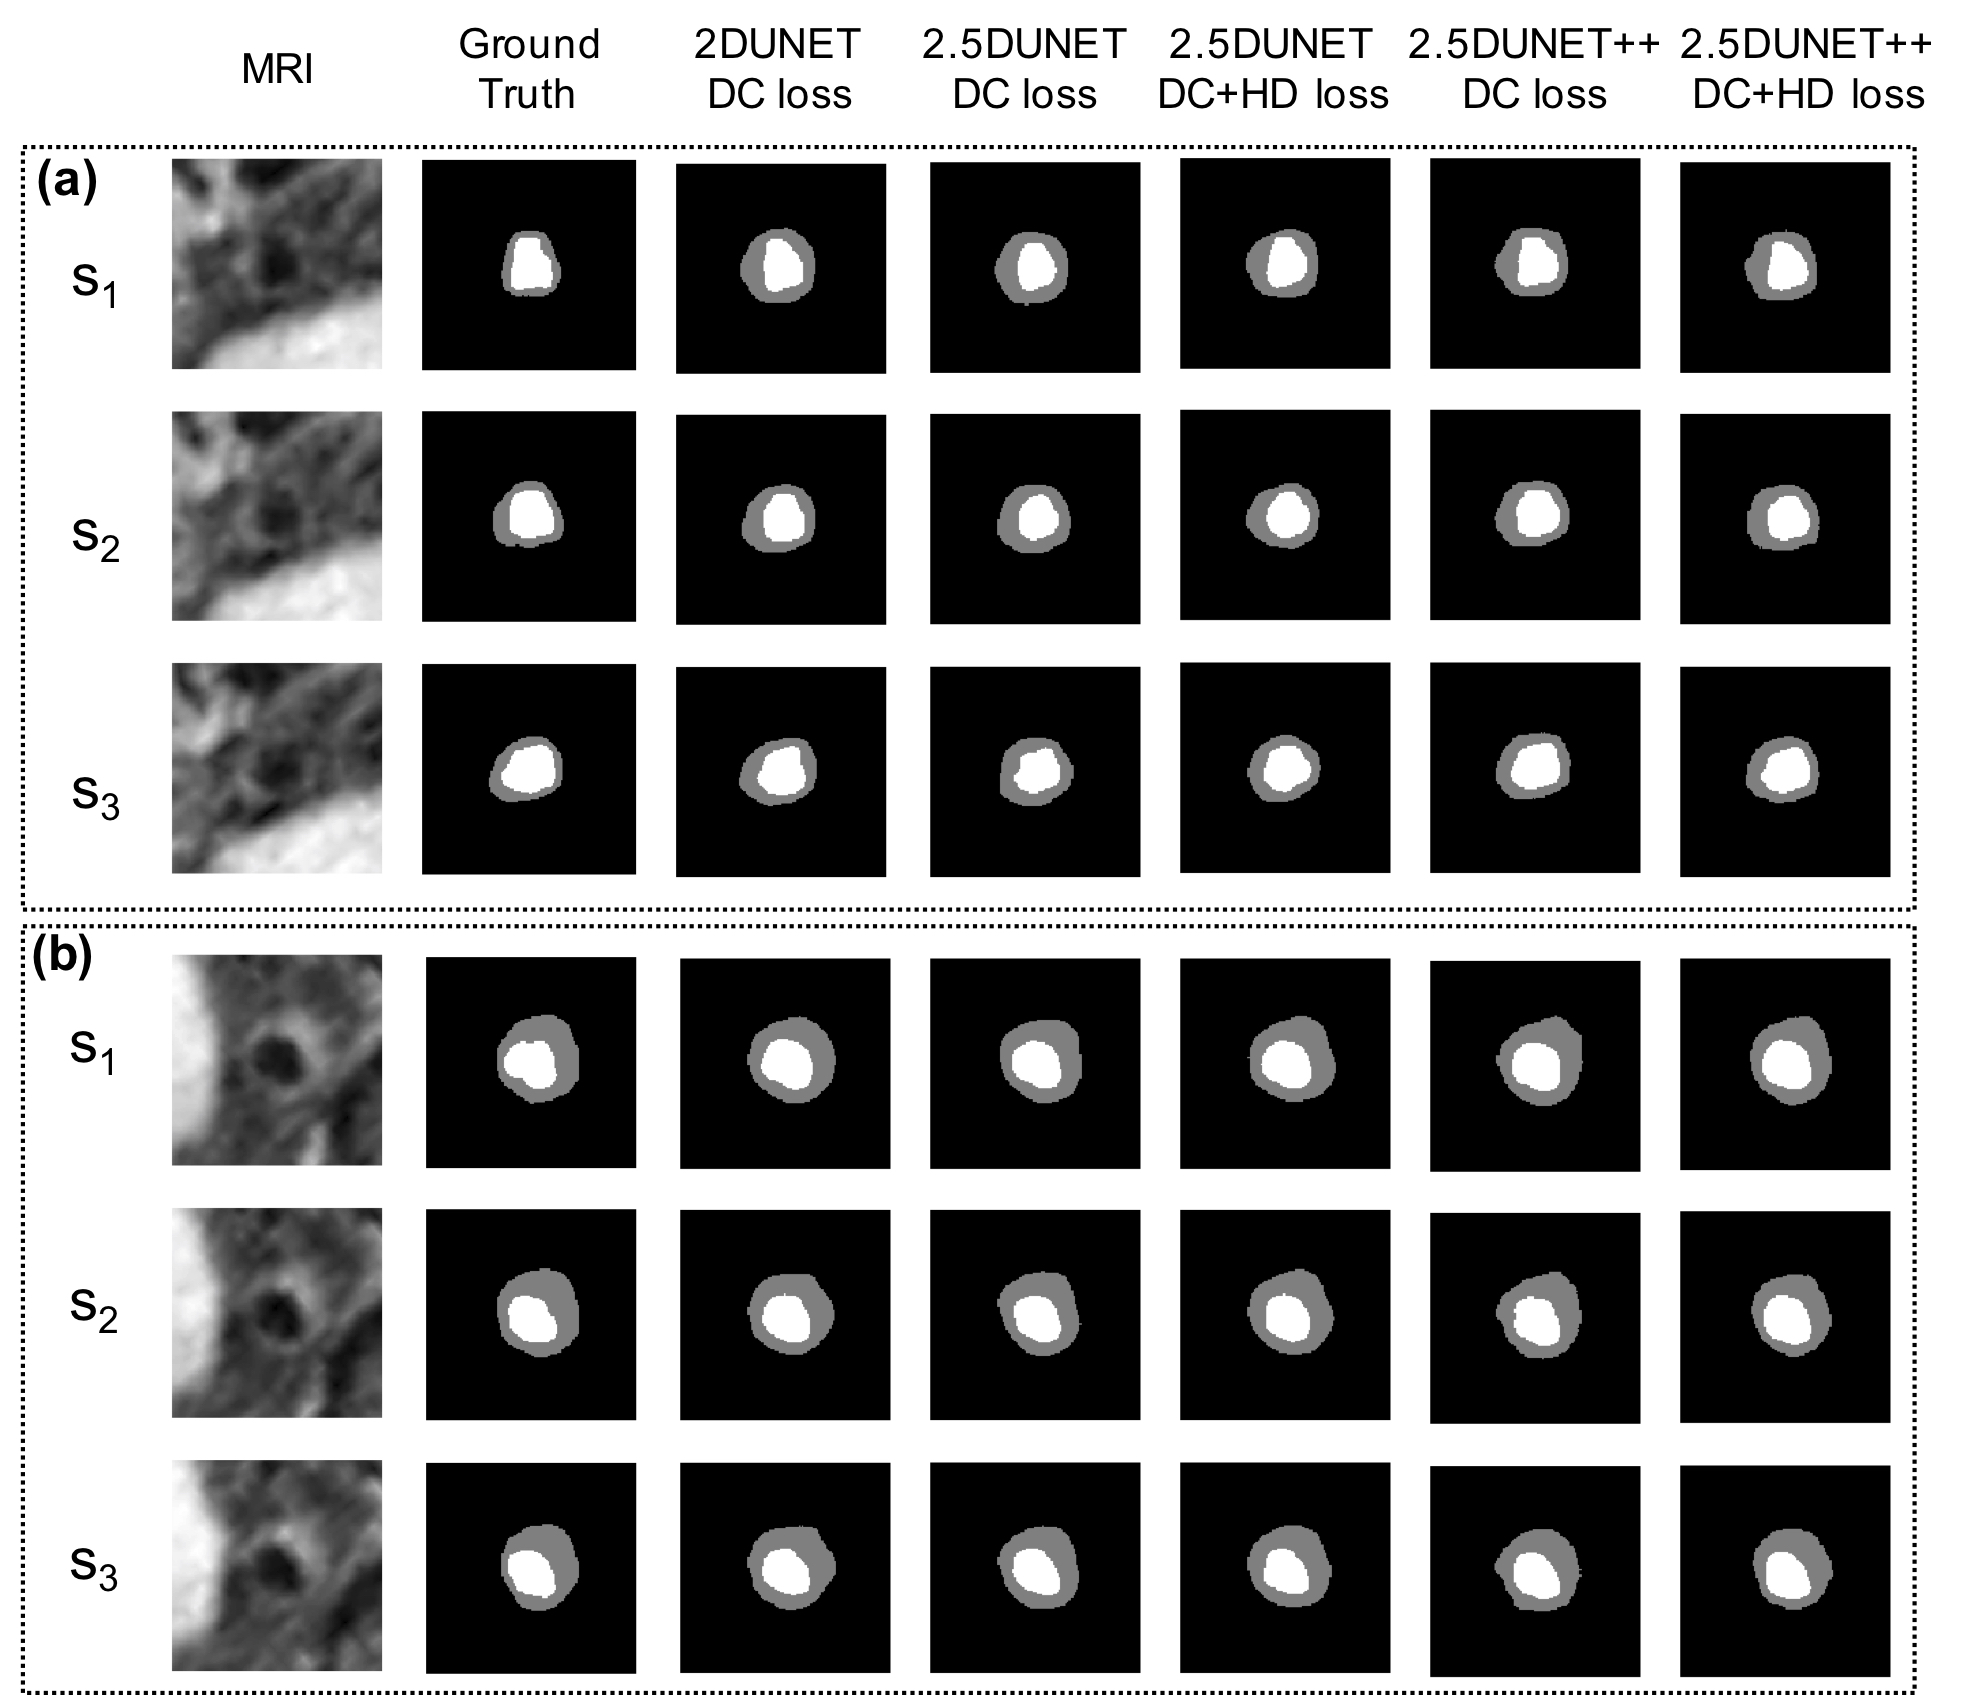
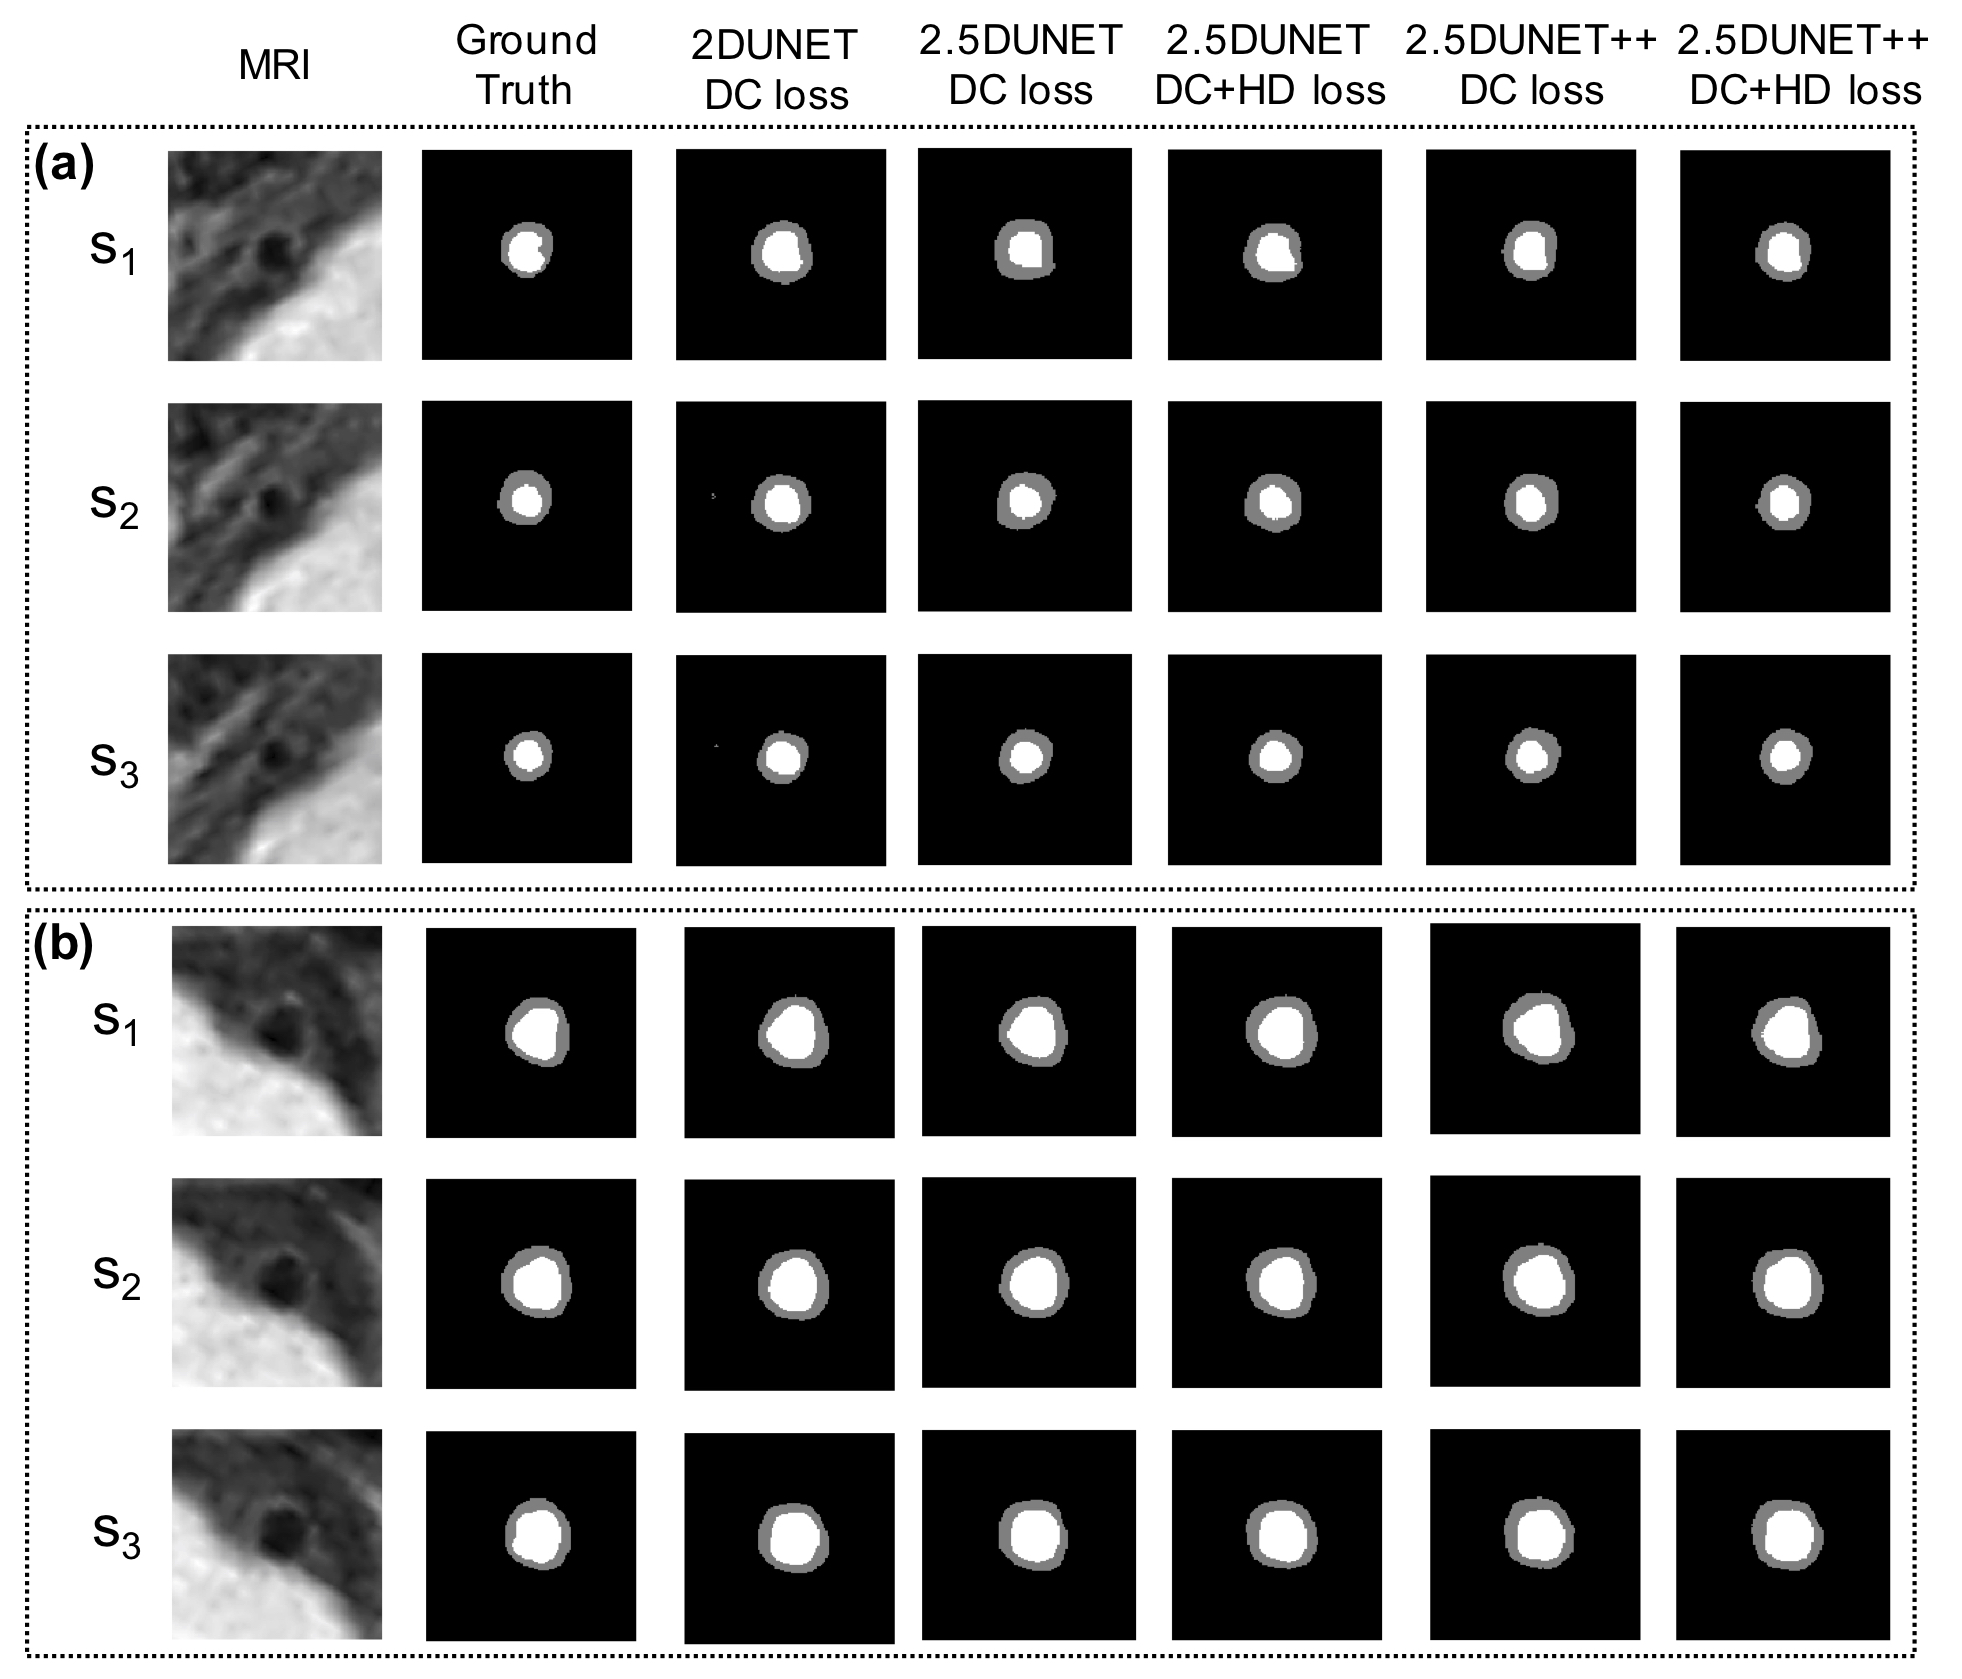
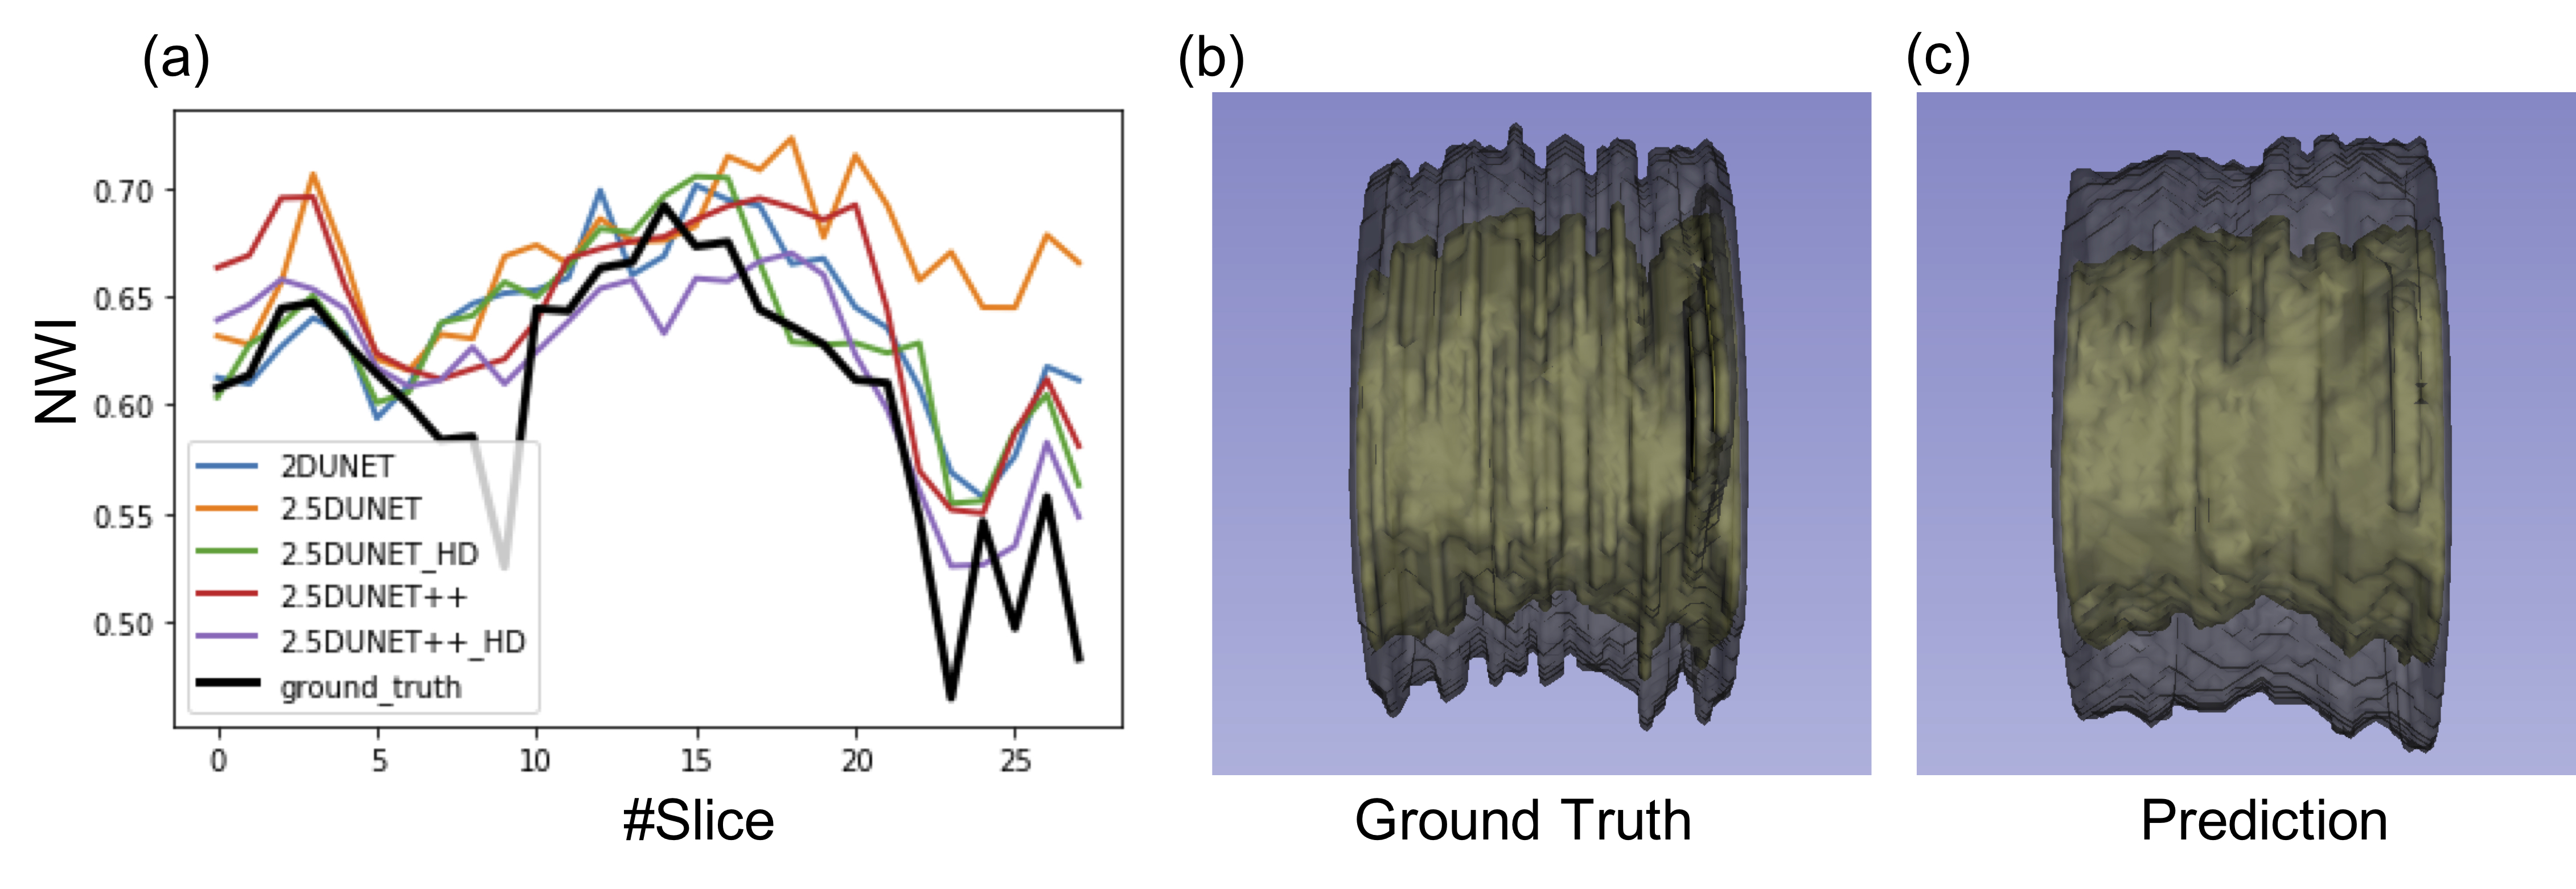
TABLE I. reports the mean and the standard deviation of the testing vessel segments. The 2.5D UNet++ achieved DSC of 0.9116 ± 0.0723 and 0.7758 ± 0.0957, HD of 0.3771 ± 0.6205 mm and 0.5281 ± 0.5886 mm, and MSD of 0.1061 ± 0.1034 mm and 0.1494 ± 0.0882 mm for the lumen and vessel wall, respectively. These results compare favorably to the original 2D UNet that achieved DSC 0.9163 ± 0.0522 and 0.7452 ± 0.1046, HD 0.3467 ± 0.5173 mm and 0.6146 ± 0.7147 mm, and MSD 0.1034 ± 0.0787 mm and 0.1764 ± 0.1270 mm, respectively. The addition of the HD loss term further significantly boosted the 2.5D UNet++ performance to DSC 0.9172 ± 0.0598 and 0.7833 ± 0.0867, HD 0.3252 ± 0.5071 mm and 0.4914 ± 0.5743 mm, MSD 0.0940 ± 0.0781 mm and 0.1408 ± 0.0917 mm, respectively. Fig. 2 and Fig. 3 illustrate the qualitative model performance comparison where the proposed method achieved the best resemblance to the ground truth and a similar appearance across the methods, respectively. Fig. 4 illustrates the predicted NWI error of an example segment that contains 30 slices by each model and the 3D visualization by the proposed method.DISCUSSION
A 2.5D-UNet++ structure with a loss function composed of soft Dice coefficient loss and Hausdorff distance loss yields universal improvements in various metrics in the intracranial vessel segmentation. The addition of the HD loss term further helps reshape the class boundaries to better conform to the ground truth segmentation. The significant reduction of error in NWI with the HD term addition suggests the HD is a good surrogate objective to boost the NWI estimate. Additionally, the NWI error reduction of the proposed method was not significant compared to the baseline 2D UNet suggests that a more consistent labeling process may be needed. Further investigation is warranted to differentiate the NWI oscillations introduced by local plaque vs. observer inconsistency.Acknowledgements
This work is supported in part by NIH/NHLBI R01 HL147355.References
1. Shi F, Yang Q, Guo X, et al. Intracranial Vessel Wall Segmentation Using Convolutional Neural Networks. IEEE Trans Biomed Eng. 2019;66(10):2840-2847. doi:10.1109/TBME.2019.2896972
2. Han K. Deep-learning based Significant Stenosis detection from Multiplanar reformatted Images of traced Intracranial arteries. In: ; 2019.
3. Zhou Z, Siddiquee MMR, Tajbakhsh N, Liang J. UNet++: Redesigning Skip Connections to Exploit Multiscale Features in Image Segmentation. IEEE Trans Med Imaging. 2019:1-1. doi:10.1109/tmi.2019.2959609
4. Karimi D, Salcudean SE. Reducing the Hausdorff Distance in Medical Image Segmentation with Convolutional Neural Networks. IEEE Trans Med Imaging. 2020;39(2):499-513. doi:10.1109/TMI.2019.2930068
5. Kikinis R, Pieper SD, Vosburgh KG. 3D Slicer: A Platform for Subject-Specific Image Analysis, Visualization, and Clinical Support. In: Intraoperative Imaging and Image-Guided Therapy. Springer New York; 2014:277-289. doi:10.1007/978-1-4614-7657-3_19
6. Yushkevich PA, Piven J, Hazlett HC, et al. User-guided 3D active contour segmentation of anatomical structures: Significantly improved efficiency and reliability. Neuroimage. 2006;31(3):1116-1128. doi:10.1016/j.neuroimage.2006.01.015
7. Saam T, Yuan C, Chu B, et al. Predictors of carotid atherosclerotic plaque progression as measured by noninvasive magnetic resonance imaging. Atherosclerosis. 2007;194(2):e34. doi:10.1016/j.atherosclerosis.2006.08.016
8. Zhu C, Teng Z, Sadat U, et al. Normalized wall index specific and MRI-based stress analysis of atherosclerotic carotid plaques: A study comparing acutely symptomatic and asymptomatic patients. Circ J. 2010;74(11):2360-2364. doi:10.1253/circj.CJ-10-0305
Figures