0454
Prediction of aneurysm stability using a machine learning model based on 4D-Flow MRI and Black Blood MRI1Center for Biomedical Imaging Research, Department of Biomedical Engineering, Tsinghua University, Beijing, China
Synopsis
The rupture of intracranial aneurysm (IA) is the most common cause of subarachnoid hemorrhage (SAH), resulting in patient death and disability. Recently, the morphology of the aneurysm, wall condition as well as hemodynamic factors were found to have kind of relationship with the stability of the aneurysm. In this project, we extracted clinical characteristics, morphology parameters, wall condition and hemodynamic parameters together to predict aneurysm stability using a machine learning model based on 4D-Flow MRI and black blood MRI. Among the two models, the Support Vector Machines model performed well, and the multi-parameter prediction result was greater than 95%.
Introduction
The rupture of intracranial aneurysm (IA) is the most common cause of subarachnoid hemorrhage (SAH), resulting in patient death and disability.1 The morphology of the aneurysm and the clinical characteristics of the patients are closely related with the stability of the aneurysm.2-3 Recently, wall condition4 as well as hemodynamic5 factors, such as aneurysm wall enhancement (AWE), flow, velocity and wall shear stress (WSS) were found to have kind of relationship with the stability of the aneurysm. However, comprehensive information including clinical characteristics, morphology parameters, wall condition and hemodynamic parameters have not yet put together to predict aneurysm stability. Our work is to predict aneurysm stability using a machine learning model based on 4D-Flow MRI, black blood MRI and clinical characteristics.Methods
Study Population:70 patients with 72 IAs were included in this study. Written informed consents were obtained from all patients.
MR Experiments:
All MRI scan were performed on a 3.0T MRI scanner (Philips Achieva, Best, Netherlands) with a 32-channel head coil. 4D-flow MRI was used for hemodynamic evaluation. Scan parameters were: TR/TE = 8.0/3.6 ms, FOV = 160 x 160 x 30 mm3, voxel size = 1 x 1 x 1 mm3, VENC = 120 cm/s. The IA walls were imaged using a 3D black-blood T1-weighted volumetric isotropic turbo spin echo acquisition (T1-VISTA) sequence, The imaging parameters were as follows: TR/TE = 800/21 ms, FOV = 200 x 180 x 40 mm3, voxel size = 0.6 x 0.6 x 0.6 mm3. Post-contrast T1W-VISTA was performed about 6 min after an intravenous injection of GdDTPA at a dose of 0.1 mmol/kg. All imaging parameters were kept the same for the pre- and post-contrast-enhanced T1W-VISTA imaging.
Data Analysis:
Unstable aneurysms were defined as ruptured or symptomatic IAs.6 Black Blood MRI was used to monitor IA size, IA size ratio (SR) and AWE grades.4 To monitor the hemodynamic status in adjacent parent artery (APA) and inside aneurysm, we used 4D-Flow MRI. maximum through-plane velocity (Vmax-APA, cm/s) in APA, maximum through-plane velocity (Vmax-IA, cm/s) within aneurysm, maximum blood flow in APA (Flowmax-APA, ml/s), maximum blood flow in IA (Flowmax-IA, ml/s), Pulsatility index (PI) and average wall shear stress in IA (WSS, N/m2)were measured. All hemodynamic measurements were implemented at the time when peak velocity appears. Cross-sectional plane, which is perpendicular to the streamline containing the maximum velocity point with IA, was created. Contours were drawn manually. Parameters were measured in GTFlow, version 2.2.15 (GyroTools, Zurich, Switzerland), as shown in Figure.1. Aneurysms were randomly sampled into the training and testing sets (7:3). Two machine learning model models, General linear and ridge regression model (GLM) and Support Vector Machines (SVM) were applied to construct the whole IA stable prediction models. Receiver operating curves were built, and the areas under the curve (AUCs) of these models were compared. Statistical analysis:R (version 3.5.2) was used for statistical analysis and figure plotting. Categorical baseline characteristics and AWE grades were compared between stable and unstable groups using the χ2 test. Student t test were used for comparing the continuous variables (morphological features and hemodynamic parameters) between the stable and unstable groups. The level of statistical significance was set at p < 0.05.
Results
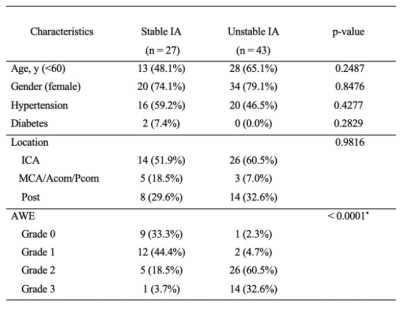
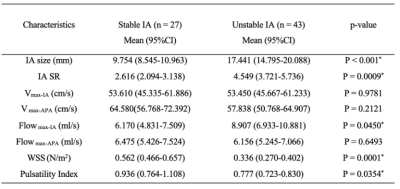
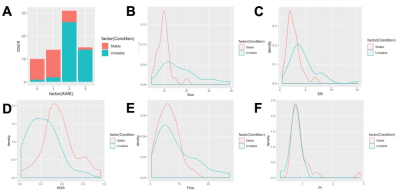
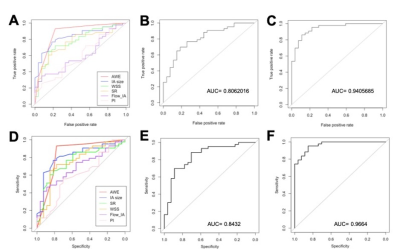
Table 1 presents a summary of the demographic and aneurysm enhancement. High AWE grades were more prevalent in the unstable group (P < 0.001). Morphological and hemodynamic features were compared between stable and unstable aneurysms and were summarized in Table 2. IA size (P<0.001), IA SR (P = 0.0009) and Flowmax-IA (P = 0.0450) were higher in unstable aneurysms than stable ones, whereas WSS (P = 0.0001) and PI (P = 0.0354) were lower. Figure.2 is the distribution of the significant features which related with stable/unstable IA. The performance of these two models was verified in a separate testing set. As for the single characteristic predict stable IA (AUCs from high to low), AUCs of GLM model were 0.876, 0.834, 0.774, 0.761, 0.601, 0.599 for AWE, IA size, WSS, IA SR, Flowmax-IA and PI, respectively. AUCs of SVM model were 0.833, 0.815, 0.753, 0.749, 0.692, 0.599 for AWE, IA size, IA SR, WSS,Flowmax-IA and PI, respectively. The results for the hemodynamic characteristics predict stable IA, AUCs of GLM model and SVM model were 0.806 and 0.842, respectively. As for the all six significant characteristics predict stable IA, AUCs of GLM model and SVM model were 0.941 and 0.966, respectively (Figure.3).Discussion and Conclusion
In this project, we extracted clinical characteristics, morphology parameters, wall condition and hemodynamic parameters together to predict aneurysm stability using a machine learning model based on 4D-Flow MRI and black blood MRI. Among the two models, the SVM model performed well, and the multi-parameter prediction result was greater than 95%. As for the single characteristic predict stable IA, AWE is the most important determinant. In the future, we could collect multimodality imaging data from a cohort in multiple centers would further improve the performance of the models.Acknowledgements
All authors have no conflicts of interest to report.References
1. Hijdra A, Vermeulen M, van Gijn J, van Crevel H. Rerupture of intracranial aneurysms: a clinicoanatomic study. J Neurosurg. 1987 Jul;67(1):29-33.
2. Tominari S, Morita A, Ishibashi T et al. Prediction model for 3-year rupture risk of unruptured cerebral aneurysms in Japanese patients. Ann Neurol. 2015 Jun;77(6):1050-9.
3. Greving JP, Wermer MJ, Brown RD Jr et al.. Development of the PHASES score for prediction of risk of rupture of intracranial aneurysms: a pooled analysis of six prospective cohort studies. Lancet Neurol. 2014 Jan;13(1):59-66.
4. Edjlali Myriam,Guédon Alexis,Ben Hassen Wagih et al. Circumferential Thick Enhancement at Vessel Wall MRI Has High Specificity for Intracranial Aneurysm Instability.[J] .Radiology, 2018, 289: 181-187.
5. Futami K, Kitabayashi T, Sano H et al. Inflow Jet Patterns of Unruptured Cerebral Aneurysms Based on the Flow Velocity in the Parent Artery: Evaluation Using 4D Flow MRI.[J] .AJNR Am J Neuroradiol, 2016, 37: 1318-23.
6. Liu Q, Jiang P, Jiang Y, Ge H, Li S, Jin H, Li Y. Prediction of Aneurysm Stability Using a Machine Learning Model Based on PyRadiomics-Derived Morphological Features. Stroke. 2019 Sep;50(9):2314-2321.
Figures


