0451
Fully automated aortic 4D flow MRI large-cohort analysis using deep learning
Michael B Scott1, Haben Berhane1, Justin Baraboo1, Cynthia K Rigsby2, Joshua D Robinson2, Patrick M McCarthy1, S Chris Malaisrie1, Ryan J Avery1, Bradley D Allen1, Alexander Barker3, and Michael Markl1
1Northwestern University, Chicago, IL, United States, 2Lurie Children's Hospital of Chicago, Chicago, IL, United States, 3University of Colorado, Anschutz Medical Campus, Aurora, CO, United States
1Northwestern University, Chicago, IL, United States, 2Lurie Children's Hospital of Chicago, Chicago, IL, United States, 3University of Colorado, Anschutz Medical Campus, Aurora, CO, United States
Synopsis
A fully automated pipeline using four convolutional neural networks was designed to perform analysis of aortic 4D flow MRI, including preprocessing (eddy current correction, noise masking, and antialiasing), 3D segmentation of the aorta, quantification of mean flow-time curves and peak velocities. The analysis pipeline was run on a total of 2084 4D flow MRI studies and compared against manual analysis in a subset of 69 studies. Median segmentation Dice score for the ascending aorta was 0.93 [0.90 – 0.95]. Pipeline-based quantification of ascending aortic peak velocities demonstrated bias of -0.05 m/s versus manual analysis [LOA: -0.26 to 0.15 m/s].
Introduction
4D flow MRI is a promising technique for evaluation of patients with aortic and valve disease, but it requires time-consuming preprocessing to correct for eddy currents, noise, and aliased velocity values, followed by 3D segmentation prior to hemodynamic analysis. Recently, convolutional neural networks (CNNs) have been developed to carry out these steps, promising to speed up and automate the process as well as reduce interobserver errors1. Prior work has focused on development and characterization of the individual CNNs; here we demonstrate a fully automated analysis pipeline with four subsequently executed CNNs. This pipeline used 4D flow MRI data as input and generated preprocessed velocity data, 3D segmentation of the thoracic aorta, mean aortic flow curve, and an aortic velocity maximum intensity projection (MIP) as outputs. We used this pipeline to automatically process a large cohort of >2000 subjects. Our goal was to evaluate pipeline performance by comparing against manual processing in a subset which were not used in CNN training.Methods
An automated pipeline was run on a large dataset consisting of 4D flow MRI scans from aortopathy patients with bicuspid aortic valve (BAV) or tricuspid aortic valve (TAV) and healthy volunteers from 2011-2020. Volunteers were prospectively IRB consented, and patients were retrospectively included with a waiver of consent.The pipeline was constructed to 1) transfer data locally from a server, 2) automatically preprocess and segment the data, 3) generate outputs for validation, and 4) transfer outputs to the server, see Figure 1. Four CNNs with identical 3D U-Net architecture2 with 3D DenseNet3 layers were trained to perform 1) eddy current correction (training N=320), 2) noise masking (training N=320), 3) velocity antialiasing (training N=153) and 4) 3D aortic segmentation (training N=499), described previously1,4,5. Eddy and noise CNNs were trained to input the velocity standard deviation and identify static tissue voxels for eddy current correction6 or noise voxels. The antialiasing CNN identified aliased voxels and was trained by artificially aliasing datasets with no aliasing. The segmentation CNN was trained to segment the aorta from a sum of squares PCMRA7 calculated from the 4D flow data using manual segmentations as a gold standard.
The pipeline also calculated a velocity maximum intensity projection (MIP) of masked velocity data in sagittal orientation for all cardiac time frames to visualize aortic flow dynamics, a curve of the mean velocity magnitude within the aorta mask, and PCMRA. The pipeline logged time taken for CNN execution and the total time for each scan and was executed on a workstation with an Intel i7-7700, 32GB of RAM, and an Nvidia Quadro P1000.
A subset of 69 manually analyzed 4D flow MRI data (by one of four observers) not included in CNN training/testing were used to validate the outputs of the pipeline. For quantification of ascending aorta (AAo) peak velocity in this subset of patients, a cutting plane was manually placed perpendicular to the midline at the takeoff of the innominate artery, and the 98% maximum systolic velocity was calculated in the AAo volume. The same 2D plane was used for the CNN-based segmentation to identify the AAo. Dice scores comparing the manual and automated segmentations were computed for the entire segmentation and AAo alone.
Results
The study included 122 healthy volunteers, 1391 BAV patients, and 571 tricuspid aortic valve patients, see table 1. The pipeline successfully processed 2055 of 2084 aortic 4D flow data (98.6%, errors in 29 datasets) over 240 hours with no user interaction. Runtimes are shown in table 2 and included 144.3 [125.3-163.3] seconds for CNN execution during 290.6 [232.1-349.0] seconds overall with data transfer, loading, and output generation. Sample outputs are shown in figure 2 for four subjects.Compared against 69 datasets processed manually, the median overall Dice score was 0.93 [0.91–0.95] and the median Dice score for the AAo was 0.93 [0.90–0.95]. Bland-Altman analysis of the AAo 98% maximum velocity showed bias of -0.05 m/s with limits of agreement -0.26 to 0.15 m/s. Bland-Altman analysis of the mean aortic velocity at peak systole showed bias -0.01 m/s with limits of agreement -0.07 to 0.05 m/s.
Discussion
This study demonstrates the feasibility of a fully automated AI-based pipeline for preprocessing, segmentation, and hemodynamic analysis of aortic 4D flow MRI. Median segmentation performance of Dice=0.93 was similar to interobserver agreement of median 0.95 found in earlier work1. In addition to the preprocessing and segmentation, the pipeline also generated anatomic (PCMRA, 3D segmentation) and hemodynamic (MIP, flow curve) outputs that can be used for quality control or assessment of clinically relevant questions (example: jet visualization, figure 2 bottom left).This study was limited by CNNs trained using a single vendor (Siemens) at one site, and only with sagittal-oblique scans. The current pipeline was also run on an external workstation with a GPU; the pipeline would optimally be run inline on the scanner hardware immediately after acquisition.
Conclusion
We demonstrate a CNN-based analysis pipeline for rapid and automated preprocessing, segmentation, and hemodynamic analysis of aortic 4D flow MRI. Future work could expand the pipeline to include more sophisticated hemodynamic analysis such as wall shear stress or expand the training data used to include different centers, protocols, and vendors.Acknowledgements
This study was funded with support from the National Heart, Lung, and Blood Institute of the National Institutes of Health (F30 HL 145995, R01 HL 115828, R01 HL 133504).References
- Berhane H, Scott M, Elbaz M, et al. Fully automated 3D aortic segmentation of 4D flow MRI for hemodynamic analysis using deep learning. Magnetic Resonance in Medicine 2020.
- Çiçek Ö, Abdulkadir A, Lienkamp SS, Brox T, Ronneberger O. 3D U-Net: Learning Dense Volumetric Segmentation from Sparse Annotation. Medical Image Computing and Computer-Assisted Intervention – MICCAI 2016. Cham: Springer International Publishing; 2016. p. 424-432.
- Huang G, Liu Z, Maaten vdL, Weinberger KQ. Densely Connected Convolutional Networks. 2017 IEEE Conference on Computer Vision and Pattern Recognition (CVPR) 2017.
- Berhane, H., Scott, M., Elbaz, M., McCarthy, P., Malaisrie, S., Carr, J., Avery, R., Barker, A., Robinson, J., Rigsby, C., Markl, M., Deep Learning-based Automated Detection and Correction of Velocity Aliasing in 4D Flow CMR, abstract at SCMR 20205.
- Scott, M., Berhane, H., Robinson, J. D., Rigsby, C. K., Markl, M., Deep learning for fully automated preprocessing and 3D segmentation of aortic 4D flow MRI, abstract at SMRA 2019
- Hofman MBM, Rodenburg MJA, Markenroth Bloch K, et al. In-vivo validation of interpolation-based phase offset correction in cardiovascular magnetic resonance flow quantification: a multi-vendor, multi-center study. J Cardiovasc Magn Reson 2019;21(1):30.
- Markl M, Harloff A, Bley TA, et al. Time-resolved 3D MR velocity mapping at 3T: improved navigator-gated assessment of vascular anatomy and blood flow. J Magn Reson Imaging 2007;25(4):824-831.
Figures

Figure 1: Top: Pipeline. 1. 4D flow data is pulled from server 2. Dicoms are loaded and the velocity standard deviation is input into the eddy current and noise masking CNNs. 3. Velocity data is fed into the antialiasing CNN. 4. Phase contrast MR angiogram (PCMRA) is calculated and input into the segmentation CNN. 5. Outputs are generated. 6. Results pushed back to the server. Bottom: example outputs. A: PCMRA, B: segmentation preview, C: velocity MIP, D: data preview, E: mean velocity flow curve.
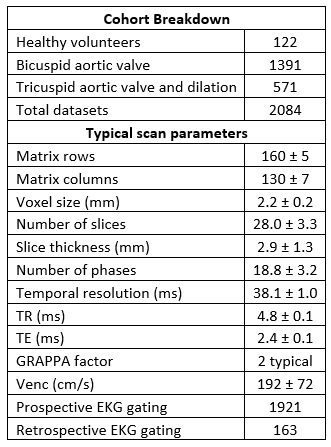
Table 1: Data summary. The cohort consisted of prospectively recruited healthy volunteers, patients with bicuspid aortic valve, and patients with tricuspid aortic valve and aortic dilation. All scans were acquired in sagittal-oblique orientation on Siemens MRI systems between 2011 and 2020. Scan parameters are presented as mean ± standard deviation.
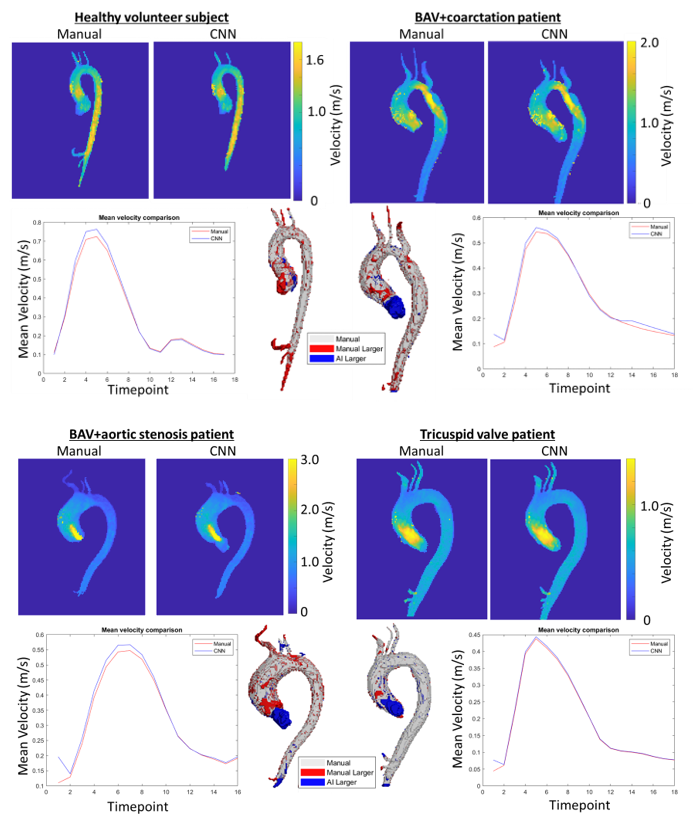
Figure 2: Example outputs. Top left: healthy subject, Top right: bicuspid aortic valve (BAV) and coarctation patient. Bottom left: BAV and stenosis patient, Bottom right: tricuspid valve patient. For each patient, peak systolic velocity maximum intensity projections for manual workflow (left) and CNN pipeline (right) are shown, as well as mean velocity curves for manual (red) and CNN (blue). In the 3D mask comparison, grey is shared, red volumes are larger in the manual, and blue volumes are larger in the CNN.
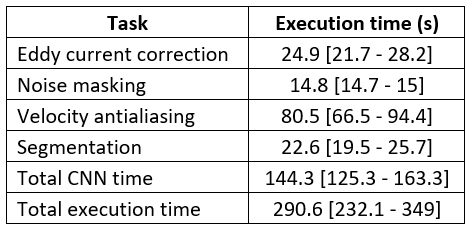
Table 2: Pipeline execution time per task. Total CNN time includes a small amount over overhead to update velocity values and calculate the phase contrast MR angiogram input for the segmentation network. Total execution time includes time required to transfer 4D flow dicoms from the server, all local processing time, and time taken to push outputs back to the server.
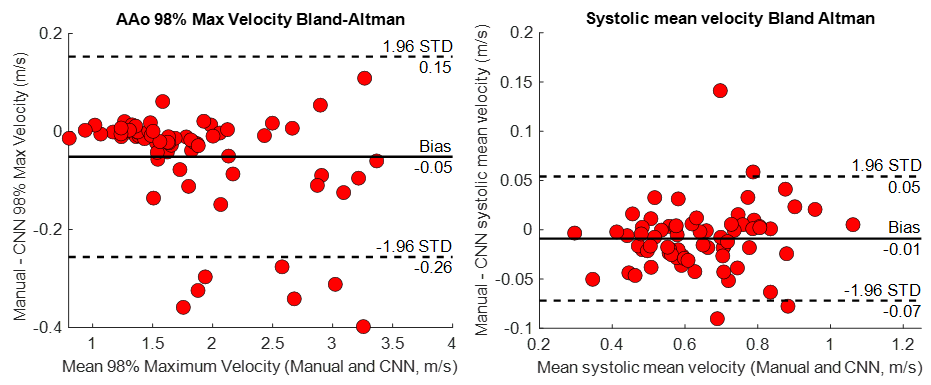
Figure 3: Left: Ascending aorta (AAo) 98% maximum velocity Bland-Altman analysis for a subset of N=69 subjects previously analyzed manually by one of four observers. A plane was manually placed to identify the AAo perpendicular to the midline in the manual segmentation, and the same plane was used to define the AAo volume in both segmentations. Right: Bland-Altman analysis of the mean velocity within the aorta mask at peak systole between the manual workflow and CNN pipeline.